 |
|
|
Daily Market Lookup
- Most Asian currencies moved little on Wednesday, while the dollar steadied from recent declines as markets awaited a widely expected interest rate cut by the Federal Reserve later in the day. Most regional currencies were sitting on strong gains against the dollar in recent sessions, as increasing confidence in a U.S. rate cut stymied the greenback. The dollar slid to a two-month low on Tuesday. But some weak economic readings weighed. The Japanese yen retreated on mixed trade data, while the Singapore dollar was pressured by a dismal export reading. Anticipation of a Bank of Japan meeting this week also kept markets on edge. Data showed the country’s trade balance shrank less than feared in August, with exports also falling less than expected as a recent trade deal with the U.S. offered some clarity. But exports still remained in contraction, while substantially softer-than-expected imports signaled that local demand remained weak. The print comes just days before a BOJ meeting, where the central bank is widely expected to leave interest rates unchanged amid heightened political uncertainty in the country. Still, the BOJ may offer hawkish signals amid sticky Japanese inflation and relatively steady private spending. Japanese consumer inflation data for August is due before the BOJ’s rate decision on Friday. Among broader Asian currencies, the Singapore dollar’s USD/SGD pair rose 0.1% as the country’s key non-oil exports unexpectedly shrank in August. The Chinese yuan’s USD/CNY pair fell 0.1%, encouraged by pledges of more stimulus measures from Beijing. Sustained policy support in currency markets saw the yuan perched at its strongest level since November 2024. The dollar index and dollar index futures both rose 0.1% in Asian trade, recovering from a two-month low. The greenback was battered by increasing conviction that the Fed will cut rates by at least 25 basis points on Wednesday, especially amid increasing signs of a cooling labor market. Some traders were also holding out for a larger 50 bps cut. But markets were uncertain over what the Fed will signal with regards to future monetary easing, especially given that recent economic prints also showed U.S. inflation remaining sticky. Fed Chair Jerome Powell has repeatedly flagged caution over the inflationary impact of higher U.S. trade tariffs, which in turn could delay future rate cuts.
- Oil prices eased slightly on Wednesday, after rising more than 1% in the previous session, though ongoing geopolitical jitters provided a floor under prices while traders also awaited an expected interest rate cut from the U.S. Federal Reserve. The benchmarks settled more than 1% higher in the last trading session due to concerns that Russian supplies may be disrupted. Reuters reported on Tuesday that three industry sources said Russia’s oil pipeline monopoly Transneft has warned producers they may have to cut output following Ukraine’s drone attacks on critical export ports and refineries. Investors are also awaiting the outcome of the Federal Reserve’s September 16–17 meeting, with a new governor, Stephen Miran, on leave from the Trump administration, joining the deliberations, and a second policymaker, Lisa Cook, still facing efforts by President Donald Trump to oust her. The central bank is widely expected to cut interest rates by 25 basis points on Wednesday, which should stimulate the economy and boost fuel demand. "Markets are betting on a 25-basis-point Fed rate cut tonight, which traders believe could ease borrowing costs and boost fuel demand," said Priyanka Sachdeva, a senior market analyst at Phillip Nova. She added that the rally has also been buoyed by geopolitical jitters and supply risks from conflicts. IG market analyst Tony Sycamore said the market’s focus will be on "how many members join Stephen Miran in dissenting in favour of a 50-basis point rate cut", whether its outlook indicates two or three 25-basis point cuts and "the tone of Fed Chair Powell during the press conference". Any "buy-the-rumour, sell-the-fact" reaction in risk assets, including crude oil, will be short-lived, given the possibility of follow-up 25-basis point rate cuts in October and December, Sycamore said. In a potentially bullish sign, data on Tuesday showed U.S. crude and gasoline stocks fell last week, while distillate stocks rose, market sources said, citing American Petroleum Institute figures Crude stocks fell by 3.42 million barrels, and gasoline inventories fell by 691,000 barrels in the week ending September 12, while distillate inventories rose by 1.91 million barrels from the prior week, the sources said. The market will be watching to see whether data from the U.S. Energy Information Administration on Wednesday matches that. A Reuters poll showed analysts estimated crude inventories fell by about 900,000 barrels last week, distillate stockpiles rose by about 1 million barrels and gasoline stockpiles rose by about 100,000 barrels
|
|
| Intraday RESISTANCE LEVELS |
| 17th September 2025 |
R1 |
R2 |
R3 |
| GOLD-XAU |
3684 |
3690-3700 |
3720-3731 |
| Silver-XAG |
42.10-42.60 |
43.00 |
43.60-44.00 |
| Crude Oil |
64.10 |
64.70-65.40-66.20 |
67.12-67.90-68.50 |
| EURO/USD |
1.1755 |
1.1790-1.1850 |
1.1890-1.1950 |
| GBP/USD |
1.3650-1,650 |
|
1.3680-1.3720 |
| USD/JPY |
147.30 148.10-148.50 149.00-149.90 |
150.50-151.20 |
151.60-152.00 |
| Intraday SUPPORTS LEVELS |
| 17th September 2025 |
S1 |
S2 |
S3 |
| GOLD-XAU |
3675-3662-3655 |
3630-3619-3600 |
3590-3578-3570 |
| Silver-XAG |
41.40-40.90-40.50-39.50 |
38.90-38.60-38.20 |
37.80-37.20-36.30 |
| Crude Oil |
63.50-62.70-62.05 |
61.50-60.60-60.05 |
59.40-58.30 |
| EURO/USD |
1.1690-1.1640 1.1600-1.1570 |
1.1545-1.1500 |
1.1470-1.1420 |
| GBP/USD |
1.3625-1.3550-1.3470 |
1.3410-1.3370 |
1.3310-1.3260-1.3200 |
| USD/JPY |
146.40-146.10 |
145.80-144.90 |
144.10 |
|
|
| Intra-Day Strategy (17th September 2025) |
| GOLD-XAU |
Sell on Strength |
| Silver-XAG |
Buy on Dips |
|
| Crude Oil |
Neutral to Sell |
| EUR/USD |
Neutral to Sell |
|
| GBP/USD |
Neutral to Buy |
| USD/JPY |
Neutral to Sell |
|
|
|
|
Gold – XAU
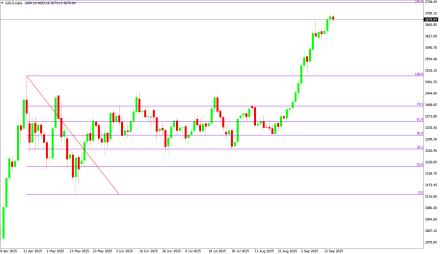
Gold on Tuesday made its intraday high of US$3702.98/oz and low of $3674.62/oz. Gold is up by 0.259% at US$3689.48/oz.
Technicals in Focus:
On the daily charts, gold trades higher than 20DMA (2197). If it drops below this level, it could lead to 2,100. The MACD is currently above the zero line and the histograms are showing an increasing trend, indicating that there may be upward movement in the coming sessions. The RSI is currently at 83.04, which is in the overbought region, suggesting there may be selling pressure in the next 2 to 3 sessions. The Stochastic Oscillator is also in the overbought territory but has given a positive crossover, indicating a bullish stance for intraday trades, but rebound in expected in all the overbought indicators.
Trading Strategy: Sell on Strength
Sell below 3684-3732 keeping stop loss closing above 3732, targeting 3675-3662-3655 and 3630-3619-3600.
Buy in between 3655-3534 with risk below 3534 targeting 3684-3690-3700 and 3720-2731.
|
|
| Intraday Support Levels |
| S1 |
|
|
3675-3662-3655 |
| S2 |
|
|
3630-3619-3600 |
| S3 |
|
|
3590-3578-3570 |
| Intraday Resistance Levels |
| R1 |
|
|
3684 |
| R2 |
|
|
3690-3700 |
| R3 |
|
|
3720-3731 |
| Technical Indicators
|
| Name |
|
Value |
Action |
| 14DRSI |
|
48.916 |
Buy |
| 20-DMA |
|
3037.81 |
Buy |
| 50-DMA |
|
2947.58 |
Buy |
| 100-DMA |
|
2805.46 |
Buy |
| 200-DMA |
|
2675.37 |
Buy |
| STOCH(5,3) |
|
16.616 |
Sell |
| MACD(12,26,9) |
|
33.045 |
Buy |
|
|
|
|
Silver - XAG
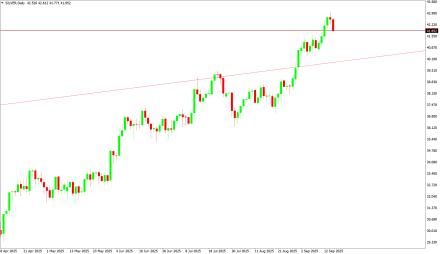
Silver on Tuesday its intraday high of US$42.95/oz and low of US$42.52/oz settle down by 0.297% at US$42.25/oz.
Technicals in Focus:
On daily charts, silver is sustaining above 20MA (25.05), breakage above will lead to 23.73. MACD is below the zero line and histograms are increasing trend, bringing a bullish stance in the upcoming sessions. RSI is in the oversold region, indicating a sell signal for now. The Stochastic Oscillator is in the overbought region and gives a positive crossover to show an upside move for the intraday trade.
Trading Strategy: Buy on Dips
Buy in between 41.70-33.10, targeting 38.90-39.50 and 39.90-40.50-41.10 with stop loss should be placed on the breakage below 33.00.
Sell in between 42.20-44.00 with a stop loss above 44.00 targeting 41.40-40.70-40.10-39.50 and 38.20-37.80-37.20.
|
|
| Intraday Support Levels |
| S1 |
|
|
41.40-40.90-40.50-39.50 |
| S2 |
|
|
38.90-38.60-38.20 |
| S3 |
|
|
37.80-37.20-36.30 |
| Intraday Resistance Levels |
| R1 |
|
|
42.10-42.60 |
| R2 |
|
|
43.00 |
| R3 |
|
|
43.60-44.00 |
| TECHNICAL INDICATORS |
| Name |
|
Value |
Action |
| 14DRSI |
|
51.404 |
Buy |
| 20-DMA |
|
32.48 |
Sell |
| 50-DMA |
|
32.45 |
Sell |
| 100-DMA |
|
31.41 |
Sell |
| 200-DMA |
|
30.87 |
Sell |
| STOCH(5,3) |
|
23.195 |
Buy |
| MACD(12,26,9) |
|
0.5705 |
Buy |
|
|
|
|
Oil - WTI
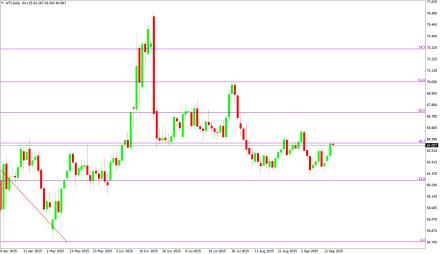
Crude Oil on Tuesday high of US$64.37/bbl, an intraday low of US$62.61/bbl, and settled up by 1.814% to close at US$641.13/bbl.
Technicals in Focus:
On daily charts, oil is sustaining above its 100DMA i.e. 75.37, a support level, and breakage above will call for 77.48. MACD is above the zero line and histograms are in increasing mode will bring a bullish stance in the upcoming sessions. The Stochastic Oscillator is in the overbought region, giving a negative crossover to confirm a bearish stance; while the RSI is in the neutral region, more upside can be expected to reach the overbought region, which is highly probable
Trading Strategy: Neutral to Sell
Sell in between 64.00-72.00 with stop loss at 72.00; targeting 62.70-62.00 and 61.50-60.60-60.05.
Buy above 63.50-58.00 with risk daily closing below 58.00, targeting 64.10 and 64.70-65.40-66.20-67.10.
|
|
| Intraday Support Levels |
| S1 |
|
|
63.50-62.70-62.05 |
| S2 |
|
|
61.50-60.60-60.05 |
| S3 |
|
|
59.40-58.30 |
| Intraday Resistance Levels |
| R1 |
|
|
64.10 |
| R2 |
|
|
64.70-65.40-66.20 |
| R3 |
|
|
67.12-67.90-68.50 |
| TECHNICAL INDICATORS |
| Name |
|
Value |
Action |
| 14DRSI |
|
29.346 |
Sell |
| 20-DMA |
|
67.35 |
Sell |
| 50-DMA |
|
69.06 |
Sell |
| 100-DMA |
|
70.28 |
Sell |
| 200-DMA |
|
71.85 |
Sell |
| STOCH(5,3) |
|
16.166 |
Sell |
| MACD(12,26,9) |
|
-1.306 |
Buy |
|
|
|
|
EUR/USD
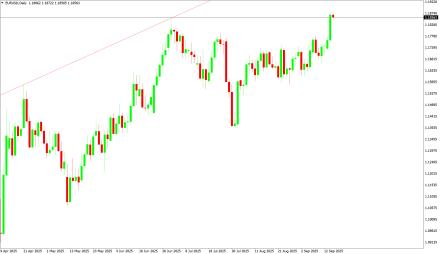
EUR/USD on Tuesday an intraday low of US$1.1756/EUR, a high of US$1.1877/EUR, and settled the day up by 0.900% to close at US$1.1866/EUR.
Technicals in Focus:
On daily charts, prices are sustaining above 100DMA (1.0800), which becomes immediate support, a break below will target 1.0717. MACD is above the zero line and histograms are increasing mode, bringing a bullish view. Stochastic is in oversold territory, giving negative crossovers to the bullish outlook for intraday. 14D RSI is currently in a neutral region and giving no directions to consider right now.
Trading Strategy: Neutral to Sell
Sell below 1.1755-1.1990, targeting 1.1640-1.1590-1.1545 and 1.1500-1.1470-1.1420 with stop-loss at daily closing above 1.1990.
Buy above 1.1690-1.1110 with risk below 1.1100 targeting 1.1755-1.1790 and 1.1850-1.1890.
|
|
| Intraday Support Levels |
| S1 |
|
|
1.1690-1.1640 1.1600-1.1570 |
| S2 |
|
|
1.1545-1.1500 |
| S3 |
|
|
1.1470-1.1420 |
| Intraday Resistance Levels |
| R1 |
|
|
1.1755 |
| R2 |
|
|
1.1790-1.1850 |
| R3 |
|
|
1.1890-1.1950 |
| TECHNICAL INDICATORS |
| Name |
|
Value |
Action |
| 14DRSI |
|
37.566 |
Buy |
| 20-DMA |
|
1.0838 |
Sell |
| 50-DMA |
|
1.0978 |
Buy |
| 100-DMA |
|
1.0940 |
Buy |
| 200-DMA |
|
1.0868 |
Buy |
| STOCH(5,3) |
|
34.688 |
Sell |
| MACD(12,26,9) |
|
-0.0013 |
Buy |
|
|
|
|
GBP/USD
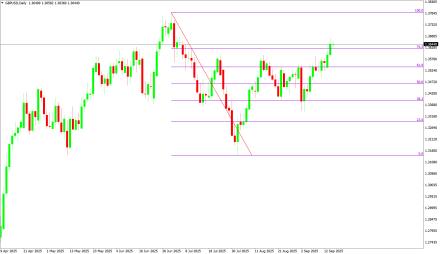
GBP/USD on Tuesday low of US$1.3589/GBP, a high of US$1.3671/GBP, and settled the day down by 0.12% to close at US$1.3642/GBP.
Technicals in Focus:
On daily charts, prices are sustaining above 50DMA (1.2674) is becoming a support level. 14-D RSI is currently in a neutral region and direction is difficult to predict on an RSI basis. The Stochastic Oscillator is in oversold territory and gives a positive crossover to confirm a bullish stance. MACD is above the zero line, but histograms are increasing leading to movement.
Trading Strategy: Neutral to Buy
Based on the charts and explanations above; buy in between 1.3625-1.3040 with a target of 1.3470-1.3550 and 1.3600-1.3625-1.3680-1.3720 with a stop loss closing below 1.3040.
Sell in between 1.625-1.3850 with targets at 1.3479-1.3410-1.3370-1.3310 and 1.3260-1.3200-1.3160 with a stop loss of 1.3850.
|
|
| Intraday Support Levels |
| S1 |
|
|
1.3625-1.3550-1.3470 |
| S2 |
|
|
1.3410-1.3370 |
| S3 |
|
|
1.3310-1.3260-1.3200 |
| Intraday Resistance Levels |
| R1 |
|
|
1.3650-1,650 |
| R2 |
|
|
|
| R3 |
|
|
1.3680-1.3720 |
| TECHNICAL INDICATORS |
| Name |
|
Value |
Action |
| 14DRSI |
|
46.905 |
Buy |
| 20-DMA |
|
1.2932 |
Buy |
| 50-DMA |
|
1.2736 |
Buy |
| 100-DMA |
|
1.2629 |
Buy |
| 200-DMA |
|
1.2811 |
Buy |
| STOCH(5,3) |
|
9.458 |
Buy |
| MACD(12,26,9) |
|
-0.003 |
Sell |
|
|
|
|
USD/JPY
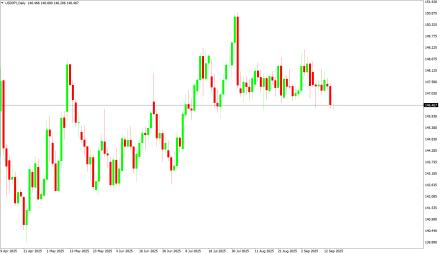
USD/JPY on Tuesday an intra‐day low of JPY146.27/USD an intraday high of 147.53/USD, and settled the day down by 0.612% at JPY147.46/USD.
Technicals in Focus:
In daily charts, JPY is sustaining above 100DMA (152.35), major support on the daily chart. 14-D RSI is currently in the overbought region and chances of downward are expected based on RSI. MACD is above the zero line but histograms are decreasing mode which might lead to downward movement. The Stochastic Oscillator is in overbought territory and signaling to sell as it has given a negative crossover to confirm a bearish stance.
Trading Strategy: Neutral to Sell
Sell below 147.00-154.00 with risk above 154.00 targeting 147.40 and 146.60-146.10-145.20-144.70.
Long positions above 146.40-144.00 with targets of 148.10-148.70-149.35 and 149.90-150.50-151.20-151.60 with stops below 144.00.
|
|
| Intraday Support Levels |
| S1 |
|
|
146.40-146.10 |
| S2 |
|
|
145.80-144.90 |
| S3 |
|
|
144.10 |
| INTRADAY RESISTANCE LEVELS |
| R1 |
|
|
147.30 148.10-148.50 149.00-149.90 |
| R2 |
|
|
150.50-151.20 |
| R3 |
|
|
151.60-152.00 |
| TECHNICAL INDICATORS |
| Name |
|
Value |
Action |
| 14DRSI |
|
41.14 |
Buy |
| 20-DMA |
|
148.91 |
Buy |
| 50-DMA |
|
150.24 |
Buy |
| 100-DMA |
|
152.53 |
Buy |
| 200-DMA |
|
151.18 |
Buy |
| STOCH(9,6) |
|
93.662 |
Sell |
| MACD(12,26,9) |
|
0.683 |
Sell |
|
|
|
 |