 |
|
|
Daily Market Lookup
- The dollar’s safe-haven appeal has faded hard since President Donald Trump returned to the White House, with the greenback now marked down double digits. Morgan Stanley is bracing investors for even more pain ahead, warning that policy uncertainty and shifting global flows will keep the pressure on. The dollar index was up 0.5% on Tuesday to 98.31, but down about 11% since Trump took office. Further pain is likely ahead, with Morgan Stanley forecasting the greenback to slump to 91 but mid-2026. “Policy uncertainty will likely drive foreign investors to up their FX-hedging ratios, putting pressure on the dollar,” Morgan Stanley said in a recent note. Despite strong flows into U.S. assets and booming demand for Treasurys, the bank warns that rising risk premiums, a coming convergence in U.S. interest rates with peers, and renewed debate over the dollar’s status as the globe’s safety trade will cap any rebound in the months ahead. Markets may feel “exuberant, although maybe not entirely irrational yet," with investors betting on positive shifts in growth, but the overall call is one of caution. Morgan Stanley highlights that “whether and how much risk premiums should be attached to US assets remains a debate reflected in cross-asset correlations,” as the risk-on mood obscures a more fundamental shift in market dynamics. With the dollar’s best days behind it for now, attention turns to tactical positioning and protection as the U.S. currency enters the final stretch of 2025 facing a wall of skepticism.
- Gold prices hit a record high in Asian trade on Wednesday, crossing $4,000 an ounce for the first time as safe haven demand grew amid heightened political and economic uncertainty. Bets on more interest rate cuts by the U.S. Federal Reserve also buoyed bullion, with focus turning to upcoming addresses by several officials this week. Bullion demand was fueled by increased uncertainty over the U.S. economy, as a government shutdown appeared set to enter its second consecutive week. Political deadlock in Congress, over a government funding bill, showed few signs of clearing despite mediation attempts by President Donald Trump. While a government shutdown has historically had limited impact on the economy, White House officials warned that this time may be different. A mounting political crisis in France also spurred risk aversion, especially after Prime Minister Sebastien Lecornu resigned just hours after announcing his cabinet over the weekend. In Japan, doubts over stretched fiscal spending grew after fiscal dove Sanae Takaichi was elected as the leader of the ruling party. Takaichi is expected to oppose any plans to hike interest rates by the Bank of Japan, and is also expected to dole out more fiscal spending and tax breaks. Questions grew over just how Takaichi will fund her fiscal agenda, especially amid souring investor sentiment towards Japanese government bonds. The government shutdown delayed the release of several key economic readings, which saw focus shift towards private data, especially on the labor market. Private readings released last week showed a sustained decline in jobs growth, fueling bets on more rate cuts by the Fed. The minutes of the Fed’s September meeting are due on Wednesday, offering more insight into the central bank’s decision to cut rates by 25 basis points. Markets are pricing in a nearly 100% chance for another 25 bps cut later in October, CME Fedwatch showed. A host of Fed officials are set to speak in the coming days, with Chair Jerome Powell scheduled to speak on Thursday.
- Oil prices rose on Wednesday as investors brushed off oversupply fears, having digested a decision earlier by OPEC+ to restrain production increases next month. The benchmarks settled broadly flat in the previous session as investors weighed signs of a supply glut against a smaller-than-expected increase to November output from the Organization of the Petroleum Exporting Countries and affiliates. Prices are trading higher for now as some traders are holding long positions, or bets that prices will rise, on continued efforts to curb Russian crude flows, Jamil added. OPEC+ had opted for a rise of 137,000 barrels a day, the lowest amount among options the group discussed at the weekend. Price gains are however capped as fears of Russian supply disruption eased, with crude oil shipments holding close to a 16-month high over the past four weeks, the ANZ analysts said. Investors are also awaiting U.S. inventory data from the Energy Information Administration later on Wednesday. On Tuesday, sources American Petroleum Institute figures said U.S. crude stocks rose by 2.78 million barrels in the week ended October 3 Conversely, gasoline and distillate inventories fell, the sources said, citing the API data. Meanwhile, U.S. oil production is likely to set a larger record this year than previously expected, the EIA said on Tuesday.
|
|
| Intraday RESISTANCE LEVELS |
| 8th October 2025 |
R1 |
R2 |
R3 |
| GOLD-XAU |
4024-4031 |
4040-4050 |
4064-4080-4100 |
| Silver-XAG |
48.15-48.75 |
49.30-49.80-50.10 |
50.60-51.00 |
| Crude Oil |
62.05-62.70 |
63.50-64.10-64.70 |
65.40-66.20 |
| EURO/USD |
1.1690-1.1640-1.1755-1.1790- |
1.1850-1.1890 |
1.1920-1.1950 |
| GBP/USD |
1.3410-1.3490 1.3550-1.3625 |
1.3650-1.3680 |
1.3720-1.3800 |
| USD/JPY |
152.65-153.10- |
153.60-154.00 |
154.60-155.50 |
| Intraday SUPPORTS LEVELS |
| 8th October 2025 |
S1 |
S2 |
S3 |
| GOLD-XAU |
4010-3995-3984 |
3970-3950-3925 |
3915-3894-3885 |
| Silver-XAG |
47.60-47.00-46.50-45.40 |
45.00-44.25-44.00 |
43.60-43.00-42.60 |
| Crude Oil |
61.50-60.60-60.05 |
59.40-58.70 |
58.00-57.65-57.00 |
| EURO/USD |
1.1600-1.1570 |
1.1545-1.1524 |
1.1495-1.1445 |
| GBP/USD |
1.3370 |
1.3310-1.3260 |
1.3200-1.3150 |
| USD/JPY |
152.00-151.60 151.20-150.50 |
149.90-149.00 |
148.50-148.10 |
|
|
| Intra-Day Strategy (8th October 2025) |
| GOLD-XAU |
Sell on Strength |
| Silver-XAG |
Buy on Dips |
|
| Crude Oil |
Neutral to Sell |
| EUR/USD |
Neutral to Sell |
|
| GBP/USD |
Neutral to Buy |
| USD/JPY |
Neutral to Sell |
|
|
|
|
Gold – XAU
Gold on Tuesday made its intraday high of US$3990.93/oz and low of $3940.79/oz. God is up by 0.646% at US$3984.27/oz.
Technicals in Focus:
On the daily charts, gold trades higher than 20DMA (2197). If it drops below this level, it could lead to 2,100. The MACD is currently above the zero line and the histograms are showing an increasing trend, indicating that there may be upward movement in the coming sessions. The RSI is currently at 83.04, which is in the overbought region, suggesting there may be selling pressure in the next 2 to 3 sessions. The Stochastic Oscillator is also in the overbought territory but has given a positive crossover, indicating a bullish stance for intraday trades, but rebound in expected in all the overbought indicators.
Trading Strategy: Sell on Strength
Sell below 4030-4110 keeping stop loss closing above 4050, targeting 4010-3995-3984-3970 and 3950-3925-3915
Buy in between 3970-4050 with risk below 4050 targeting 4024-4031-4040 and 4050-4064-4080.
|
|
| Intraday Support Levels |
| S1 |
|
|
4010-3995-3984 |
| S2 |
|
|
3970-3950-3925 |
| S3 |
|
|
3915-3894-3885 |
| Intraday Resistance Levels |
| R1 |
|
|
4024-4031 |
| R2 |
|
|
4040-4050 |
| R3 |
|
|
4064-4080-4100 |
| Technical Indicators
|
| Name |
|
Value |
Action |
| 14DRSI |
|
48.916 |
Buy |
| 20-DMA |
|
3037.81 |
Buy |
| 50-DMA |
|
2947.58 |
Buy |
| 100-DMA |
|
2805.46 |
Buy |
| 200-DMA |
|
2675.37 |
Buy |
| STOCH(5,3) |
|
16.616 |
Sell |
| MACD(12,26,9) |
|
33.045 |
Buy |
|
|
|
|
Silver - XAG
Silver on Tuesday its intraday high of US$48.63/oz and low of US$47.31/oz settle down by 1.354% at US$47.78/oz.
Technicals in Focus:
On daily charts, silver is sustaining above 20MA (25.05), breakage above will lead to 23.73. MACD is below the zero line and histograms are increasing trend, bringing a bullish stance in the upcoming sessions. RSI is in the oversold region, indicating a sell signal for now. The Stochastic Oscillator is in the overbought region and gives a positive crossover to show an upside move for the intraday trade.
Trading Strategy: Buy on Dips
Buy in between 46.60-40.00, targeting 47.00-47.60-48.15 and 48.75-49.30-49.80-50.10 with stop loss should be placed on the breakage below 40.00.
Sell in between 47.00-50.10 with a stop loss above 50.00 targeting 45.90-45.40-45.00-44.25 and 44.00-43.60-42.60-41.40.
|
|
| Intraday Support Levels |
| S1 |
|
|
47.60-47.00-46.50-45.40 |
| S2 |
|
|
45.00-44.25-44.00 |
| S3 |
|
|
43.60-43.00-42.60 |
| Intraday Resistance Levels |
| R1 |
|
|
48.15-48.75 |
| R2 |
|
|
49.30-49.80-50.10 |
| R3 |
|
|
50.60-51.00 |
| TECHNICAL INDICATORS |
| Name |
|
Value |
Action |
| 14DRSI |
|
51.404 |
Buy |
| 20-DMA |
|
32.48 |
Sell |
| 50-DMA |
|
32.45 |
Sell |
| 100-DMA |
|
31.41 |
Sell |
| 200-DMA |
|
30.87 |
Sell |
| STOCH(5,3) |
|
23.195 |
Buy |
| MACD(12,26,9) |
|
0.5705 |
Buy |
|
|
|
|
Oil - WTI
Crude Oil on Tuesday high of US$61.77/bbl, an intraday low of US$60.48/bbl, and settled up by 0.289% to close at US$61.67/bbl.
Technicals in Focus:
On daily charts, oil is sustaining above its 100DMA i.e. 75.37, a support level, and breakage above will call for 77.48. MACD is above the zero line and histograms are in increasing mode will bring a bullish stance in the upcoming sessions. The Stochastic Oscillator is in the overbought region, giving a negative crossover to confirm a bearish stance; while the RSI is in the neutral region, more upside can be expected to reach the overbought region, which is highly probable.
Trading Strategy: Neutral to Sell
Sell in between 61.50-70.00 with stop loss at 70.00; targeting 60.60-60.05-59.40 and 58.70-58.00-57.65.
Buy above 60.60-59.00 with risk daily closing below 60.00, targeting 62.05-62.70-63.50-64.10 and 65.40-66.20-67.20.
|
|
| Intraday Support Levels |
| S1 |
|
|
61.50-60.60-60.05 |
| S2 |
|
|
59.40-58.70 |
| S3 |
|
|
58.00-57.65-57.00 |
| Intraday Resistance Levels |
| R1 |
|
|
62.05-62.70 |
| R2 |
|
|
63.50-64.10-64.70 |
| R3 |
|
|
65.40-66.20 |
| TECHNICAL INDICATORS |
| Name |
|
Value |
Action |
| 14DRSI |
|
29.346 |
Sell |
| 20-DMA |
|
67.35 |
Sell |
| 50-DMA |
|
69.06 |
Sell |
| 100-DMA |
|
70.28 |
Sell |
| 200-DMA |
|
71.85 |
Sell |
| STOCH(5,3) |
|
16.166 |
Sell |
| MACD(12,26,9) |
|
-1.306 |
Buy |
|
|
|
|
EUR/USD
EUR/USD on Tuesday an intraday low of US$1.1646/EUR, a high of US$1.1713/EUR, and settled the day down by 0.453% to close at US$1.1655/EUR.
Technicals in Focus:
On daily charts, prices are sustaining above 100DMA (1.0800), which becomes immediate support, a break below will target 1.0717. MACD is above the zero line and histograms are increasing mode, bringing a bullish view. Stochastic is in oversold territory, giving negative crossovers to the bullish outlook for intraday. 14D RSI is currently in a neutral region and giving no directions to consider right now.
Trading Strategy: Neutral to Sell
Sell below 1.1690-1.1990, targeting 1.1640-1.1590 and 1.1545-1.1500-1.1470 with stop-loss at daily closing above 1.1990.
Buy above 1.1610-1.1110 with risk below 1.1100 targeting 1.1790-1.1850-1.1890-1.1920 and 1.1950-1.1990-1.2040.
|
|
| Intraday Support Levels |
| S1 |
|
|
1.1600-1.1570 |
| S2 |
|
|
1.1545-1.1524 |
| S3 |
|
|
1.1495-1.1445 |
| Intraday Resistance Levels |
| R1 |
|
|
1.1690-1.1640-1.1755-1.1790- |
| R2 |
|
|
1.1850-1.1890 |
| R3 |
|
|
1.1920-1.1950 |
| TECHNICAL INDICATORS |
| Name |
|
Value |
Action |
| 14DRSI |
|
37.566 |
Buy |
| 20-DMA |
|
1.0838 |
Sell |
| 50-DMA |
|
1.0978 |
Buy |
| 100-DMA |
|
1.0940 |
Buy |
| 200-DMA |
|
1.0868 |
Buy |
| STOCH(5,3) |
|
34.688 |
Sell |
| MACD(12,26,9) |
|
-0.0013 |
Buy |
|
|
|
|
GBP/USD
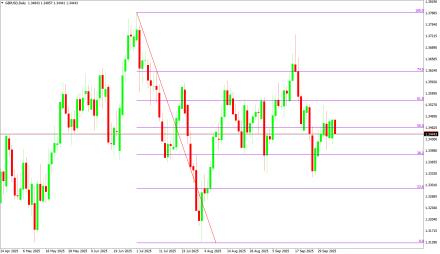
GBP/USD on Tuesday low of US$1.3391/GBP, a high of US$1.3485/GBP, and settled the day down by 0.472% to close at US$1.3420/GBP.
Technicals in Focus:
On daily charts, prices are sustaining above 50DMA (1.2674) is becoming a support level. 14-D RSI is currently in a neutral region and direction is difficult to predict on an RSI basis. The Stochastic Oscillator is in oversold territory and gives a positive crossover to confirm a bullish stance. MACD is above the zero line, but histograms are increasing leading to movement.
Trading Strategy: Neutral to Buy
Based on the charts and explanations above; buy in between 1.3370-1.3040 with a target of 1.3410-1.3470-1.3550 and 1.3600-1.3625-1.3680-1.3720 with a stop loss closing below 1.3040.
Sell in between 1.3410-1.3850 with targets at 1.3370-1.3310 and 1.3260-1.3200-1.3160 with a stop loss of 1.3850.
|
|
| Intraday Support Levels |
| S1 |
|
|
1.3370 |
| S2 |
|
|
1.3310-1.3260 |
| S3 |
|
|
1.3200-1.3150 |
| Intraday Resistance Levels |
| R1 |
|
|
1.3410-1.3490 1.3550-1.3625 |
| R2 |
|
|
1.3650-1.3680 |
| R3 |
|
|
1.3720-1.3800 |
| TECHNICAL INDICATORS |
| Name |
|
Value |
Action |
| 14DRSI |
|
46.905 |
Buy |
| 20-DMA |
|
1.2932 |
Buy |
| 50-DMA |
|
1.2736 |
Buy |
| 100-DMA |
|
1.2629 |
Buy |
| 200-DMA |
|
1.2811 |
Buy |
| STOCH(5,3) |
|
9.458 |
Buy |
| MACD(12,26,9) |
|
-0.003 |
Sell |
|
|
|
|
USD/JPY
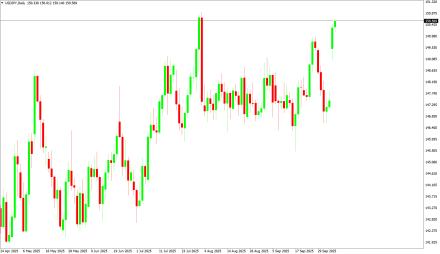
USD/JPY on Tuesday an intra‐day low of JPY150.14/USD an intraday high of 152.03/USD, and settled the day up by 1.023% at JPY151.86/USD.
Technicals in Focus:
In daily charts, JPY is sustaining above 100DMA (152.35), major support on the daily chart. 14-D RSI is currently in the overbought region and chances of downward are expected based on RSI. MACD is above the zero line but histograms are decreasing mode which might lead to downward movement. The Stochastic Oscillator is in overbought territory and signaling to sell as it has given a negative crossover to confirm a bearish stance.
Trading Strategy: Neutral to Sell
Sell below 152.50-154.00 with risk above 154.00 targeting 152.00-151.60-151.20-150.50 and 149.90-149.00-148.10.
Long positions above 152.00-148.00 with targets of 152.65-153.10-153.60 and 154.00-154.60-155.50with stops below 144.00.
|
|
| Intraday Support Levels |
| S1 |
|
|
152.00-151.60 151.20-150.50 |
| S2 |
|
|
149.90-149.00 |
| S3 |
|
|
148.50-148.10 |
| INTRADAY RESISTANCE LEVELS |
| R1 |
|
|
152.65-153.10- |
| R2 |
|
|
153.60-154.00 |
| R3 |
|
|
154.60-155.50 |
| TECHNICAL INDICATORS |
| Name |
|
Value |
Action |
| 14DRSI |
|
41.14 |
Buy |
| 20-DMA |
|
148.91 |
Buy |
| 50-DMA |
|
150.24 |
Buy |
| 100-DMA |
|
152.53 |
Buy |
| 200-DMA |
|
151.18 |
Buy |
| STOCH(9,6) |
|
93.662 |
Sell |
| MACD(12,26,9) |
|
0.683 |
Sell |
|
|
|
 |