 |
|
|
Daily Market Lookup
- The dollar advanced against the euro and yen on Monday, after a change in rhetoric from U.S. President Donald Trump lowered the temperature of simmering trade tensions with China. The broadside revived bad memories of Trump’s Liberation Day rollout of sweeping tariffs in April and sparked a selloff in stocks and cryptocurrencies on Friday. "Traditionally, the U.S. dollar strengthens when there’s any kind of risk-off or any kind of stress across asset classes or markets and, like Liberation Day, the opposite happened because of trade tensions between the U.S. and fellow trade partners in this case, China. Any time something like that comes up, people actually sell the U.S. dollar," Epstein said. After announcing the 100% tariffs on Friday, Trump said on Sunday: "Don’t worry about China, it will all be fine!" Trump remains on track to meet Chinese leader Xi Jinping in South Korea in late October as the two sides try to de-escalate tensions over tariff threats and export controls, U.S. Treasury Secretary Scott Bessent said on Monday. Trade tensions could weigh on the Federal Reserve’s interest rate decision at its next meeting, Thierry Wizman, FX and rates strategist, said in an investor note. European markets broadly shrugged off the French presidency’s announcement of Prime Minister Sebastien Lecornu’s new cabinet lineup on Sunday, reappointing Roland Lescure, a close ally of Emmanuel Macron, as finance minister. Markets assessed the path ahead for Japan’s new Liberal Democratic Party leader Sanae Takaichi after Komeito quit the ruling coalition on Friday, dealing a blow to her hopes of becoming the first female prime minister of the world’s fourth-largest economy. Traders will often borrow in a low-yielding currency to invest in a higher-yielder, known as a carry trade. The Japanese yen and Swiss franc have typically been funding currencies and took a harder knock than others on Monday. The crypto sector last Friday experienced over $19 billion in liquidations of leveraged positions, which market players said were the largest in history, after Trump announced the tariffs on Chinese imports and hinted at possible export restrictions on key software.
- Gold prices climbed to a new record high above $4,100 per ounce in Asian trading on Tuesday, as renewed tensions between the U.S. and China spurred a rush into safe-haven assets, while Silver also rallied to fresh peaks. The latest flare-up came after former U.S. President Donald Trump threatened to impose 10% tariffs on Chinese imports in response to Beijing’s curbs on exports of critical minerals used in electronics and defense. Trump later tempered his stance, posting on social media that “Don’t worry about China” and that the U.S. was not seeking any harm to China. Treasury Secretary Scott Bessent told Fox Business Network that a meeting between Trump and Chinese President Xi Jinping was still planned later this month in South Korea, signaling some hope for dialogue. China’s Ministry of Commerce on Tuesday confirmed that working-level discussions with the U.S. are ongoing this week, while vowing to “fight till the end” against U.S. measures. The mixed signals underscored the uncertainty fueling the gold rally. The U.S. dollar weakened slightly, further supporting bullion,
- Oil prices rose on Tuesday as early signs of a thaw in U.S.-China trade tensions bolstered market sentiment, alleviating concerns over global fuel demand. U.S. President Donald Trump remains committed to meeting Chinese President Xi Jinping in South Korea this month, Treasury Secretary Scott Bessent said on Monday, as both countries try to defuse tension over tariff threats and export controls. There were substantial communications between the two sides over the weekend and more meetings were expected, he added. The prospect of improved trade ties between the world’s two largest economies has historically buoyed oil markets, as investors anticipate stronger global growth and increased fuel demand. However, recent developments, such as Beijing’s expanded export controls on rare earths and Trump’s threats of 100% tariffs and software export curbs from November 1, have weighed on sentiment. Last week, oil prices posted weekly losses and touched their lowest levels since May. Trump had also cast doubt on prospects for a meeting with Xi during the Asia-Pacific Economic Cooperation (APEC) summit in South Korea set for October 30 and November 1, saying on Truth Social, "Now there seems to be no reason to do so." While the selloff in markets seems to be limited by the more conciliatory tone between Washington and Beijing, their relations are expected to stay in the spotlight. Limiting the market’s upside, Trump declared the end on Monday of the two-year-long Gaza war that has disrupted the wider Middle East. In its monthly report on Monday, the Organization of the Petroleum Exporting Countries, and allies including Russia, said the oil market’s supply shortfall would shrink in 2026, as the wider OPEC+ alliance proceeds with planned output increases.
|
|
| Intraday RESISTANCE LEVELS |
| 14th October 2025 |
R1 |
R2 |
R3 |
| GOLD-XAU |
4170-4184 |
4200-4210 |
4229-4240 |
| Silver-XAG |
53.50-54.00 |
54.40-55.00 |
55.60 |
| Crude Oil |
59.40-60.60-60.05 |
61.50-62.05-62.70 |
63.50-64.10-64.70 |
| EURO/USD |
1.1640 1.1690-1.1755 |
1.1790-1.1850 |
1.1890-1.1920 |
| GBP/USD |
1.3370-1.3410-1.3490 1.3550-1.3625 |
1.3650-1.3680 |
1.3720-1.3800 |
| USD/JPY |
152.00-152.65-153.10 |
153.60-154.00 |
154.60-155.50 |
| Intraday SUPPORTS LEVELS |
| 14th October 2025 |
S1 |
S2 |
S3 |
| GOLD-XAU |
4110-4090-4080 |
4064-4050-4040 |
4031-4010-3995 |
| Silver-XAG |
52.90-52.00-51.70 |
51.00-50.60-50.10 |
49.80-49.30-48.75 |
| Crude Oil |
59.00-58.70-58.00 |
57.40-56.90-56.10 |
55.50-55.07 |
| EURO/USD |
1.1600-1.1570 |
1.1545-1.1524 |
1.1495-1.1445 |
| GBP/USD |
1.3300-1.3260 |
1.3200-1.3150 |
1.3100 |
| USD/JPY |
151.60 |
151.20 150.50-149.90 |
149.00-148.50 |
|
|
| Intra-Day Strategy (14th October 2025) |
| GOLD-XAU |
Sell on Strength |
| Silver-XAG |
Buy on Dips |
|
| Crude Oil |
Neutral to Sell |
| EUR/USD |
Neutral to Sell |
|
| GBP/USD |
Neutral to Buy |
| USD/JPY |
Neutral to Sell |
|
|
|
|
Gold – XAU
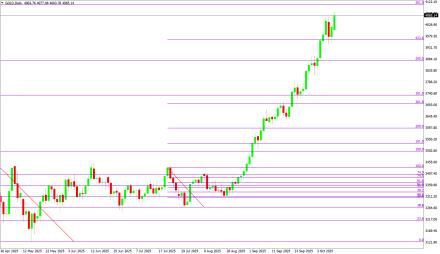
Gold on Monday made its intraday high of US$4116.93/oz and low of $4003.76/oz. God is up by 2.66% at US$4110.28/oz.
Technicals in Focus:
On the daily charts, gold trades higher than 20DMA (2197). If it drops below this level, it could lead to 2,100. The MACD is currently above the zero line and the histograms are showing an increasing trend, indicating that there may be upward movement in the coming sessions. The RSI is currently at 83.04, which is in the overbought region, suggesting there may be selling pressure in the next 2 to 3 sessions. The Stochastic Oscillator is also in the overbought territory but has given a positive crossover, indicating a bullish stance for intraday trades, but rebound in expected in all the overbought indicators.
Trading Strategy: Sell on Strength
Sell below 4170-4240 keeping stop loss closing above 4240, targeting 4110-4090-4080 and 4064-4050-4031-4010.
Buy in between 4110-3970 with risk below 3900 targeting 4170-4184-4200 and 4210-4229-4240.
|
|
| Intraday Support Levels |
| S1 |
|
|
4110-4090-4080 |
| S2 |
|
|
4064-4050-4040 |
| S3 |
|
|
4031-4010-3995 |
| Intraday Resistance Levels |
| R1 |
|
|
4170-4184 |
| R2 |
|
|
4200-4210 |
| R3 |
|
|
4229-4240 |
| Technical Indicators
|
| Name |
|
Value |
Action |
| 14DRSI |
|
48.916 |
Buy |
| 20-DMA |
|
3037.81 |
Buy |
| 50-DMA |
|
2947.58 |
Buy |
| 100-DMA |
|
2805.46 |
Buy |
| 200-DMA |
|
2675.37 |
Buy |
| STOCH(5,3) |
|
16.616 |
Sell |
| MACD(12,26,9) |
|
33.045 |
Buy |
|
|
|
|
Silver - XAG
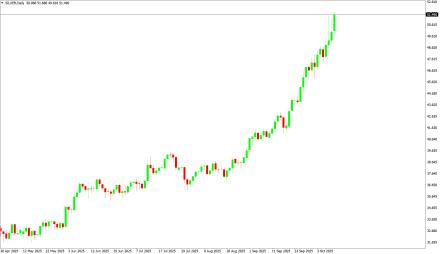
Silver on Monday its intraday high of US$52.39/oz and low of US$49.81/oz settle up by 4.202% at US$52.16/oz
Technicals in Focus:
On daily charts, silver is sustaining above 20MA (25.05), breakage above will lead to 23.73. MACD is below the zero line and histograms are increasing trend, bringing a bullish stance in the upcoming sessions. RSI is in the oversold region, indicating a sell signal for now. The Stochastic Oscillator is in the overbought region and gives a positive crossover to show an upside move for the intraday trade.
Trading Strategy: Buy on Dips
Buy in between 52.90-40.00, targeting 53.50-54.00-54.40 and 55.00-55.60 with stop loss should be placed on the breakage below 40.00.
Sell in between 53.50-55.60 with a stop loss above 55.50 targeting 52.90-52.00-51.70 and 51.00-50.10-49.80-49.30.
|
|
| Intraday Support Levels |
| S1 |
|
|
52.90-52.00-51.70 |
| S2 |
|
|
51.00-50.60-50.10 |
| S3 |
|
|
49.80-49.30-48.75 |
| Intraday Resistance Levels |
| R1 |
|
|
53.50-54.00 |
| R2 |
|
|
54.40-55.00 |
| R3 |
|
|
55.60 |
| TECHNICAL INDICATORS |
| Name |
|
Value |
Action |
| 14DRSI |
|
51.404 |
Buy |
| 20-DMA |
|
32.48 |
Sell |
| 50-DMA |
|
32.45 |
Sell |
| 100-DMA |
|
31.41 |
Sell |
| 200-DMA |
|
30.87 |
Sell |
| STOCH(5,3) |
|
23.195 |
Buy |
| MACD(12,26,9) |
|
0.5705 |
Buy |
|
|
|
|
Oil - WTI
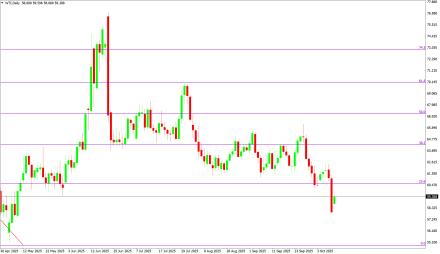
Crude Oil on Monday high of US$59.72/bbl, an intraday low of US$58.68/bbl, and settled up by 0.768% to close at US$59.14/bbl.
Technicals in Focus:
On daily charts, oil is sustaining above its 100DMA i.e. 75.37, a support level, and breakage above will call for 77.48. MACD is above the zero line and histograms are in increasing mode will bring a bullish stance in the upcoming sessions. The Stochastic Oscillator is in the overbought region, giving a negative crossover to confirm a bearish stance; while the RSI is in the neutral region, more upside can be expected to reach the overbought region, which is highly probable.
Trading Strategy: Neutral to Sell
Sell in between 59.40-70.00 with stop loss at 70.00; targeting 58.70-58.00-57.40 and 56.90-56.00-55.10.
Buy above 59.00-55.00 with risk daily closing below 55.00, targeting 59.40-60.60-60.05 and 61.50-62.05-62.70-63.50-64.10.
|
|
| Intraday Support Levels |
| S1 |
|
|
59.00-58.70-58.00 |
| S2 |
|
|
57.40-56.90-56.10 |
| S3 |
|
|
55.50-55.07 |
| Intraday Resistance Levels |
| R1 |
|
|
59.40-60.60-60.05 |
| R2 |
|
|
61.50-62.05-62.70 |
| R3 |
|
|
63.50-64.10-64.70 |
| TECHNICAL INDICATORS |
| Name |
|
Value |
Action |
| 14DRSI |
|
29.346 |
Sell |
| 20-DMA |
|
67.35 |
Sell |
| 50-DMA |
|
69.06 |
Sell |
| 100-DMA |
|
70.28 |
Sell |
| 200-DMA |
|
71.85 |
Sell |
| STOCH(5,3) |
|
16.166 |
Sell |
| MACD(12,26,9) |
|
-1.306 |
Buy |
|
|
|
|
EUR/USD
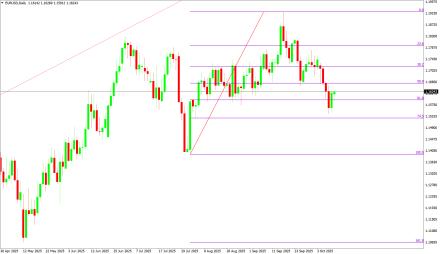
EUR/USD on Monday an intraday low of US$1.1629/EUR, a high of US$1.1629/EUR, and settled the day up by 0.486% to close at US$1.1568/EUR.
Technicals in Focus:
On daily charts, prices are sustaining above 100DMA (1.0800), which becomes immediate support, a break below will target 1.0717. MACD is above the zero line and histograms are increasing mode, bringing a bullish view. Stochastic is in oversold territory, giving negative crossovers to the bullish outlook for intraday. 14D RSI is currently in a neutral region and giving no directions to consider right now.
Trading Strategy: Neutral to Sell
Sell below 1.1690-1.1990, targeting 1.1640-1.1590 and 1.1545-1.1500-1.1470 with stop-loss at daily closing above 1.1990.
Buy above 1.1600-1.1110 with risk below 1.1100 targeting 1.1790-1.1850-1.1890-1.1920 and 1.1950-1.1990-1.2040.
|
|
| Intraday Support Levels |
| S1 |
|
|
1.1600-1.1570 |
| S2 |
|
|
1.1545-1.1524 |
| S3 |
|
|
1.1495-1.1445 |
| Intraday Resistance Levels |
| R1 |
|
|
1.1640 1.1690-1.1755 |
| R2 |
|
|
1.1790-1.1850 |
| R3 |
|
|
1.1890-1.1920 |
| TECHNICAL INDICATORS |
| Name |
|
Value |
Action |
| 14DRSI |
|
37.566 |
Buy |
| 20-DMA |
|
1.0838 |
Sell |
| 50-DMA |
|
1.0978 |
Buy |
| 100-DMA |
|
1.0940 |
Buy |
| 200-DMA |
|
1.0868 |
Buy |
| STOCH(5,3) |
|
34.688 |
Sell |
| MACD(12,26,9) |
|
-0.0013 |
Buy |
|
|
|
|
GBP/USD
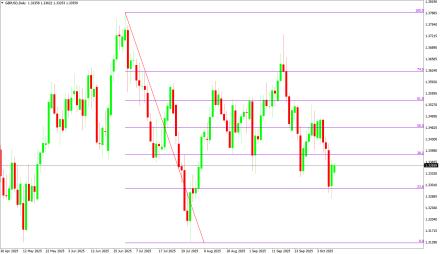
GBP/USD on Monday low of US$1.3314/GBP, a high of US$1.3365/GBP, and settled the day down by 3.224% to close at US$1.3331/GBP.
Technicals in Focus:
On daily charts, prices are sustaining above 50DMA (1.2674) is becoming a support level. 14-D RSI is currently in a neutral region and direction is difficult to predict on an RSI basis. The Stochastic Oscillator is in oversold territory and gives a positive crossover to confirm a bullish stance. MACD is above the zero line, but histograms are increasing leading to movement.
Trading Strategy: Neutral to Buy
Based on the charts and explanations above; buy in between 1.3300-1.3040 with a target of 1.3410-1.3470-1.3550 and 1.3600-1.3625-1.3680-1.3720 with a stop loss closing below 1.3040.
Sell in between 1.3370-1.3850 with targets at 1.3370-1.3310 and 1.3260-1.3200-1.3160 with a stop loss of 1.3850.
|
|
| Intraday Support Levels |
| S1 |
|
|
1.3300-1.3260 |
| S2 |
|
|
1.3200-1.3150 |
| S3 |
|
|
1.3100 |
| Intraday Resistance Levels |
| R1 |
|
|
1.3370-1.3410-1.3490 1.3550-1.3625 |
| R2 |
|
|
1.3650-1.3680 |
| R3 |
|
|
1.3720-1.3800 |
| TECHNICAL INDICATORS |
| Name |
|
Value |
Action |
| 14DRSI |
|
46.905 |
Buy |
| 20-DMA |
|
1.2932 |
Buy |
| 50-DMA |
|
1.2736 |
Buy |
| 100-DMA |
|
1.2629 |
Buy |
| 200-DMA |
|
1.2811 |
Buy |
| STOCH(5,3) |
|
9.458 |
Buy |
| MACD(12,26,9) |
|
-0.003 |
Sell |
|
|
|
|
USD/JPY
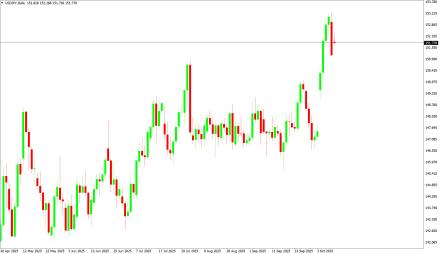
USD/JPY on Monday an intra‐day low of JPY151.71/USD an intraday high of 152.44/USD, and settled the day up by 0.2733% at JPY152.24/USD.
Technicals in Focus:
In daily charts, JPY is sustaining above 100DMA (152.35), major support on the daily chart. 14-D RSI is currently in the overbought region and chances of downward are expected based on RSI. MACD is above the zero line but histograms are decreasing mode which might lead to downward movement. The Stochastic Oscillator is in overbought territory and signaling to sell as it has given a negative crossover to confirm a bearish stance.
Trading Strategy: Neutral to Sell
Sell below 152.10-155.50 with risk above 156.00 targeting 151.60-151.20 and 150.50-149.90-149.00.
Long positions above 151.60-148.00 with targets of 152.00-152.65-153.10-153.60 and 154.00-154.60-155.50 with stops below 148.00.
|
|
| Intraday Support Levels |
| S1 |
|
|
151.60 |
| S2 |
|
|
151.20 150.50-149.90 |
| S3 |
|
|
149.00-148.50 |
| INTRADAY RESISTANCE LEVELS |
| R1 |
|
|
152.00-152.65-153.10 |
| R2 |
|
|
153.60-154.00 |
| R3 |
|
|
154.60-155.50 |
| TECHNICAL INDICATORS |
| Name |
|
Value |
Action |
| 14DRSI |
|
41.14 |
Buy |
| 20-DMA |
|
148.91 |
Buy |
| 50-DMA |
|
150.24 |
Buy |
| 100-DMA |
|
152.53 |
Buy |
| 200-DMA |
|
151.18 |
Buy |
| STOCH(9,6) |
|
93.662 |
Sell |
| MACD(12,26,9) |
|
0.683 |
Sell |
|
|
|
 |