 |
|
|
Daily Market Lookup
- The U.S. dollar hovered around its strongest level in a year on Friday, buoyed by a hawkish Federal Reserve interest rate outlook, while investors were on intervention watch as the Japanese yen sunk to a four-decade low against the greenback. However, an interim Middle East peace deal signed this week removes some of the "bullish argument" for the greenback, they said. The dollar has been boosted throughout the more than three-month long war, thanks partly to the belief that the American economy, as a major energy exporter, may be insulated from an oil price shock caused by the closure of the Strait of Hormuz. Still, some uncertainty has swirled around the durability of the agreement. Talks between the U.S. and Iran initially slated to take place today have been cancelled, Switzerland said, after U.S. Vice President JD Vance scrapped plans to travel to Geneva In a statement, the Swiss foreign ministry said that discussions set to take place at the Burgenstock mountaintop resort have been delayed. The ministry added that it remains ready to facilitate the negotiations, which are anticipated to revolve around a dispute over Iran’s nuclear program. Meanwhile, the British pound rose against the dollar by 0.3% to $1.3238, after Greater Manchester Mayor Andy Burnham’s victory in the Makerfield by-election set him up as a key challenger to embattled U.K. Prime Minister Keir Starmer’s leadership of the Labour Party. Other currencies, including the euro and Australian dollar, were little changed, as traders continued to assess whether supply flows through the Strait of Hormuz -- a vital waterway for a fifth of the world’s oil and liquefied natural gas -- were rebounding following the U.S.-Iran peace deal.
- The Japanese yen remained under pressure, with the currency last trading roughly steady against the dollar at 161.26 yen, compared to multi-decade lows of 161.82 in the previous session Investors continued to be on the lookout for signs of official intervention from Japanese authorities, especially with liquidity muted due to a market holiday in the United States. The Ministry of Finance intervened to prop up the currency when the yen was exchanging hands at the 160 level earlier this year, according to media reports. The yen has found little relief this week, despite the Bank of Japan raising interest rates to a 31-year this week. Comments from BOJ Deputy Governor Ryozo Himino warned of the risks of rolling out more rate hikes due to Iran-linked inflationary pressures. Meanwhile, government data released on Friday showed Japan’s core consumer price index rose 1.4% year-on-year in May, matching market expectations and remaining below the BOJ’s 2% target for a fourth straight month. The reading highlighted the dampening effect of fuel subsidies on inflation.
- Brent crude prices slid on Monday after U.S.-Iran talks concluded in Switzerland with Tehran saying it had secured waivers for oil and petrochemical exports, easing worries about a supply shortage in global markets. Prices had climbed to $82.30 at the start of trading, fuelled by a bumpy start to the talks with threats from U.S. President Donald Trump to restart the war on Iran and Tehran’s announcement it had again closed the Strait of Hormuz. U.S. West Texas Intermediate crude futures were at $76.73 a barrel, up 13 cents, ahead of the contract’s expiry later on Monday. The more active August contract fell 21 cents to $75.64 a barrel. There was no settlement in the U.S. market on Friday due to a holiday. High-ranking U.S. and Iranian officials wrapped up their first round of talks in Switzerland on Monday, mediators said. The talks began on Sunday under the terms of a memorandum of understanding reached last week to extend a tenuous ceasefire from April for at least another 60 days. Iranian Foreign Minister Abbas Araqchi said his country had secured waivers for oil and petrochemical exports, the release of some frozen assets and the launch of a reconstruction and development plan for Iran. Before the talks, the number of ships that passed the Strait of Hormuz fell sharply on Sunday, shipping data showed, after Iran announced it had again closed the waterway, citing Israeli and U.S. violations of the interim peace deal. Israeli strikes in Lebanon killed at least 20 people on Saturday, Lebanon’s state news agency NNA said, one day after a ceasefire with Hezbollah took effect, aimed at halting months of escalating violence. "Recent developments show that moving towards a more permanent deal will be challenging, with very real risks of a flare-up in hostilities during the 60-day ceasefire," ING analysts said in a note ahead of the announcement of the conclusion of the talks in Switzerland. Still, oil prices fell more than 8% last week on hopes of more supply from the release of cargoes stranded in the Gulf and the potential lifting of U.S. sanctions on Iranian oil as part of the U.S.-Iran deal. Over 25 million barrels of Iranian oil have passed through the virtual blockade line since Monday, the head of the National Iranian Oil Company, Hamid Bovard, told state TV on Sunday. The United Arab Emirates, Kuwait and Iraq have offered more oil to customers in the past week.Iraq plans to restore crude production gradually to between 4.2 million and 4.3 million barrels per day, Iraq’s deputy oil minister for upstream affairs said in a statement on Sunda
|
|
| Intraday RESISTANCE LEVELS |
| 22nd June 2026 |
R1 |
R2 |
R3 |
| GOLD-XAU |
4200-4254-4300 |
4335-4360-4390 |
4400-4415-4430 |
| Silver-XAG |
75.00-75.45-76.00 |
76.70-77.60-78.50 |
79.00-80.00-80.45 |
| Crude Oil |
74.90-75.90- 76.50-77.10 |
78.00-78.85-80.00 |
80.90-81.70-82.40 |
| EURO/USD |
-1.1520-1.1570-1.1630 |
1.1690-1.1750-1.1790 |
1.1810-1.1840-1.1890 |
| GBP/USD |
1.3270-1.3300-1.3350 |
1.3390-1.3440-1.3490 |
1.3540-1.3600 1.3640 |
| USD/JPY |
161.70-161.90 |
162.50-162.90 |
|
| Intraday SUPPORTS LEVELS |
| 22nd June 2026 |
S1 |
S2 |
S3 |
| GOLD-XAU |
4170-4155-4144 |
4130-4100-4085 |
4064-4044-4000 |
| Silver-XAG |
74.70-73.90-73.50 |
72.90-72.45-72.00 |
71.50-70.95-69.50 |
| Crude Oil |
74.10-73.50-72.54 |
72.00-71.10-70.50 |
69.80-69.10 |
| EURO/USD |
1.1485-1.1465-1.1440 |
1.1426-1.1417-1.1405 |
1.1385-1.1370 |
| GBP/USD |
1.3200-1.3180-1.3160 |
1.3150-1.3135-1.3120 |
1.3100-1.3079 |
| USD/JPY |
160.70-161.00-161.40-160.00 |
159.40-158.70-158.00 |
157.10156.60 |
|
|
| Intra-Day Strategy (22nd June 2026) |
| GOLD-XAU |
Sell on Strength |
| Silver-XAG |
Buy on Dips |
|
| Crude Oil |
Neutral to Sell |
| EUR/USD |
Neutral to Sell |
|
| GBP/USD |
Neutral to Buy |
| USD/JPY |
Neutral to Sell |
|
|
|
|
Gold – XAU
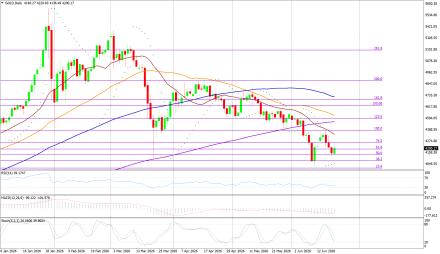
Gold on Friday interaday high of US$4212.60/oz and low of $4121.59/oz. God is down by 1.341% at US$4151.46/oz.
Technicals in Focus:
On the daily charts, gold trades higher than 20DMA (2197). If it drops below this level, it could lead to 2,100. The MACD is currently above the zero line and the histograms are showing an increasing trend, indicating that there may be upward movement in the coming sessions. The RSI is currently at 83.04, which is in the overbought region, suggesting there may be selling pressure in the next 2 to 3 sessions. The Stochastic Oscillator is also in the overbought territory but has given a positive crossover, indicating a bullish stance for intraday trades, but rebound in expected in all the overbought indicators.
Trading Strategy: Sell on Strength
Sell below 4200-4460 keeping stop loss closing above 4500, targeting 4170-4155-4144-4130 and 4100-4085-4064-4044-4000. Buy in between 4170-4000 with risk below 4000 targeting 4200-4254-4300-4335 and 4360-4390-4400-4415-4430. |
|
| Intraday Support Levels |
| S1 |
|
|
4170-4155-4144 |
| S2 |
|
|
4130-4100-4085 |
| S3 |
|
|
4064-4044-4000 |
| Intraday Resistance Levels |
| R1 |
|
|
4200-4254-4300 |
| R2 |
|
|
4335-4360-4390 |
| R3 |
|
|
4400-4415-4430 |
| Technical Indicators
|
| Name |
|
Value |
Action |
| 14DRSI |
|
52.916 |
Buy |
| 20-DMA |
|
4800.67 |
Buy |
| 50-DMA |
|
4497.76 |
Buy |
| 100-DMA |
|
4239.36 |
Buy |
| 200-DMA |
|
3800.35 |
Buy |
| STOCH(5,3) |
|
26.933 |
Sell |
| MACD(12,26,9) |
|
150.924 |
Buy |
|
|
|
|
Silver - XAG
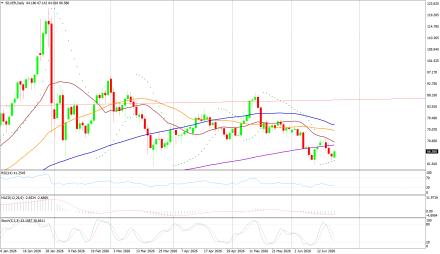
Silver on Friday its intraday high of US76.65/oz and low of US$74.88/oz settle up by 1.799% at US$76.49/oz.
Technicals in Focus:
On daily charts, silver is sustaining above 20MA (25.05), breakage above will lead to 23.73. MACD is below the zero line and histograms are increasing trend, bringing a bullish stance in the upcoming sessions. RSI is in the oversold region, indicating a sell signal for now. The Stochastic Oscillator is in the overbought region and gives a positive crossover to show an upside move for the intraday trade.
Trading Strategy: Buy on Dips
Buy in between 74.70-69.70 targeting 75.00-75.45-76.00-76.70 and 77.60-78.50-79.00-80.00 with stop loss should be placed on the breakage below 69.00.
Sell in between 75.00-80.45 with a stop loss above 81.00 targeting 74.70-73.90—73.50-72.9069.70-68.90-68.00-67.70 and 67.00-66.15-65.50-64.90.
|
|
| Intraday Support Levels |
| S1 |
|
|
74.70-73.90-73.50 |
| S2 |
|
|
72.90-72.45-72.00 |
| S3 |
|
|
71.50-70.95-69.50 |
| Intraday Resistance Levels |
| R1 |
|
|
75.00-75.45-76.00 |
| R2 |
|
|
76.70-77.60-78.50 |
| R3 |
|
|
79.00-80.00-80.45 |
| TECHNICAL INDICATORS |
| Name |
|
Value |
Action |
| 14DRSI |
|
46.1562 |
Buy |
| 20-DMA |
|
92.99 |
Sell |
| 50-DMA |
|
75.81 |
Sell |
| 100-DMA |
|
62.03 |
Sell |
| 200-DMA |
|
49.29 |
Sell |
| STOCH(5,3) |
|
21.094 |
Buy |
| MACD(12,26,9) |
|
5.262 |
Buy |
|
|
|
|
Oil - WTI
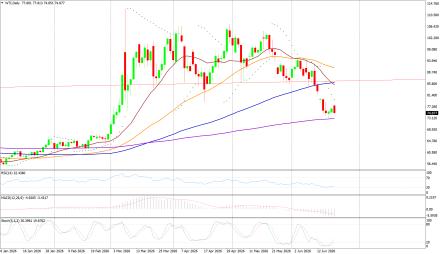
Crude Oil on Friday high of US$76.65/bbl, an intraday low of US$74.88/bbl, and settled up by 1.799% to close at US$74.88/bbl.
Technicals in Focus:
On daily charts, oil is sustaining above its 100DMA i.e. 75.37, a support level, and breakage above will call for 77.48. MACD is above the zero line and histograms are in increasing mode will bring a bullish stance in the upcoming sessions. The Stochastic Oscillator is in the overbought region, giving a negative crossover to confirm a bearish stance; while the RSI is in the neutral region, more upsides can be expected to reach the overbought region, which is highly probable.
Trading Strategy: Neutral to Sell
Sell in between 75.00-82.90 with stop loss at 83.00 targeting 74.10-73.50-72.54-72.00 and 71.10-70.50-69.80-69.00.
Buy above 74.10-69.00 with risk daily closing below 69.00, targeting 74.90-75.90-76.50-77.10 and 78.00-78.85-80.00-80.90-81.70.
|
|
| Intraday Support Levels |
| S1 |
|
|
74.10-73.50-72.54 |
| S2 |
|
|
72.00-71.10-70.50 |
| S3 |
|
|
69.80-69.10 |
| Intraday Resistance Levels |
| R1 |
|
|
74.90-75.90- 76.50-77.10 |
| R2 |
|
|
78.00-78.85-80.00 |
| R3 |
|
|
80.90-81.70-82.40 |
| TECHNICAL INDICATORS |
| Name |
|
Value |
Action |
| 14DRSI |
|
29.346 |
Sell |
| 20-DMA |
|
67.35 |
Sell |
| 50-DMA |
|
69.06 |
Sell |
| 100-DMA |
|
70.28 |
Sell |
| 200-DMA |
|
71.85 |
Sell |
| STOCH(5,3) |
|
16.166 |
Sell |
| MACD(12,26,9) |
|
-1.306 |
Buy |
|
|
|
|
EUR/USD
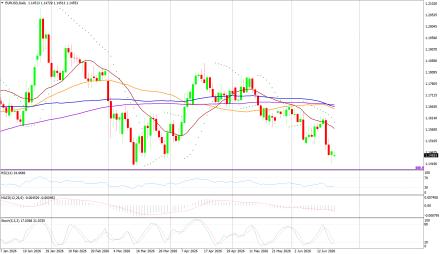
EUR/USD on Friday made an intraday low of US$1.1417/EUR, a high of US$1.1480/EUR, and settled up by 0.1344% to close at US$1.1471/EUR
Technicals in Focus:
On daily charts, prices are sustaining above 100DMA (1.1661), which becomes immediate support, a break below will target 1.1695. MACD is above the zero line and histograms are increasing mode, bringing a bullish view. Stochastic is in oversold territory, giving negative crossovers to the bullish outlook for intraday. 14D RSI is currently in a neutral region and giving no directions to consider right now.
Trading Strategy: Neutral to Sell
Sell below 1.1570-1.1990, targeting 1.1520-1.1485-1.1450-1.1410 with stop-loss at daily closing above 1.1990.
Buy above 1.1520-1.1450 with risk below 1.1450 targeting 1.1590-1.1630-1.1690-1.1750 and 1.1790-1.1840-1.1920-1.1960.
|
|
| Intraday Support Levels |
| S1 |
|
|
1.1485-1.1465-1.1440 |
| S2 |
|
|
1.1426-1.1417-1.1405 |
| S3 |
|
|
1.1385-1.1370 |
| Intraday Resistance Levels |
| R1 |
|
|
-1.1520-1.1570-1.1630 |
| R2 |
|
|
1.1690-1.1750-1.1790 |
| R3 |
|
|
1.1810-1.1840-1.1890 |
| TECHNICAL INDICATORS |
| Name |
|
Value |
Action |
| 14DRSI |
|
48.897 |
Buy |
| 20-DMA |
|
1.1695 |
Sell |
| 50-DMA |
|
1.1656 |
Buy |
| 100-DMA |
|
1.1661 |
Buy |
| 200-DMA |
|
1.1585 |
Buy |
| STOCH(5,3) |
|
55.688 |
Buy |
| MACD(12,26,9) |
|
-0.0013 |
|
|
|
|
|
GBP/USD
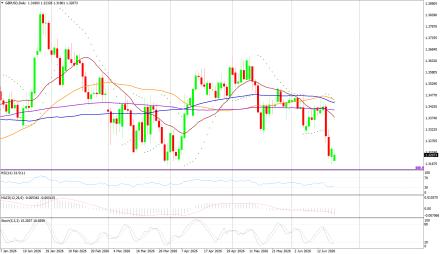
GBP/USD on Friday made a intraday low of US$1.3162/GBP, a high of US$1.3240/GBP, and settled the day up by 0.281% to close at US$1.3235/GBP.
Technicals in Focus:
On daily charts, prices are sustaining above 50DMA (1.2674) is becoming a support level. 14-D RSI is currently in a neutral region and direction is difficult to predict on an RSI basis. The Stochastic Oscillator is in oversold territory and gives a positive crossover to confirm a bullish stance. MACD is above the zero line, but histograms are increasing leading to movement.
Trading Strategy: Neutral to Buy
Based on the charts and explanations above; buy between 1.3200-1.3079 with a target of 1.3270-1.3350-1.3390-1.3436 and 1.3500-1.3570-1.3600-1.3640-1.3690 with a stop loss closing below 1.3150.
Sell in between 1.3270-1.3820 with targets at 1.3210-1.3190-1.3150-1.3135 and 1.3120-1.3100-1.3079 with a stop loss of 1.3900.
|
|
| Intraday Support Levels |
| S1 |
|
|
1.3200-1.3180-1.3160 |
| S2 |
|
|
1.3150-1.3135-1.3120 |
| S3 |
|
|
1.3100-1.3079 |
| Intraday Resistance Levels |
| R1 |
|
|
1.3270-1.3300-1.3350 |
| R2 |
|
|
1.3390-1.3440-1.3490 |
| R3 |
|
|
1.3540-1.3600 1.3640 |
| TECHNICAL INDICATORS |
| Name |
|
Value |
Action |
| 14DRSI |
|
46.905 |
Buy |
| 20-DMA |
|
1.2932 |
Buy |
| 50-DMA |
|
1.2736 |
Buy |
| 100-DMA |
|
1.2629 |
Buy |
| 200-DMA |
|
1.2811 |
Buy |
| STOCH(5,3) |
|
9.458 |
Buy |
| MACD(12,26,9) |
|
-0.003 |
Sell |
|
|
|
|
USD/JPY
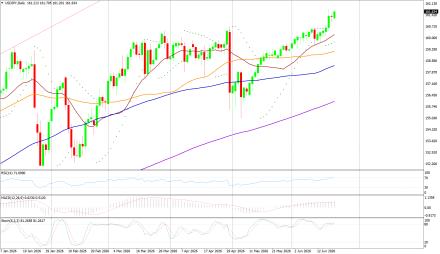
USD/JPY on Wednesday made an intra‐day low of JPY160.11/USD an intraday high of 160.79/USD, and settled the day up by 0.158% at JPY160.62/USD.
Technicals in Focus:
In daily charts, JPY is sustaining above 100DMA (152.35), major support on the daily chart. 14-D RSI is currently in the overbought region and chances of downward are expected based on RSI. MACD is above the zero line but histograms are decreasing mode which might lead to downward movement. The Stochastic Oscillator is in overbought territory and signaling to sell as it has given a negative crossover to confirm a bearish stance.
Trading Strategy: Neutral to Sell
Sell below 160.70-163.10 with risk above 163.10 targeting 158.70-158.10-157.00 and 156.60-153.00-152.65-152.10.
Long positions above 160.00-152.00 with targets of 159.40-160.00 and 160.90-161.60-162.20-162.60 with stops below 148.00.
|
|
| Intraday Support Levels |
| S1 |
|
|
160.70-161.00-161.40-160.00 |
| S2 |
|
|
159.40-158.70-158.00 |
| S3 |
|
|
157.10156.60 |
| INTRADAY RESISTANCE LEVELS |
| R1 |
|
|
161.70-161.90 |
| R2 |
|
|
162.50-162.90 |
| R3 |
|
|
|
| TECHNICAL INDICATORS |
| Name |
|
Value |
Action |
| 14DRSI |
|
41.14 |
Buy |
| 20-DMA |
|
148.91 |
Buy |
| 50-DMA |
|
150.24 |
Buy |
| 100-DMA |
|
152.53 |
Buy |
| 200-DMA |
|
151.18 |
Buy |
| STOCH(9,6) |
|
93.662 |
Sell |
| MACD(12,26,9) |
|
0.683 |
Sell |
|
|
|
 |