 |
|
|
Daily Market Lookup
- The U.S. dollar on Monday surged to an over one-year high, as rising expectations for a hawkish Federal Reserve outweighed positive developments in the Middle East and falling oil prices. Meanwhile, the sterling was in focus amid the big story of the day in British Prime Minister Keir Starmer’s resignation. Currency market participants last week were surprised after the Fed revealed a much more hawkish Summary of Economic Projections (SEP) than expected. The updated SEP, or dot plot, showed at least half the Federal Open Market Committee’s participants now anticipating interest rate hikes this year in order to combat the inflationary shock caused by surging oil prices due to the Iran war. Even with oil prices tumbling in recent weeks, the dot plot’s overall outlook on monetary policy has now changed to an expectation of at least one quarter-point rate hike in 2026 compared to at least two quarter-point rate cuts previously. Bank of America on Monday said it no longer expects any Fed rate cuts until 2028. Higher rate environments generally tend to strengthen the dollar. The Fed also gave markets a lot to digest after new chair Kevin Warsh laid out a sweeping vision of change for the central bank and announced the creation of five task forces to look into operations central to monetary policy. The rise in rate hike bets has weighed on government debt, with traders on Monday dumping bond and driving U.S. Treasury yields higher. The rate-sensitive U.S. 2-year yield was last up 5 basis points to 4.232%, while the longer-end, benchmark 10-year yield was up 6 basis points to 4.512%. Turning to the Middle East, oil prices extended a multi-week slide on Monday after the U.S. touted progress in peace talks with Iran and asserted that the critical Strait of Hormuz was open. President Donald Trump last week inked a memorandum of understanding (MoU) with Iran on a visit to France for the G7 summit. As per the MoU, military operations on all fronts immediately ceased, including in Lebanon, and a 60-day period for further negotiations began to arrive at a final peace deal. The critical Strait of Hormuz reopened with no charges or tolls for the 60-day period, while Iran reaffirmed that it would not procure or develop nuclear weapons and that its enriched material would be disposed through a mutually agreed upon mechanism during further negotiations. But the prospects of the interim understanding turning into a lasting deal took a big hit over the weekend after fresh fighting erupted between Israel and Iran-backed Hezbollah in Lebanon. Media reports said both Israel and Iran accused each other of ceasefire violations, leading Tehran to announce that it had again closed the strait. The mood was further worsened after Trump on Sunday morning said "Iran must immediately stop their highly paid PROXIES in Lebanon from causing trouble. If they don’t, we’ll hit Iran very hard again, just like we did last week, only harder!!!" Tensions de-escalated after U.S. and Iranian representatives met for peace talks in Switzerland at Lake Lucerne, with mediators from Qatar and Pakistan also present. U.S. Vice President JD Vance after the summit said four accomplishments had been negotiated, chief being a "mechanism" to keep the Strait of Hormuz open. Elsewhere, the big headline of the day was Labour leader Starmer’s announcement that he would resign. The move opens the possibility for rival Andy Burnham to become the country’s seventh prime minister in the 10 years since the Brexit vote.
Starmer’s exit strips away the hard-fought political stability that had recently underpinned the sterling, leaving the currency exposed to a summer of political horse-trading. While markets are currently giving Andy Burnham the benefit of the doubt, sterling’s resilience is an illusion that relies entirely on fiscal continuity.
- Gold prices fell more than 1% in Asian trade on Tuesday as a firmer U.S. dollar and rising expectations of Federal Reserve interest-rate hikes this year dented demand for the non-yielding metal, while investors also weighed progress in U.S.-Iran peace negotiations. The greenback has drawn support from a hawkish shift at last week's Federal Reserve meeting, the first chaired by Kevin Warsh. While policymakers left interest rates unchanged at 3.50%-3.75%, updated projections showed growing support for at least one rate increase before year-end. Futures markets are now pricing about a 90% probability of a rate hike in December, with some investors even anticipating more than one increase as policymakers remain focused on inflation risks. A stronger dollar makes gold more expensive for holders of other currencies, while higher interest rates reduce the appeal of bullion because it pays no interest. Investor attention also remained on diplomatic efforts between Washington and Tehran. The U.S. has granted a 60-day sanctions waiver on some Iranian oil sales following initial talks in Switzerland, while U.S. officials described the discussions as constructive. While gold is traditionally viewed as a safe-haven asset during periods of geopolitical turmoil, investors have increasingly focused on the inflationary consequences of the Iran conflict. The war drove oil prices sharply higher, raising concerns that energy-driven inflation could force central banks to maintain restrictive monetary policy for longer. Investors also await U.S. Personal Consumption Expenditures (PCE) inflation data due on Thursday, the Fed's preferred price gauge.
|
|
| Intraday RESISTANCE LEVELS |
| 23rd June 2026 |
R1 |
R2 |
R3 |
| GOLD-XAU |
4144-4155-4170 |
4200-4254-4300 |
4335-4360-4390 |
| Silver-XAG |
63.60-64.10-65.00 |
65.60-66.50-67.20 |
68.00-69.10-69.40 |
| Crude Oil |
74.10-74.90-75.90- 76.50 |
77.10-78.00-78.85 |
80.00-80.90-81.70 |
| EURO/USD |
-1.1520-1.1570-1.1630 |
1.1690-1.1750-1.1790 |
1.1810-1.1840-1.1890 |
| GBP/USD |
1.3270-1.3300-1.3350 |
1.3390-1.3440-1.3490 |
1.3540-1.3600 1.3640 |
| USD/JPY |
161.70-161.90 |
162.50-162.90 |
163.50-164.00 |
| Intraday SUPPORTS LEVELS |
| 23rd June 2026 |
S1 |
S2 |
S3 |
| GOLD-XAU |
4130-4100-4085 |
4066-4044-4023 |
4005-3990 |
| Silver-XAG |
63.00-62.10 |
61.48-61.00 |
60.40-59.90-59.00 |
| Crude Oil |
73.50-72.54 |
72.00-71.10-70.50 |
69.80-69.10 |
| EURO/USD |
1.1485-1.1465-1.1440 |
1.1426-1.1417-1.1405 |
1.1385-1.1370 |
| GBP/USD |
1.3200-1.3180-1.3160 |
1.3150-1.3135-1.3120 |
1.3100-1.3079 |
| USD/JPY |
160.70-161.00-161.40-160.00 |
159.40-158.70-158.00 |
157.10-156.60 |
|
|
| Intra-Day Strategy (23rd June 2026) |
| GOLD-XAU |
Sell on Strength |
| Silver-XAG |
Buy on Dips |
|
| Crude Oil |
Neutral to Sell |
| EUR/USD |
Neutral to Sell |
|
| GBP/USD |
Neutral to Buy |
| USD/JPY |
Neutral to Sell |
|
|
|
|
Gold – XAU
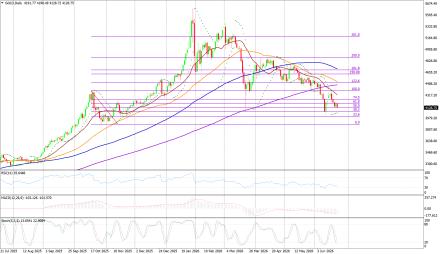
Gold on Monday interaday high of US$4220.83/oz and low of $4136.49/oz. God is up by 1.088% at US$4191.39/oz.
Technicals in Focus:
On the daily charts, gold trades higher than 20DMA (2197). If it drops below this level, it could lead to 2,100. The MACD is currently above the zero line and the histograms are showing an increasing trend, indicating that there may be upward movement in the coming sessions. The RSI is currently at 83.04, which is in the overbought region, suggesting there may be selling pressure in the next 2 to 3 sessions. The Stochastic Oscillator is also in the overbought territory but has given a positive crossover, indicating a bullish stance for intraday trades, but rebound in expected in all the overbought indicators.
Trading Strategy: Sell on Strength
Sell below 4200-4460 keeping stop loss closing above 4500, targeting 4170-4155-4144-4130 and 4100-4085-4064-4044-4000.
Buy in between 4130-4000 with risk below 4000 targeting 4144-4155-4170-4200-4254 and 4300-4335-4360-4390-4400.
|
|
| Intraday Support Levels |
| S1 |
|
|
4130-4100-4085 |
| S2 |
|
|
4066-4044-4023 |
| S3 |
|
|
4005-3990 |
| Intraday Resistance Levels |
| R1 |
|
|
4144-4155-4170 |
| R2 |
|
|
4200-4254-4300 |
| R3 |
|
|
4335-4360-4390 |
| Technical Indicators
|
| Name |
|
Value |
Action |
| 14DRSI |
|
52.916 |
Buy |
| 20-DMA |
|
4800.67 |
Buy |
| 50-DMA |
|
4497.76 |
Buy |
| 100-DMA |
|
4239.36 |
Buy |
| 200-DMA |
|
3800.35 |
Buy |
| STOCH(5,3) |
|
26.933 |
Sell |
| MACD(12,26,9) |
|
150.924 |
Buy |
|
|
|
|
Silver - XAG
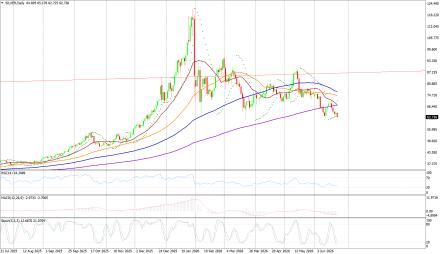
Silver on Monday its intraday high of US$67.14/oz and low of US$64.01/oz settle up by 1.397% at US$65.07/oz.
Technicals in Focus:
On daily charts, silver is sustaining above 20MA (25.05), breakage above will lead to 23.73. MACD is below the zero line and histograms are increasing trend, bringing a bullish stance in the upcoming sessions. RSI is in the oversold region, indicating a sell signal for now. The Stochastic Oscillator is in the overbought region and gives a positive crossover to show an upside move for the intraday trade.
Trading Strategy: Buy on Dips
Buy in between 63.00-59.00 targeting 63.60-64.10-65.00-65.60 and 66.50-67.20-68.00-69.10-69.60 with stop loss should be placed on the breakage below 69.00.
Sell in between 63.60-69.45 with a stop loss above 70.00 targeting 63.00-62.10-61.48-61.00 and 60.40-59.90-59.00.
|
|
| Intraday Support Levels |
| S1 |
|
|
63.00-62.10 |
| S2 |
|
|
61.48-61.00 |
| S3 |
|
|
60.40-59.90-59.00 |
| Intraday Resistance Levels |
| R1 |
|
|
63.60-64.10-65.00 |
| R2 |
|
|
65.60-66.50-67.20 |
| R3 |
|
|
68.00-69.10-69.40 |
| TECHNICAL INDICATORS |
| Name |
|
Value |
Action |
| 14DRSI |
|
46.1562 |
Buy |
| 20-DMA |
|
92.99 |
Sell |
| 50-DMA |
|
75.81 |
Sell |
| 100-DMA |
|
62.03 |
Sell |
| 200-DMA |
|
49.29 |
Sell |
| STOCH(5,3) |
|
21.094 |
Buy |
| MACD(12,26,9) |
|
5.262 |
Buy |
|
|
|
|
Oil - WTI
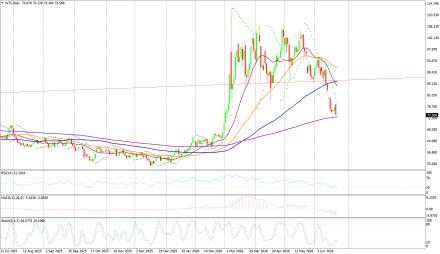
Crude Oil on Monday high of US$77.81/bbl, an intraday low of US$73.11/bbl, and settled up by 4.818% to close at US$73.86/bbl.
Technicals in Focus:
On daily charts, oil is sustaining above its 100DMA i.e. 75.37, a support level, and breakage above will call for 77.48. MACD is above the zero line and histograms are in increasing mode will bring a bullish stance in the upcoming sessions. The Stochastic Oscillator is in the overbought region, giving a negative crossover to confirm a bearish stance; while the RSI is in the neutral region, more upsides can be expected to reach the overbought region, which is highly probable.
Trading Strategy: Neutral to Sell
Sell in between 74.00-82.90 with stop loss at 83.00 targeting 74.10-73.50-72.54-72.00 and 71.10-70.50-69.80-69.00.
Buy above 73.50-69.00 with risk daily closing below 69.00, targeting 74.90-75.90-76.50-77.10 and 78.00-78.85-80.00-80.90-81.70.
|
|
| Intraday Support Levels |
| S1 |
|
|
73.50-72.54 |
| S2 |
|
|
72.00-71.10-70.50 |
| S3 |
|
|
69.80-69.10 |
| Intraday Resistance Levels |
| R1 |
|
|
74.10-74.90-75.90- 76.50 |
| R2 |
|
|
77.10-78.00-78.85 |
| R3 |
|
|
80.00-80.90-81.70 |
| TECHNICAL INDICATORS |
| Name |
|
Value |
Action |
| 14DRSI |
|
29.346 |
Sell |
| 20-DMA |
|
67.35 |
Sell |
| 50-DMA |
|
69.06 |
Sell |
| 100-DMA |
|
70.28 |
Sell |
| 200-DMA |
|
71.85 |
Sell |
| STOCH(5,3) |
|
16.166 |
Sell |
| MACD(12,26,9) |
|
-1.306 |
Buy |
|
|
|
|
EUR/USD
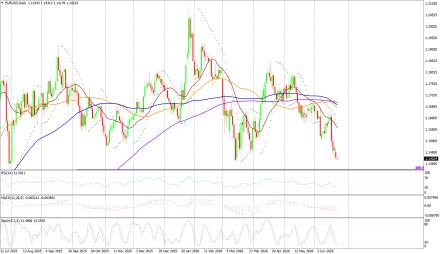
EUR/USD on Monday made an intraday low of US$1.1418/EUR, a high of US$1.1472/EUR, and settled down by 0.208% to close at US$1.1427/EUR.
Technicals in Focus:
On daily charts, prices are sustaining above 100DMA (1.1661), which becomes immediate support, a break below will target 1.1695. MACD is above the zero line and histograms are increasing mode, bringing a bullish view. Stochastic is in oversold territory, giving negative crossovers to the bullish outlook for intraday. 14D RSI is currently in a neutral region and giving no directions to consider right now.
Trading Strategy: Neutral to Sell
Sell below 1.1520-1.1990, targeting 1.1520-1.1485-1.1450-1.1410 with stop-loss at daily closing above 1.1990.
Buy above 1.1485-1.1450 with risk below 1.1450 targeting 1.1590-1.1630-1.1690-1.1750 and 1.1790-1.1840-1.1920-1.1960.
|
|
| Intraday Support Levels |
| S1 |
|
|
1.1485-1.1465-1.1440 |
| S2 |
|
|
1.1426-1.1417-1.1405 |
| S3 |
|
|
1.1385-1.1370 |
| Intraday Resistance Levels |
| R1 |
|
|
-1.1520-1.1570-1.1630 |
| R2 |
|
|
1.1690-1.1750-1.1790 |
| R3 |
|
|
1.1810-1.1840-1.1890 |
| TECHNICAL INDICATORS |
| Name |
|
Value |
Action |
| 14DRSI |
|
48.897 |
Buy |
| 20-DMA |
|
1.1695 |
Sell |
| 50-DMA |
|
1.1656 |
Buy |
| 100-DMA |
|
1.1661 |
Buy |
| 200-DMA |
|
1.1585 |
Buy |
| STOCH(5,3) |
|
55.688 |
Buy |
| MACD(12,26,9) |
|
-0.0013 |
|
|
|
|
|
GBP/USD
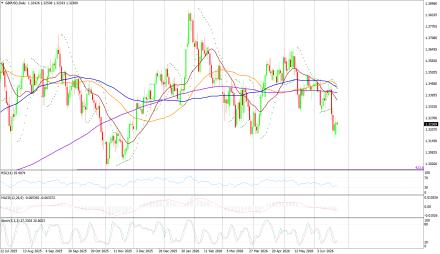
GBP/USD on Monday made a intraday low of US$1.3180/GBP, a high of US$1.3272/GBP, and settled the day up by 0.510% to close at US$1.3180/GBP.
Technicals in Focus:
On daily charts, prices are sustaining above 50DMA (1.2674) is becoming a support level. 14-D RSI is currently in a neutral region and direction is difficult to predict on an RSI basis. The Stochastic Oscillator is in oversold territory and gives a positive crossover to confirm a bullish stance. MACD is above the zero line, but histograms are increasing leading to movement.
Trading Strategy: Neutral to Buy
Based on the charts and explanations above; buy between 1.3200-1.3079 with a target of 1.3270-1.3350-1.3390-1.3436 and 1.3500-1.3570-1.3600-1.3640-1.3690 with a stop loss closing below 1.3150.
Sell in between 1.3270-1.3820 with targets at 1.3210-1.3190-1.3150-1.3135 and 1.3120-1.3100-1.3079 with a stop loss of 1.3900.
|
|
| Intraday Support Levels |
| S1 |
|
|
1.3200-1.3180-1.3160 |
| S2 |
|
|
1.3150-1.3135-1.3120 |
| S3 |
|
|
1.3100-1.3079 |
| Intraday Resistance Levels |
| R1 |
|
|
1.3270-1.3300-1.3350 |
| R2 |
|
|
1.3390-1.3440-1.3490 |
| R3 |
|
|
1.3540-1.3600 1.3640 |
| TECHNICAL INDICATORS |
| Name |
|
Value |
Action |
| 14DRSI |
|
46.905 |
Buy |
| 20-DMA |
|
1.2932 |
Buy |
| 50-DMA |
|
1.2736 |
Buy |
| 100-DMA |
|
1.2629 |
Buy |
| 200-DMA |
|
1.2811 |
Buy |
| STOCH(5,3) |
|
9.458 |
Buy |
| MACD(12,26,9) |
|
-0.003 |
Sell |
|
|
|
|
USD/JPY
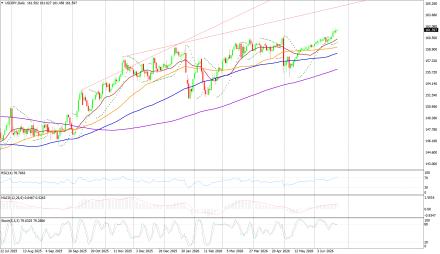
USD/JPY on Monday made an intra‐day low of JPY161.06/USD an intraday high of 160.79/USD, and settled the day up by 0.218% at JPY161.56/USD.
Technicals in Focus:
In daily charts, JPY is sustaining above 100DMA (152.35), major support on the daily chart. 14-D RSI is currently in the overbought region and chances of downward are expected based on RSI. MACD is above the zero line but histograms are decreasing mode which might lead to downward movement. The Stochastic Oscillator is in overbought territory and signaling to sell as it has given a negative crossover to confirm a bearish stance.
Trading Strategy: Neutral to Sell
Sell below 160.70-163.10 with risk above 163.10 targeting 158.70-158.10-157.00 and 156.60-153.00-152.65-152.10.
Long positions above 160.00-152.00 with targets of 159.40-160.00 and 160.90-161.60-162.20-162.60 with stops below 148.00.
|
|
| Intraday Support Levels |
| S1 |
|
|
160.70-161.00-161.40-160.00 |
| S2 |
|
|
159.40-158.70-158.00 |
| S3 |
|
|
157.10-156.60 |
| INTRADAY RESISTANCE LEVELS |
| R1 |
|
|
161.70-161.90 |
| R2 |
|
|
162.50-162.90 |
| R3 |
|
|
163.50-164.00 |
| TECHNICAL INDICATORS |
| Name |
|
Value |
Action |
| 14DRSI |
|
41.14 |
Buy |
| 20-DMA |
|
148.91 |
Buy |
| 50-DMA |
|
150.24 |
Buy |
| 100-DMA |
|
152.53 |
Buy |
| 200-DMA |
|
151.18 |
Buy |
| STOCH(9,6) |
|
93.662 |
Sell |
| MACD(12,26,9) |
|
0.683 |
Sell |
|
|
|
 |