 |
|
|
Daily Market Lookup
- The U.S. dollar on Wednesday firmed and remained at an over one-year high, as sputtering risk sentiment due to under-pressure technology stocks offset a slight easing in rate hike bets. The dollar remained an asset of choice as Wall Street largely failed to rebound from a steep sell-off in technology stocks. Still, sliding oil prices to levels just before and after the start of the Iran war led to traders paring back their expectations for Federal Reserve policy tightening and snapping up government bonds, which in turn put pressure on U.S. Treasury yields. Yields slide but Fed unlikely to change hawkish stance. The Fed last week struck a much more hawkish tone than expected, as its updated set of economic projections showed at least half of the central bank’s policymakers anticipating interest rate hikes this year to combat the inflationary shock caused by surging oil prices due to the Middle East conflict. Currency market participants responded by driving up their own expectations of Fed rate hikes. The U.S. dollar index has gained every day this week as higher rate environments generally tend to strengthen the greenback. U.S. Treasury yields also jumped since the Fed’s hawkish turn, as bonds were dumped. However, inflationary concerns have tumbled recently as oil prices have slid following the reopening of the Strait of Hormuz and improving shipping activity through the vital waterway. Brent crude futures expiring in September, the global oil benchmark, on Wednesday hit their lowest level since February 27, just a day before the U.S. and Israel launched their joint assault on Iran. Investors reacted by trimming their rate hike expectations, according to the CME FedWatch tool. Torres did note that the more modest decline in shorter-end maturities, along with the strengthening greenback, signaled that "new Fed Chair Kevin Warsh is unlikely to be overly impressed by sinking energy costs and likely wants to see broader progress in subduing goods and services inflation before lightening his hawkish stance." Traders have turned their attention to key U.S. economic data on Thursday for further cues on the Fed’s future monetary policy actions. The highlight will be May’s core personal consumption expenditures (PCE) price index -- widely seen as the central bank’s preferred inflation gauge. With oil prices heading for pre-war levels, analysts expect the May reading to likely be a peak in terms of reflecting the inflationary shock from the conflict. The dollar has also been supported on Tuesday and Wednesday by a steep sell-off in technology stocks on Wall Street, as the $1.3 trillion liquidation in global artificial intelligence and tech mega-caps led to an increase in demand for safe haven assets. The dollar’s rise on Wednesday pinned the euro to its lowest level in over a year and reverberated across major global currencies, casting a long shadow over European and Asian foreign exchange markets alike.
- The euro was last down 0.2% to $1.1358. Eurozone policymakers now find themselves caught in a vice, attempting to manage the lingering inflationary scars of a three-month conflict against forward-looking indicators that point heavily toward a widening economic slowdown. The sterling slipped 0.2% to $1.3167. Bank of England policymaker Alan Taylor earlier signaled an extended hold on interest rates. British assets in general remain constrained by a soft domestic economy and the political void left by Prime Minister Keir Starmer’s resignation. The Japanese yen remained near multi-decade lows, with the USD/JPY pair up 0.2% to 161.82, staying firmly above the key 160 level that had previously triggered intervention from Tokyo. Markets largely shrugged off a summary of opinions from the Bank of Japan’s June meeting, which showed several policymakers favored further interest-rate increases after last week’s hike to 1.0%.
- Oil prices extended their decline on Thursday to near levels last seen before the start of the Iran war, as rising supply expectations from the Middle East outweighed demand concerns. August Brent was trading lower than September, which was priced at $73.59, signalling ample short-term supply. U.S. Energy Secretary Chris Wright told a forum on Wednesday that flows through the Strait of Hormuz were close to what they were before the start of the Iran war, saying at least 20 million barrels had exited the strait in the last 24 hours. He added a return to complete normalcy would take a few weeks because the strait needs to be demined. Rising Middle Eastern supply, together with Iran set to boost sales following a temporary reprieve from U.S. sanctions, drove down prices of physical crude oil cargoes around the world An initial accord last week to end the U.S.-Israeli war with Iran, which began on February 28, has allowed traffic through the strait to restart. The accord set up a 60-day period of negotiations to tackle more difficult issues including Iran’s nuclear programme. Wright said oil would continue to flow through the strait even if the deal did not hold, and that Iran would not be able to close it again. Oman on Wednesday opened temporary routes to ease tanker departures from the Strait of Hormuz, with the International Maritime Organization and Omani authorities coordinating movements. Qatar’s prime minister visited Oman for talks on initiating negotiations over the strait’s future management with Iran, Iraq and Gulf states. Macquarie analysts expected oil to normalise quickly toward pre-war levels as supply chains adapt and the Strait of Hormuz reopens. They forecast Brent and WTI prices to average $67 and $62 per barrel, respectively, in the third quarter, down from the second quarter’s average of $94 and $87 per barrel. U.S. total crude stocks hit their lowest since 1984 last week, the Energy Information Administration said on Wednesday, driven by strong refining demand and government oil releases from its emergency reserve. Markets, however, appeared unfazed by the EIA data as traders focused on the Strait of Hormuz.
|
|
| Intraday RESISTANCE LEVELS |
| 25th June 2026 |
R1 |
R2 |
R3 |
| GOLD-XAU |
4005-4023-4044 |
4066-4085-4100 |
4130-4144-4155 |
| Silver-XAG |
57.50-58.40-59.00 |
59.90-60.40-61.00 |
61.48-62.10-63.00 |
| Crude Oil |
69.80-70.50-71.10 |
72.00-72.54-73.50 |
74.10-74.90-75.90 |
| EURO/USD |
1.1370-1.1385-1.1405 |
1.1417-1.1426 |
1.1440-1.1465-1.1485 |
| GBP/USD |
1.3200-1.3270-1.3300-1.3350 |
1.3390-1.3440-1.3490 |
1.3540-1.3600 1.3640 |
| USD/JPY |
161.90 |
162.50-162.90 |
163.50-164.00 |
| Intraday SUPPORTS LEVELS |
| 25th June 2026 |
S1 |
S2 |
S3 |
| GOLD-XAU |
3990-3374-3958 |
3940-3921-3900 |
3880-3866 |
| Silver-XAG |
57.00-56.40-55.60 |
55.00-54.10-53.00 |
52.25-51.75-51.00- |
| Crude Oil |
69.10-68.50-67.90 |
67.00-66.00-65.90 |
65.30-64.50 |
| EURO/USD |
1.1355-1.1323-1.3190 |
1.1360-1.1310 |
1.1280-1.1250 |
| GBP/USD |
1.3180-1.3160 |
11.3135-1.3120 |
1.3100-1.3079 |
| USD/JPY |
160.70-161.00-161.40-160.00 |
159.40-158.70-158.00 |
157.10-156.60 |
|
|
| Intra-Day Strategy (25th June 2026) |
| GOLD-XAU |
Sell on Strength |
| Silver-XAG |
Buy on Dips |
|
| Crude Oil |
Neutral to Sell |
| EUR/USD |
Neutral to Sell |
|
| GBP/USD |
Neutral to Buy |
| USD/JPY |
Neutral to Sell |
|
|
|
|
Gold – XAU
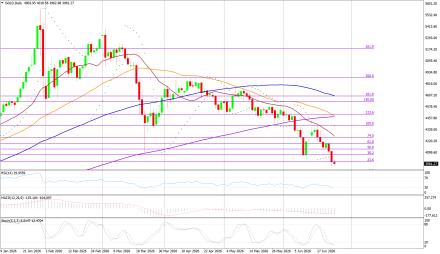
Gold on Wednesday nteraday high of US$4115.00/oz and low of $3958.87/oz. God is down by 2.75% at US$3998.60/oz.
Technicals in Focus:
On the daily charts, gold trades higher than 20DMA (2197). If it drops below this level, it could lead to 2,100. The MACD is currently above the zero line and the histograms are showing an increasing trend, indicating that there may be upward movement in the coming sessions. The RSI is currently at 83.04, which is in the overbought region, suggesting there may be selling pressure in the next 2 to 3 sessions. The Stochastic Oscillator is also in the overbought territory but has given a positive crossover, indicating a bullish stance for intraday trades, but rebound in expected in all the overbought indicators
Trading Strategy: Sell on Strength
Sell below 4005-4200 keeping stop loss closing above 4200, targeting 3990-3774-3958-3940 and 3921-3900-3880-3866. Buy in between 3990-3866 with risk below 3866 targeting 4005-4023-4044-4060 and 4085-4100-4130-4144-4155. |
|
| Intraday Support Levels |
| S1 |
|
|
3990-3374-3958 |
| S2 |
|
|
3940-3921-3900 |
| S3 |
|
|
3880-3866 |
| Intraday Resistance Levels |
| R1 |
|
|
4005-4023-4044 |
| R2 |
|
|
4066-4085-4100 |
| R3 |
|
|
4130-4144-4155 |
| Technical Indicators
|
| Name |
|
Value |
Action |
| 14DRSI |
|
52.916 |
Buy |
| 20-DMA |
|
4800.67 |
Buy |
| 50-DMA |
|
4497.76 |
Buy |
| 100-DMA |
|
4239.36 |
Buy |
| 200-DMA |
|
3800.35 |
Buy |
| STOCH(5,3) |
|
26.933 |
Sell |
| MACD(12,26,9) |
|
150.924 |
Buy |
|
|
|
|
Silver - XAG
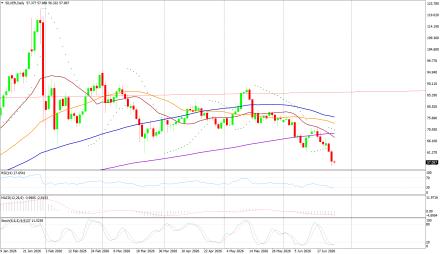
Silver on Monday its intraday high of US$65.17/oz and low of US$61.31/oz settle down by 5.14% at US$61.55/oz.
Technicals in Focus:
On daily charts, silver is sustaining above 20MA (25.05), breakage above will lead to 23.73. MACD is below the zero line and histograms are increasing trend, bringing a bullish stance in the upcoming sessions. RSI is in the oversold region, indicating a sell signal for now. The Stochastic Oscillator is in the overbought region and gives a positive crossover to show an upside move for the intraday trade.
Trading Strategy: Buy on Dips
Buy in between 63.00-59.00 targeting 63.60-64.10-65.00-65.60 and 66.50-67.20-68.00-69.10-69.60 with stop loss should be placed on the breakage below 69.00.
Sell in between 63.60-69.45 with a stop loss above 70.00 targeting 63.00-62.10-61.48-61.00 and 60.40-59.90-59.00.
|
|
| Intraday Support Levels |
| S1 |
|
|
57.00-56.40-55.60 |
| S2 |
|
|
55.00-54.10-53.00 |
| S3 |
|
|
52.25-51.75-51.00- |
| Intraday Resistance Levels |
| R1 |
|
|
57.50-58.40-59.00 |
| R2 |
|
|
59.90-60.40-61.00 |
| R3 |
|
|
61.48-62.10-63.00 |
| TECHNICAL INDICATORS |
| Name |
|
Value |
Action |
| 14DRSI |
|
46.1562 |
Buy |
| 20-DMA |
|
92.99 |
Sell |
| 50-DMA |
|
75.81 |
Sell |
| 100-DMA |
|
62.03 |
Sell |
| 200-DMA |
|
49.29 |
Sell |
| STOCH(5,3) |
|
21.094 |
Buy |
| MACD(12,26,9) |
|
5.262 |
Buy |
|
|
|
|
Oil - WTI
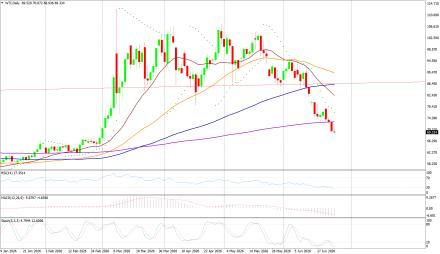
Crude Oil on Wednesday high of US$73.00/bbl, an intraday low of US$69.52/bbl, and settled down by 4.43% to close at US$69.73/bbl.
Technicals in Focus:
On daily charts, oil is sustaining above its 100DMA i.e. 75.37, a support level, and breakage above will call for 77.48. MACD is above the zero line and histograms are in increasing mode will bring a bullish stance in the upcoming sessions. The Stochastic Oscillator is in the overbought region, giving a negative crossover to confirm a bearish stance; while the RSI is in the neutral region, more upsides can be expected to reach the overbought region, which is highly probable.
Trading Strategy: Neutral to Sell
Sell in between 69.80-75.90 with stop loss at 76.00 targeting 69.10-68.50-67.90-67.00 and 65.90-65.30-64.50.
Buy above 69.00-75.90 with risk daily closing below 76.00, targeting 69.80-70.50-71.10-72.00-72.54 and 73.50-74.10-74.90-75.90.
|
|
| Intraday Support Levels |
| S1 |
|
|
69.10-68.50-67.90 |
| S2 |
|
|
67.00-66.00-65.90 |
| S3 |
|
|
65.30-64.50 |
| Intraday Resistance Levels |
| R1 |
|
|
69.80-70.50-71.10 |
| R2 |
|
|
72.00-72.54-73.50 |
| R3 |
|
|
74.10-74.90-75.90 |
| TECHNICAL INDICATORS |
| Name |
|
Value |
Action |
| 14DRSI |
|
29.346 |
Sell |
| 20-DMA |
|
67.35 |
Sell |
| 50-DMA |
|
69.06 |
Sell |
| 100-DMA |
|
70.28 |
Sell |
| 200-DMA |
|
71.85 |
Sell |
| STOCH(5,3) |
|
16.166 |
Sell |
| MACD(12,26,9) |
|
-1.306 |
Buy |
|
|
|
|
EUR/USD
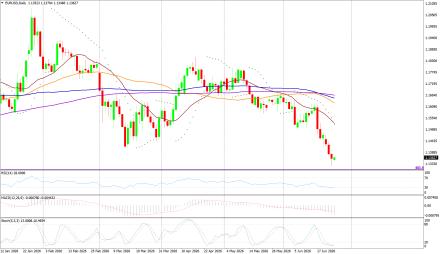
EUR/USD on Wednesday made an intraday low of US$1.1323/EUR, a high of US$1.1383/EUR, and settled down by 0.199% to close at US$1.1357/EUR.
Technicals in Focus:
On daily charts, prices are sustaining above 100DMA (1.1661), which becomes immediate support, a break below will target 1.1695. MACD is above the zero line and histograms are increasing mode, bringing a bullish view. Stochastic is in oversold territory, giving negative crossovers to the bullish outlook for intraday. 14D RSI is currently in a neutral region and giving no directions to consider right now.
Trading Strategy: Neutral to Sell
Sell below 1.1370-1.1520, targeting 1.1370-1.1385-1.1405-1.1417 and 1.1426-1.1440-1.1465-1.1520 with stop-loss at daily closing above 1.1520.
Buy above 1.1355-1.1250 with risk below 1.1250 targeting 1.1370-1.1385-1.1405-1.1426 and 1.1440-1.1465-1.1485-1.1590.
|
|
| Intraday Support Levels |
| S1 |
|
|
1.1355-1.1323-1.3190 |
| S2 |
|
|
1.1360-1.1310 |
| S3 |
|
|
1.1280-1.1250 |
| Intraday Resistance Levels |
| R1 |
|
|
1.1370-1.1385-1.1405 |
| R2 |
|
|
1.1417-1.1426 |
| R3 |
|
|
1.1440-1.1465-1.1485 |
| TECHNICAL INDICATORS |
| Name |
|
Value |
Action |
| 14DRSI |
|
48.897 |
Buy |
| 20-DMA |
|
1.1695 |
Sell |
| 50-DMA |
|
1.1656 |
Buy |
| 100-DMA |
|
1.1661 |
Buy |
| 200-DMA |
|
1.1585 |
Buy |
| STOCH(5,3) |
|
55.688 |
Buy |
| MACD(12,26,9) |
|
-0.0013 |
|
|
|
|
|
GBP/USD
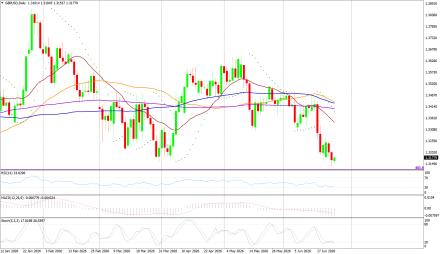
GBP/USD on Wednesday made a intraday low of US$1.3139/GBP, a high of US$1.3208/GBP, and settled the day down by 0.268% to close at US$1.3166/GBP.
Technicals in Focus:
On daily charts, prices are sustaining above 50DMA (1.2674) is becoming a support level. 14-D RSI is currently in a neutral region and direction is difficult to predict on an RSI basis. The Stochastic Oscillator is in oversold territory and gives a positive crossover to confirm a bullish stance. MACD is above the zero line, but histograms are increasing leading to movement.
Trading Strategy: Neutral to Buy
Based on the charts and explanations above; buy between 1.3200-1.3079 with a target of 1.3270-1.3350-1.3390-1.3436 and 1.3500-1.3570-1.3600-1.3640-1.3690 with a stop loss closing below 1.3150.
Sell in between 1.3270-1.3820 with targets at 1.3210-1.3190-1.3150-1.3135 and 1.3120-1.3100-1.3079 with a stop loss of 1.3900.
|
|
| Intraday Support Levels |
| S1 |
|
|
1.3180-1.3160 |
| S2 |
|
|
11.3135-1.3120 |
| S3 |
|
|
1.3100-1.3079 |
| Intraday Resistance Levels |
| R1 |
|
|
1.3200-1.3270-1.3300-1.3350 |
| R2 |
|
|
1.3390-1.3440-1.3490 |
| R3 |
|
|
1.3540-1.3600 1.3640 |
| TECHNICAL INDICATORS |
| Name |
|
Value |
Action |
| 14DRSI |
|
46.905 |
Buy |
| 20-DMA |
|
1.2932 |
Buy |
| 50-DMA |
|
1.2736 |
Buy |
| 100-DMA |
|
1.2629 |
Buy |
| 200-DMA |
|
1.2811 |
Buy |
| STOCH(5,3) |
|
9.458 |
Buy |
| MACD(12,26,9) |
|
-0.003 |
Sell |
|
|
|
|
USD/JPY
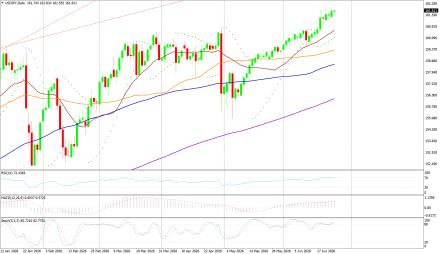
USD/JPY on Wednesday made an intra‐day low of JPY161.37/USD an intraday high of 161.83/USD, and settled the day up by 0.241% at JPY161.78/USD.
Technicals in Focus:
In daily charts, JPY is sustaining above 100DMA (152.35), major support on the daily chart. 14-D RSI is currently in the overbought region and chances of downward are expected based on RSI. MACD is above the zero line but histograms are decreasing mode which might lead to downward movement. The Stochastic Oscillator is in overbought territory and signaling to sell as it has given a negative crossover to confirm a bearish stance.
Trading Strategy: Neutral to Sell
Sell below 161.70-163.10 with risk above 163.10 targeting 158.70-158.10-157.00 and 156.60-153.00-152.65-152.10.
Long positions above 160.00-152.00 with targets of 159.40-160.00 and 160.90-161.60-162.20-162.60 with stops below 148.00.
|
|
| Intraday Support Levels |
| S1 |
|
|
160.70-161.00-161.40-160.00 |
| S2 |
|
|
159.40-158.70-158.00 |
| S3 |
|
|
157.10-156.60 |
| INTRADAY RESISTANCE LEVELS |
| R1 |
|
|
161.90 |
| R2 |
|
|
162.50-162.90 |
| R3 |
|
|
163.50-164.00 |
| TECHNICAL INDICATORS |
| Name |
|
Value |
Action |
| 14DRSI |
|
41.14 |
Buy |
| 20-DMA |
|
148.91 |
Buy |
| 50-DMA |
|
150.24 |
Buy |
| 100-DMA |
|
152.53 |
Buy |
| 200-DMA |
|
151.18 |
Buy |
| STOCH(9,6) |
|
93.662 |
Sell |
| MACD(12,26,9) |
|
0.683 |
Sell |
|
|
|
 |