 |
|
|
Daily Market Lookup
- The U.S. dollar on Thursday slipped and was on track to snap a six-day win streak, after key U.S. inflation data matched expectations and slightly eased elevated odds for Federal Reserve interest rate hikes Currency market participants were squarely focused on the May core personal consumption expenditures (PCE) price index, widely seen as the Federal Reserve’s preferred inflation gauge. Arriving at a time when a much more hawkish turn from the central bank last week stoked interest rate hike expectations, the data came in-line to slightly soft and helped quell policy tightening jitters. The core PCE rose 0.3% M/M and 3.4% Y/Y in May, in-line with consensus estimates and ticking up slightly from April. On a headline basis, PCE increased 0.4% M/M and 4.1% Y/Y in May, versus estimates of a climb of 0.5% and 4.1%, respectively. The headline and core PCE readings on a Y/Y basis are significantly above the Fed’s inflation target of 2%. They are also the highest readings since April 2023 and October 2023, respectively. The outlook for monetary policy has seen rapidly shifting dynamics since last week. The effective closure of the critical Strait of Hormuz -- a vital waterway for a fifth of the world’s oil and gas -- since the start of the U.S.-Israeli joint assault on Iran at the end of February led to the biggest supply disruption in history and surging oil prices. That in turn created an inflationary shock and forced central banks across the globe to either hike interest rates or hint at them. The Fed also joined the party after signaling a much more hawkish set of economic projections than expected under the leadership of new chair Kevin Warsh. The central bank’s updated dot plot showed at least half of the Federal Open Market Committee policymakers anticipating rate hikes this year. Market participants rushed to reprice their rate hike bets following the Fed’s hawkish turn. But the signing of an interim peace deal between the U.S. and Iran earlier this month and the subsequent uptick in shipping traffic through the Strait of Hormuz has led to a slide in oil prices, with Brent crude futures expiring in September, the global benchmark, hitting levels from just before the start of the Middle East conflict. Inflationary concerns are rapidly declining, and Wall Street largely believes that the May PCE report represents a peak in terms of showing an inflationary impact from surging crude. As per the CME FedWatch tool, the reaction to the PCE data saw a marginal easing in bets for Fed rate hikes this year and a slight uptick in bets for the central bank holding rates steady. Elsewhere, the Australian dollar erased losses and climbed 0.1% to $0.6910. Earlier in the day, data showed that Australia’s economy added 40,300 jobs in May, the strongest increase in five months, although April employment was revised sharply lower. The figures pointed to a resilient labor market but did little to alter expectations for the Reserve Bank of Australia’s policy path. Capital Economics said the employment data was unlikely to settle the debate over the RBA’s next move, though persistent underlying inflation continued to support its view that policymakers could still deliver one final "insurance" rate hike.
- The U.S. dollar on Thursday slipped and was on track to snap a six-day win streak, after key U.S. inflation data matched expectations and slightly eased elevated odds for Federal Reserve interest rate hikes. Currency market participants were squarely focused on the May core personal consumption expenditures (PCE) price index, widely seen as the Federal Reserve’s preferred inflation gauge. Arriving at a time when a much more hawkish turn from the central bank last week stoked interest rate hike expectations, the data came in-line to slightly soft and helped quell policy tightening jitters. The core PCE rose 0.3% M/M and 3.4% Y/Y in May, in-line with consensus estimates and ticking up slightly from April. On a headline basis, PCE increased 0.4% M/M and 4.1% Y/Y in May, versus estimates of a climb of 0.5% and 4.1%, respectively. The headline and core PCE readings on a Y/Y basis are significantly above the Fed’s inflation target of 2%. They are also the highest readings since April 2023 and October 2023, respectively. The outlook for monetary policy has seen rapidly shifting dynamics since last week. The effective closure of the critical Strait of Hormuz -- a vital waterway for a fifth of the world’s oil and gas -- since the start of the U.S.-Israeli joint assault on Iran at the end of February led to the biggest supply disruption in history and surging oil prices. That in turn created an inflationary shock and forced central banks across the globe to either hike interest rates or hint at them. The Fed also joined the party after signaling a much more hawkish set of economic projections than expected under the leadership of new chair Kevin Warsh. The central bank’s updated dot plot showed at least half of the Federal Open Market Committee policymakers anticipating rate hikes this year. Market participants rushed to reprice their rate hike bets following the Fed’s hawkish turn. But the signing of an interim peace deal between the U.S. and Iran earlier this month and the subsequent uptick in shipping traffic through the Strait of Hormuz has led to a slide in oil prices, with Brent crude futures expiring in September, the global benchmark, hitting levels from just before the start of the Middle East conflict. Inflationary concerns are rapidly declining, and Wall Street largely believes that the May PCE report represents a peak in terms of showing an inflationary impact from surging crude. The Japanese yen was mostly flat, with the USD/JPY pair little changed at 161.80. The yen remains above 160, a key level which has triggered intervention from Tokyo this year.
|
|
| Intraday RESISTANCE LEVELS |
| 26th June 2026 |
R1 |
R2 |
R3 |
| GOLD-XAU |
4023-4044 |
4066-4085-4100 |
4130-4144-4155 |
| Silver-XAG |
57.00-57.50-58.40-59.00 |
59.90-60.40-61.00 |
61.48-62.10-63.00 |
| Crude Oil |
70.50-71.10 |
72.00-72.54-73.50 |
74.10-74.90-75.90 |
| EURO/USD |
1.1370-1.1385-1.1405 |
1.1417-1.1426 |
1.1440-1.1465-1.1485 |
| GBP/USD |
1.3200-1.3270-1.3300-1.3350 |
1.3390-1.3440-1.3490 |
1.3540-1.3600 1.3640 |
| USD/JPY |
161.90 |
162.50-162.90 |
163.50-164.00 |
| Intraday SUPPORTS LEVELS |
| 26th June 2026 |
S1 |
S2 |
S3 |
| GOLD-XAU |
4005-3990-3374-3958 |
3940-3921-3900 |
3880-3866 |
| Silver-XAG |
56.40-55.60 |
55.00-54.10-53.00 |
52.25-51.75-51.00 |
| Crude Oil |
69.80-69.10-68.50- |
67.90-67.00-66.00 |
65.90-65.30-64.50 |
| EURO/USD |
1.1355-1.1323-1.3190 |
1.1360-1.1310 |
1.1280-1.1250 |
| GBP/USD |
1.3180-1.3160 |
11.3135-1.3120 |
1.3100-1.3079 |
| USD/JPY |
160.70-161.00-161.40-160.00 |
159.40-158.70-158.00 |
157.10-156.60 |
|
|
| Intra-Day Strategy (26th June 2026) |
| GOLD-XAU |
Sell on Strength |
| Silver-XAG |
Buy on Dips |
|
| Crude Oil |
Neutral to Sell |
| EUR/USD |
Neutral to Sell |
|
| GBP/USD |
Neutral to Buy |
| USD/JPY |
Neutral to Sell |
|
|
|
|
Gold – XAU
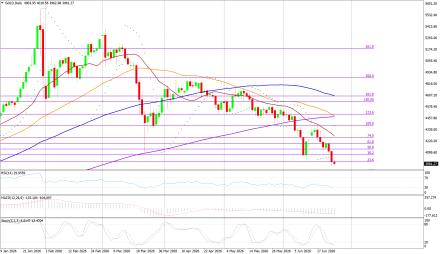
Gold on Thursday nteraday high of US$4044.11/oz and low of $3962.98/oz. God is up by 0.554% at US$4026.16/oz.
Technicals in Focus:
On the daily charts, gold trades higher than 20DMA (2197). If it drops below this level, it could lead to 2,100. The MACD is currently above the zero line and the histograms are showing an increasing trend, indicating that there may be upward movement in the coming sessions. The RSI is currently at 83.04, which is in the overbought region, suggesting there may be selling pressure in the next 2 to 3 sessions. The Stochastic Oscillator is also in the overbought territory but has given a positive crossover, indicating a bullish stance for intraday trades, but rebound in expected in all the overbought indicators.
Trading Strategy: Sell on Strength
Sell below 4005-4200 keeping stop loss closing above 4200, targeting 3990-3774-3958-3940 and 3921-3900-3880-3866. Buy in between 3990-3866 with risk below 3866 targeting 4005-4023-4044-4060 and 4085-4100-4130-4144-4155. |
|
| Intraday Support Levels |
| S1 |
|
|
4005-3990-3374-3958 |
| S2 |
|
|
3940-3921-3900 |
| S3 |
|
|
3880-3866 |
| Intraday Resistance Levels |
| R1 |
|
|
4023-4044 |
| R2 |
|
|
4066-4085-4100 |
| R3 |
|
|
4130-4144-4155 |
| Technical Indicators
|
| Name |
|
Value |
Action |
| 14DRSI |
|
52.916 |
Buy |
| 20-DMA |
|
4800.67 |
Buy |
| 50-DMA |
|
4497.76 |
Buy |
| 100-DMA |
|
4239.36 |
Buy |
| 200-DMA |
|
3800.35 |
Buy |
| STOCH(5,3) |
|
26.933 |
Sell |
| MACD(12,26,9) |
|
150.924 |
Buy |
|
|
|
|
Silver - XAG
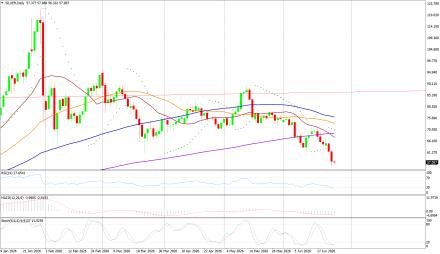
Silver on Thursday its intraday high of US$59.00/oz and low of US$56.33/oz settle up by 0.841% at US$57.86/oz.
Technicals in Focus:
On daily charts, silver is sustaining above 20MA (25.05), breakage above will lead to 23.73. MACD is below the zero line and histograms are increasing trend, bringing a bullish stance in the upcoming sessions. RSI is in the oversold region, indicating a sell signal for now. The Stochastic Oscillator is in the overbought region and gives a positive crossover to show an upside move for the intraday trade.
Trading Strategy: Buy on Dips
Buy in between 56.40-51.00 targeting 57.00-57.50-58.40-59.00 and 59.90-60.40-61.00-61.48-62.10-63.00-63.60 with stop loss should be placed on the breakage below 51.00.
Sell in between 57.60-63.45 with a stop loss above 64.00 targeting 56.40-55.60-55.00-54.10 and 53.00-52.25-51.75-51.00.
|
|
| Intraday Support Levels |
| S1 |
|
|
56.40-55.60 |
| S2 |
|
|
55.00-54.10-53.00 |
| S3 |
|
|
52.25-51.75-51.00 |
| Intraday Resistance Levels |
| R1 |
|
|
57.00-57.50-58.40-59.00 |
| R2 |
|
|
59.90-60.40-61.00 |
| R3 |
|
|
61.48-62.10-63.00 |
| TECHNICAL INDICATORS |
| Name |
|
Value |
Action |
| 14DRSI |
|
46.1562 |
Buy |
| 20-DMA |
|
92.99 |
Sell |
| 50-DMA |
|
75.81 |
Sell |
| 100-DMA |
|
62.03 |
Sell |
| 200-DMA |
|
49.29 |
Sell |
| STOCH(5,3) |
|
21.094 |
Buy |
| MACD(12,26,9) |
|
5.262 |
Buy |
|
|
|
|
Oil - WTI
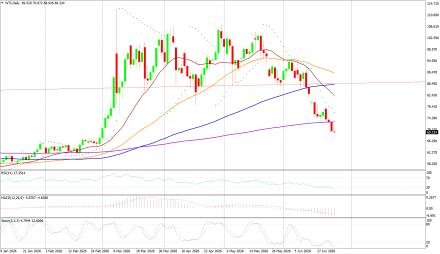
Crude Oil on Thursday high of US$73.00 /bbl, an intraday low of US$69.52/bbl, and settled down by 4.43% to close at US$69.73/bbl.
Technicals in Focus:
On daily charts, oil is sustaining above its 100DMA i.e. 75.37, a support level, and breakage above will call for 77.48. MACD is above the zero line and histograms are in increasing mode will bring a bullish stance in the upcoming sessions. The Stochastic Oscillator is in the overbought region, giving a negative crossover to confirm a bearish stance; while the RSI is in the neutral region, more upsides can be expected to reach the overbought region, which is highly probable.
Trading Strategy: Neutral to Sell
Sell in between 70.50-75.90 with stop loss at 76.00 targeting 69.10-68.50-67.90-67.00 and 65.90-65.30-64.50.
Buy above 69.80-75.90 with risk daily closing below 76.00, targeting 69.80-70.50-71.10-72.00-72.54 and 73.50-74.10-74.90-75.90.
|
|
| Intraday Support Levels |
| S1 |
|
|
69.80-69.10-68.50- |
| S2 |
|
|
67.90-67.00-66.00 |
| S3 |
|
|
65.90-65.30-64.50 |
| Intraday Resistance Levels |
| R1 |
|
|
70.50-71.10 |
| R2 |
|
|
72.00-72.54-73.50 |
| R3 |
|
|
74.10-74.90-75.90 |
| TECHNICAL INDICATORS |
| Name |
|
Value |
Action |
| 14DRSI |
|
29.346 |
Sell |
| 20-DMA |
|
67.35 |
Sell |
| 50-DMA |
|
69.06 |
Sell |
| 100-DMA |
|
70.28 |
Sell |
| 200-DMA |
|
71.85 |
Sell |
| STOCH(5,3) |
|
16.166 |
Sell |
| MACD(12,26,9) |
|
-1.306 |
Buy |
|
|
|
|
EUR/USD
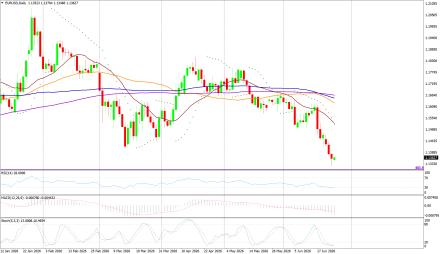
EUR/USD on Thursday made an intraday low of US$1.1332/EUR, a high of US$1.1387/EUR, and settled up by 0.147% to close at US$1.1368/EUR.
Technicals in Focus:
On daily charts, prices are sustaining above 100DMA (1.1661), which becomes immediate support, a break below will target 1.1695. MACD is above the zero line and histograms are increasing mode, bringing a bullish view. Stochastic is in oversold territory, giving negative crossovers to the bullish outlook for intraday. 14D RSI is currently in a neutral region and giving no directions to consider right now.
Trading Strategy: Neutral to Sell
Sell below 1.1380-1.1520, targeting 1.1370-1.1385-1.1405-1.1417 and 1.1426-1.1440-1.1465-1.1520 with stop-loss at daily closing above 1.1520.
Buy above 1.1355-1.1250 with risk below 1.1250 targeting 1.1370-1.1385-1.1405-1.1426 and 1.1440-1.1465-1.1485-1.1590.
|
|
| Intraday Support Levels |
| S1 |
|
|
1.1355-1.1323-1.3190 |
| S2 |
|
|
1.1360-1.1310 |
| S3 |
|
|
1.1280-1.1250 |
| Intraday Resistance Levels |
| R1 |
|
|
1.1370-1.1385-1.1405 |
| R2 |
|
|
1.1417-1.1426 |
| R3 |
|
|
1.1440-1.1465-1.1485 |
| TECHNICAL INDICATORS |
| Name |
|
Value |
Action |
| 14DRSI |
|
48.897 |
Buy |
| 20-DMA |
|
1.1695 |
Sell |
| 50-DMA |
|
1.1656 |
Buy |
| 100-DMA |
|
1.1661 |
Buy |
| 200-DMA |
|
1.1585 |
Buy |
| STOCH(5,3) |
|
55.688 |
Buy |
| MACD(12,26,9) |
|
-0.0013 |
|
|
|
|
|
GBP/USD
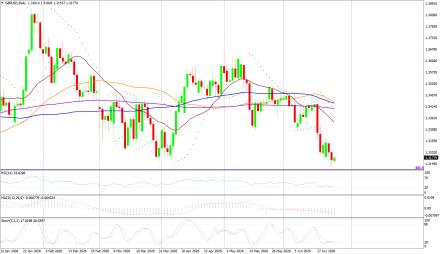
GBP/USD on Thursday made a intraday low of US$1.3150/GBP, a high of US$1.3218/GBP, and settled the day up by 0.212% to close at US$1.3189/GBP.
Technicals in Focus:
On daily charts, prices are sustaining above 50DMA (1.2674) is becoming a support level. 14-D RSI is currently in a neutral region and direction is difficult to predict on an RSI basis. The Stochastic Oscillator is in oversold territory and gives a positive crossover to confirm a bullish stance. MACD is above the zero line, but histograms are increasing leading to movement.
Trading Strategy: Neutral to Buy
Based on the charts and explanations above; buy between 1.3180-1.3079 with a target of 1.3270-1.3350-1.3390-1.3436 and 1.3500-1.3570-1.3600-1.3640-1.3690 with a stop loss closing below 1.3150.
Sell in between 1.3270-1.3820 with targets at 1.3210-1.3190-1.3150-1.3135 and 1.3120-1.3100-1.3079 with a stop loss of 1.3900.
|
|
| Intraday Support Levels |
| S1 |
|
|
1.3180-1.3160 |
| S2 |
|
|
11.3135-1.3120 |
| S3 |
|
|
1.3100-1.3079 |
| Intraday Resistance Levels |
| R1 |
|
|
1.3200-1.3270-1.3300-1.3350 |
| R2 |
|
|
1.3390-1.3440-1.3490 |
| R3 |
|
|
1.3540-1.3600 1.3640 |
| TECHNICAL INDICATORS |
| Name |
|
Value |
Action |
| 14DRSI |
|
46.905 |
Buy |
| 20-DMA |
|
1.2932 |
Buy |
| 50-DMA |
|
1.2736 |
Buy |
| 100-DMA |
|
1.2629 |
Buy |
| 200-DMA |
|
1.2811 |
Buy |
| STOCH(5,3) |
|
9.458 |
Buy |
| MACD(12,26,9) |
|
-0.003 |
Sell |
|
|
|
|
USD/JPY
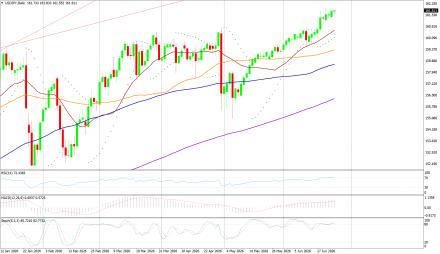
USD/JPY on Thursday made an intra‐day low of JPY161.55/USD an intraday high of 161.94/USD, and settled the day up by 0.027% at JPY161.78/USD.
Technicals in Focus:
In daily charts, JPY is sustaining above 100DMA (152.35), major support on the daily chart. 14-D RSI is currently in the overbought region and chances of downward are expected based on RSI. MACD is above the zero line but histograms are decreasing mode which might lead to downward movement. The Stochastic Oscillator is in overbought territory and signaling to sell as it has given a negative crossover to confirm a bearish stance.
Trading Strategy: Neutral to Sell
Sell below 161.70-163.10 with risk above 163.10 targeting 158.70-158.10-157.00 and 156.60-153.00-152.65-152.10.
Long positions above 160.00-152.00 with targets of 159.40-160.00 and 160.90-161.60-162.20-162.60 with stops below 148.00.
|
|
| Intraday Support Levels |
| S1 |
|
|
160.70-161.00-161.40-160.00 |
| S2 |
|
|
159.40-158.70-158.00 |
| S3 |
|
|
157.10-156.60 |
| INTRADAY RESISTANCE LEVELS |
| R1 |
|
|
161.90 |
| R2 |
|
|
162.50-162.90 |
| R3 |
|
|
163.50-164.00 |
| TECHNICAL INDICATORS |
| Name |
|
Value |
Action |
| 14DRSI |
|
41.14 |
Buy |
| 20-DMA |
|
148.91 |
Buy |
| 50-DMA |
|
150.24 |
Buy |
| 100-DMA |
|
152.53 |
Buy |
| 200-DMA |
|
151.18 |
Buy |
| STOCH(9,6) |
|
93.662 |
Sell |
| MACD(12,26,9) |
|
0.683 |
Sell |
|
|
|
 |