 |
|
|
Daily Market Lookup
- The U.S. dollar slipped on Friday, extending a decline into a second straight session after posting a six-day win streak that took it to its highest levels since May 2025. Still, elevated Federal Reserve rate hike expectations kept the currency on track for a solid weekly gain. Currency market participants this week have been focused on the future path of monetary policy amid a conflicting set of signals from U.S. economic data and oil prices. The May core personal consumption expenditures (PCE) price index -- widely seen as the Fed’s preferred inflation gauge -- ticked up slightly in May from April on both a M/M and Y/Y basis, matching economists’ and analysts’ expectations. The 3.4% Y/Y rise was the highest since October 2023. Meanwhile, increases in headline PCE on both a M/M and Y/Y basis also matched expectations, with the latter posting its highest increase since April 2023. Despite the elevated annual readings, watchers of monetary policy reacted by marginally trimming their odds for Fed interest rate hikes this year and slightly adding to their bets for the central bank to keep rates steady. The move was driven by a belief that the May PCE report was a peak in terms of price pressures, as oil prices have rapidly declined this week to levels from just before the start of the Middle East conflict and have eased inflationary concerns The PCE data comes after a big repricing in the outlook for monetary policy last week following the Fed’s release of a much more hawkish dot plot than expected. At least half of the Federal Open Market Committee’s members now expect rate hikes this year, in part due to the inflationary impact of surging oil prices. Kevin Warsh in his first press conference as the central bank’s new chief said price stability was the number one goal and that forward guidance would be dropped going forward. Warsh will be speaking again next week The focus now turns from inflation to the labor market ahead of a slew of data on that front next week. Separately on Friday, the University of Michigan’s final read on consumer sentiment for June showed an about 10% rise from May, helped by moderating gas prices. Consumers’ year-ahead inflation expectations inched down to 4.6% in June from 4.8% in May. Elsewhere, UBS analysts said a stronger dollar was likely to dominate global foreign exchange markets through the second half of this year. Turning to other major currencies, the Japanese yen weakened slightly after four straight days of firming, with the USD/JPY pair last at 161.75. In the previous session, the yen touched 161.95, its strongest level since 1986. The yen has persistently hovered above the 160 level since earlier this month, a mark that has previously triggered intervention from Tokyo. Speaking of Tokyo, consumer inflation in the greater Tokyo Metropolitan area accelerated in June but broadly came in-line with expectations. Core consumer price index rose to 1.6% Y/Y, signaling persistent underlying price pressures but offering little reason for the Bank of Japan to tighten policy more aggressively. The wide interest-rate differential with the U.S. continued to weigh on the yen despite the stronger inflation backdrop.
- Gold prices fell in Asian trade on Monday amid renewed concerns over inflation and rising interest rates after the U.S. and Iran traded strikes over the weekend, straining a tenuous ceasefire. Gold hit a near eight-month low last week amid growing concerns that the U.S. Federal Reserve will hike interest rates later this year. A recent U.S.-Iran peace deal helped curb some concerns over energy-driven inflation, especially as oil prices fell sharply and back to pre-war levels over the past week. Strong U.S. inflation data added to concerns over rate hikes, as did a hawkish signal from the Fed’s June meeting. Higher rates bode poorly for gold and metals, given that they increase the opportunity cost of investing in non-yielding assets over debt.
- Oil prices rose on Monday following days of tit-for-tat strikes by the U.S. and Iran that underscored the fragility of their interim peace deal and again slowed energy shipping through the Strait of Hormuz. Brent crude fell 10.6% last week, its third weekly decline, after crude shipments through the strait rose last week to their highest level since the U.S.-Israeli war on Iran began in late February. However, traffic has since slowed following renewed attacks on ships in the strait from Thursday, including a Qatar-linked oil tanker, that triggered strikes from the U.S. and Iran in the worst escalation since they signed an interim peace deal. Capping oil price gains, Iran and the U.S. agreed to halt recent hostilities in the Gulf and renew talks regarding their dispute over the Strait of Hormuz, a U.S. official said on Sunday. Saudi oil giant Aramco resumed crude oil loadings on Friday at its Ras Tanura terminal, west of the Strait of Hormuz, after they were halted for nearly four months, as oil producers ramped up output and exports ahead of an interim deal.
- Loadings continued even after a helicopter belonging to the company crashed on Sunday at Ras Tanura, killing 14 nationals. The cause of the crash was unknown. "Physical flows are constrained by tanker backlogs, damaged infrastructure and production shut-ins. It could take the remainder of the year before supply is near pre-conflict levels," ANZ analysts said.
|
|
| Intraday RESISTANCE LEVELS |
| 29th June 2026 |
R1 |
R2 |
R3 |
| GOLD-XAU |
4066-4085-4100 |
4132-4144-4160 |
4178-4193-4210 |
| Silver-XAG |
58.40-59.00 |
59.90-60.40-61.00 |
61.48-62.10-63.00 |
| Crude Oil |
70.50-71.10 |
72.00-72.54-73.50 |
74.10-74.90-75.90 |
| EURO/USD |
1.1370-1.1385-1.1405 |
1.1417-1.1426 |
1.1440-1.1465-1.1485 |
| GBP/USD |
1.3200-1.3270-1.3300-1.3350 |
1.3390-1.3440-1.3490 |
1.3540-1.3600 1.3640 |
| USD/JPY |
161.90 |
162.50-162.90 |
163.50-164.00 |
| Intraday SUPPORTS LEVELS |
| 29th June 2026 |
S1 |
S2 |
S3 |
| GOLD-XAU |
4044-4023-4005 |
3990-3374-3958 |
3940-3921-3900 |
| Silver-XAG |
57.50-57.00-56.40-55.60 |
55.00-54.10-53.00 |
52.25-51.75-51.00 |
| Crude Oil |
69.80-69.10-68.50 |
67.90-67.00-66.00 |
65.90-65.30-64.50 |
| EURO/USD |
1.1355-1.1323-1.3190 |
1.1360-1.1310 |
1.1280-1.1250 |
| GBP/USD |
1.3180-1.3160 |
11.3135-1.3120 |
1.3100-1.3079 |
| USD/JPY |
160.70-161.00-161.40-160.00 |
159.40-158.70-158.00 |
157.10-156.60 |
|
|
| Intra-Day Strategy (29th June 2026) |
| GOLD-XAU |
Sell on Strength |
| Silver-XAG |
Buy on Dips |
|
| Crude Oil |
Neutral to Sell |
| EUR/USD |
Neutral to Sell |
|
| GBP/USD |
Neutral to Buy |
| USD/JPY |
Neutral to Sell |
|
|
|
|
Gold – XAU
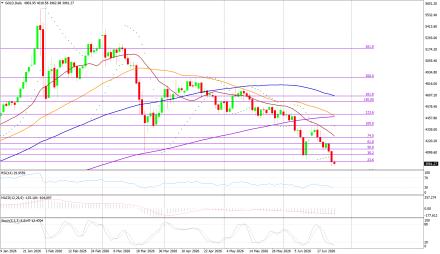
Gold on Friday interaday high of US$4095.94/oz and low of $3983.00/oz. God is up by 1.491% at US$4088.45/oz.
Technicals in Focus:
On the daily charts, gold trades higher than 20DMA (2197). If it drops below this level, it could lead to 2,100. The MACD is currently above the zero line and the histograms are showing an increasing trend, indicating that there may be upward movement in the coming sessions. The RSI is currently at 83.04, which is in the overbought region, suggesting there may be selling pressure in the next 2 to 3 sessions. The Stochastic Oscillator is also in the overbought territory but has given a positive crossover, indicating a bullish stance for intraday trades, but rebound in expected in all the overbought indicators.
Trading Strategy: Sell on Strength
Sell below 4066-4200 keeping stop loss closing above 4200, targeting 4044-4023-3990-3774 and 3958-3940-3921-3900.
Buy in between 4044-3866 with risk below 3866 targeting 4066-4085-4100-4130 and 4144-4160-4178-4193-4210.
|
|
| Intraday Support Levels |
| S1 |
|
|
4044-4023-4005 |
| S2 |
|
|
3990-3374-3958 |
| S3 |
|
|
3940-3921-3900 |
| Intraday Resistance Levels |
| R1 |
|
|
4066-4085-4100 |
| R2 |
|
|
4132-4144-4160 |
| R3 |
|
|
4178-4193-4210 |
| Technical Indicators
|
| Name |
|
Value |
Action |
| 14DRSI |
|
52.916 |
Buy |
| 20-DMA |
|
4800.67 |
Buy |
| 50-DMA |
|
4497.76 |
Buy |
| 100-DMA |
|
4239.36 |
Buy |
| 200-DMA |
|
3800.35 |
Buy |
| STOCH(5,3) |
|
26.933 |
Sell |
| MACD(12,26,9) |
|
150.924 |
Buy |
|
|
|
|
Silver - XAG
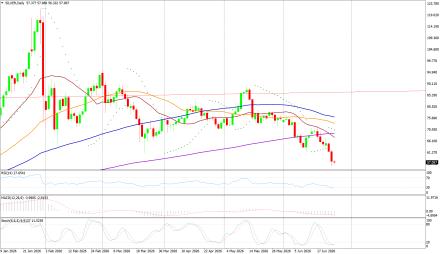
Silver on Friday its intraday high of US$59.56/oz and low of US$55.69/oz settle up by 2.40% at US$59.18/oz.
Technicals in Focus:
On daily charts, silver is sustaining above 20MA (25.05), breakage above will lead to 23.73. MACD is below the zero line and histograms are increasing trend, bringing a bullish stance in the upcoming sessions. RSI is in the oversold region, indicating a sell signal for now. The Stochastic Oscillator is in the overbought region and gives a positive crossover to show an upside move for the intraday trade.
Trading Strategy: Buy on Dips
Buy in between 57.40-51.00 targeting 58.40-59.00 and 59.90-60.40-61.00-61.48-62.10-63.00-63.60 with stop loss should be placed on the breakage below 51.00.
Sell in between 58.40-63.45 with a stop loss above 64.00 targeting 56.40-55.60-55.00-54.10 and 53.00-52.25-51.75-51.00.
|
|
| Intraday Support Levels |
| S1 |
|
|
57.50-57.00-56.40-55.60 |
| S2 |
|
|
55.00-54.10-53.00 |
| S3 |
|
|
52.25-51.75-51.00 |
| Intraday Resistance Levels |
| R1 |
|
|
58.40-59.00 |
| R2 |
|
|
59.90-60.40-61.00 |
| R3 |
|
|
61.48-62.10-63.00 |
| TECHNICAL INDICATORS |
| Name |
|
Value |
Action |
| 14DRSI |
|
46.1562 |
Buy |
| 20-DMA |
|
92.99 |
Sell |
| 50-DMA |
|
75.81 |
Sell |
| 100-DMA |
|
62.03 |
Sell |
| 200-DMA |
|
49.29 |
Buy |
| STOCH(5,3) |
|
21.094 |
Buy |
| MACD(12,26,9) |
|
5.262 |
Buy |
|
|
|
|
Oil - WTI
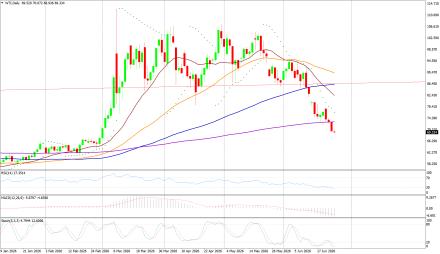
Crude Oil on Friday high of US$71.66/bbl, an intraday low of US$68.45/bbl, and settled down by 1.30% to close at US$70.18/bbl.
Technicals in Focus:
On daily charts, oil is sustaining above its 100DMA i.e. 75.37, a support level, and breakage above will call for 77.48. MACD is above the zero line and histograms are in increasing mode will bring a bullish stance in the upcoming sessions. The Stochastic Oscillator is in the overbought region, giving a negative crossover to confirm a bearish stance; while the RSI is in the neutral region, more upsides can be expected to reach the overbought region, which is highly probable.
Trading Strategy: Neutral to Sell
Sell in between 70.50-75.90 with stop loss at 76.00 targeting 69.10-68.50-67.90-67.00 and 65.90-65.30-64.50.
Buy above 69.80-75.90 with risk daily closing below 76.00, targeting 69.80-70.50-71.10-72.00-72.54 and 73.50-74.10-74.90-75.90.
|
|
| Intraday Support Levels |
| S1 |
|
|
69.80-69.10-68.50 |
| S2 |
|
|
67.90-67.00-66.00 |
| S3 |
|
|
65.90-65.30-64.50 |
| Intraday Resistance Levels |
| R1 |
|
|
70.50-71.10 |
| R2 |
|
|
72.00-72.54-73.50 |
| R3 |
|
|
74.10-74.90-75.90 |
| TECHNICAL INDICATORS |
| Name |
|
Value |
Action |
| 14DRSI |
|
29.346 |
Sell |
| 20-DMA |
|
67.35 |
Sell |
| 50-DMA |
|
69.06 |
Sell |
| 100-DMA |
|
70.28 |
Sell |
| 200-DMA |
|
71.85 |
Sell |
| STOCH(5,3) |
|
16.166 |
Sell |
| MACD(12,26,9) |
|
-1.306 |
Buy |
|
|
|
|
EUR/USD
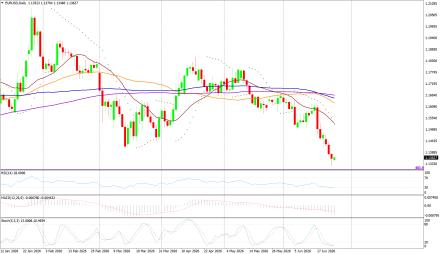
EUR/USD on Friday made an intraday low of US$1.13534/EUR, a high of US$1.1433/EUR, and settled up by 0.128% to close at US$1.1383/EUR.
Technicals in Focus:
On daily charts, prices are sustaining above 100DMA (1.1661), which becomes immediate support, a break below will target 1.1695. MACD is above the zero line and histograms are increasing mode, bringing a bullish view. Stochastic is in oversold territory, giving negative crossovers to the bullish outlook for intraday. 14D RSI is currently in a neutral region and giving no directions to consider right now.
Trading Strategy: Neutral to Sell
Sell below 1.1380-1.1520, targeting 1.1370-1.1385-1.1405-1.1417 and 1.1426-1.1440-1.1465-1.1520 with stop-loss at daily closing above 1.1520.
Buy above 1.1355-1.1250 with risk below 1.1250 targeting 1.1370-1.1385-1.1405-1.1426 and 1.1440-1.1465-1.1485-1.1590.
|
|
| Intraday Support Levels |
| S1 |
|
|
1.1355-1.1323-1.3190 |
| S2 |
|
|
1.1360-1.1310 |
| S3 |
|
|
1.1280-1.1250 |
| Intraday Resistance Levels |
| R1 |
|
|
1.1370-1.1385-1.1405 |
| R2 |
|
|
1.1417-1.1426 |
| R3 |
|
|
1.1440-1.1465-1.1485 |
| TECHNICAL INDICATORS |
| Name |
|
Value |
Action |
| 14DRSI |
|
48.897 |
Buy |
| 20-DMA |
|
1.1695 |
Sell |
| 50-DMA |
|
1.1656 |
Buy |
| 100-DMA |
|
1.1661 |
Buy |
| 200-DMA |
|
1.1585 |
Buy |
| STOCH(5,3) |
|
55.688 |
Buy |
| MACD(12,26,9) |
|
-0.0013 |
|
|
|
|
|
GBP/USD
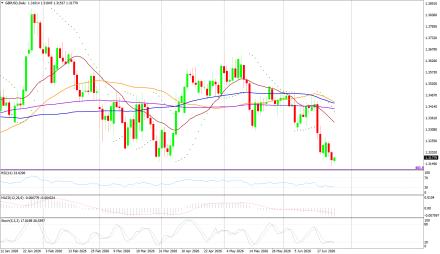
GBP/USD on Friday made a intraday low of US$1.3179GBP, a high of US$1.3231/GBP, and settled the day up by 0.0454% to close at US$1.3195/GBP.
Technicals in Focus:
On daily charts, prices are sustaining above 50DMA (1.2674) is becoming a support level. 14-D RSI is currently in a neutral region and direction is difficult to predict on an RSI basis. The Stochastic Oscillator is in oversold territory and gives a positive crossover to confirm a bullish stance. MACD is above the zero line, but histograms are increasing leading to movement.
Trading Strategy: Neutral to Buy
Based on the charts and explanations above; buy between 1.3180-1.3079 with a target of 1.3270-1.3350-1.3390-1.3436 and 1.3500-1.3570-1.3600-1.3640-1.3690 with a stop loss closing below 1.3150.
Sell in between 1.3270-1.3820 with targets at 1.3210-1.3190-1.3150-1.3135 and 1.3120-1.3100-1.3079 with a stop loss of 1.3900.
|
|
| Intraday Support Levels |
| S1 |
|
|
1.3180-1.3160 |
| S2 |
|
|
11.3135-1.3120 |
| S3 |
|
|
1.3100-1.3079 |
| Intraday Resistance Levels |
| R1 |
|
|
1.3200-1.3270-1.3300-1.3350 |
| R2 |
|
|
1.3390-1.3440-1.3490 |
| R3 |
|
|
1.3540-1.3600 1.3640 |
| TECHNICAL INDICATORS |
| Name |
|
Value |
Action |
| 14DRSI |
|
46.905 |
Buy |
| 20-DMA |
|
1.2932 |
Buy |
| 50-DMA |
|
1.2736 |
Buy |
| 100-DMA |
|
1.2629 |
Buy |
| 200-DMA |
|
1.2811 |
Buy |
| STOCH(5,3) |
|
9.458 |
Buy |
| MACD(12,26,9) |
|
-0.003 |
Sell |
|
|
|
|
USD/JPY
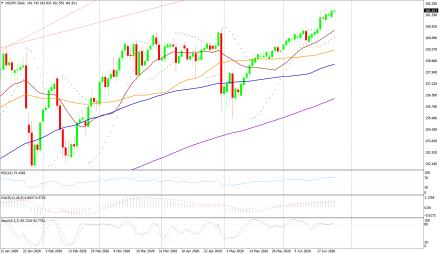
USD/JPY on Friday made an intra‐day low of JPY161.52/USD an intraday high of 161.84/USD, and settled the day up by 0.006% at JPY161.75/USD.
Technicals in Focus:
In daily charts, JPY is sustaining above 100DMA (152.35), major support on the daily chart. 14-D RSI is currently in the overbought region and chances of downward are expected based on RSI. MACD is above the zero line but histograms are decreasing mode which might lead to downward movement. The Stochastic Oscillator is in overbought territory and signaling to sell as it has given a negative crossover to confirm a bearish stance.
Trading Strategy: Neutral to Sell
Sell below 161.70-163.10 with risk above 163.10 targeting 158.70-158.10-157.00 and 156.60-153.00-152.65-152.10.
Long positions above 160.00-152.00 with targets of 159.40-160.00 and 160.90-161.60-162.20-162.60 with stops below 148.00.
|
|
| Intraday Support Levels |
| S1 |
|
|
160.70-161.00-161.40-160.00 |
| S2 |
|
|
159.40-158.70-158.00 |
| S3 |
|
|
157.10-156.60 |
| INTRADAY RESISTANCE LEVELS |
| R1 |
|
|
161.90 |
| R2 |
|
|
162.50-162.90 |
| R3 |
|
|
163.50-164.00 |
| TECHNICAL INDICATORS |
| Name |
|
Value |
Action |
| 14DRSI |
|
41.14 |
Buy |
| 20-DMA |
|
148.91 |
Buy |
| 50-DMA |
|
150.24 |
Buy |
| 100-DMA |
|
152.53 |
Buy |
| 200-DMA |
|
151.18 |
Buy |
| STOCH(9,6) |
|
93.662 |
Sell |
| MACD(12,26,9) |
|
0.683 |
Sell |
|
|
|
 |