 |
|
|
Daily Market Lookup
- The U.S. dollar on Tuesday ticked up marginally after strong labor market data slightly boosted Federal Reserve interest rate expectations and lifted Treasury yields. Meanwhile, the Japanese yen continued to hover at its weakest level against the dollar in four decades. Currency market participants this week are squarely focused on a series of U.S. labor market indicators for further signals on future Fed monetary policy actions. The central bank earlier this month signaled a shift in its focus to solely reducing inflation. The Fed’s preferred inflation gauge last Thursday ticked up to its highest annual level in May since October 2023, while its headline measure posted its highest annual increase since April 2023. The increase was largely driven by a sharp spike in oil prices due to the Iran war, prompting traders to raise their expectations for Fed rate hikes. But a slide in oil back to pre-conflict levels has eased inflationary concerns, though analysts and policymakers have flagged that price pressures from the oil shock could still be working their way through the economy. Against this backdrop, if labor market data comes in strong this week, it will give the Fed even less room for any potential policy easing. On Tuesday, the Job Openings and Labor Turnover Summary (JOLTS) for May showed job openings rising to 7.594 million, higher than the expected figure of 7.296 million and above April’s revised 7.585 million reading. May openings were the highest since May 2024. Separately, the Conference Board’s gauge of U.S. consumer confidence ticked up to 91.2 in June, missing the consensus estimate but rising from May’s downwardly revised figure of 90.6. Falling oil prices in recent weeks boosted confidence and eased consumer inflation fears. While equity markets cheered the Conference Board’s update and the JOLTS report, traders also responded to the latter by slightly raising their odds for rate hikes this year, as per the CME FedWatch tool, while dumping bonds, which led to a rise in U.S. Treasury yields. Higher rate environments tend to strengthen the dollar. The labor market indicators will continue on Wednesday in ADP’s private employment report and Challenger, Gray & Christmas’ job cuts report, followed by the all-important May nonfarm payrolls report on Thursday. Away from the economic calendar, currency markets were looking ahead to the climax of the European Central Bank’s (ECB) annual forum in Sintra, Portugal, for further commentary on global interest rates. The event will culminate in a highly anticipated policy panel featuring new Fed Chair Kevin Warsh, who will be making his first public speech since addressing U.S. reporters earlier this month. He will be joined by Bank of England Governor Andrew Bailey and Bank of Canada Governor Tiff Macklem. Warsh’s comments will be parsed for clues on whether incoming data justified the Fed’s recent hawkish lean. The central bank’s updated dot plot on June 17 showed at least half of the Federal Open Market Committee’s policymakers anticipating rate hikes this year. Cleveland Fed President Beth Hammack on Tuesday told CNBC on the sidelines of the ECB forum that it was possible she would advocate for higher rates if inflation does not ease. Also at the ECB event, speeches from Chief Economist Philip Lane and Executive Board member Isabel Schnabel will be monitored for clues on the Eurozone’s monetary policy path, as internal splits widen over sticky core inflation. Looking at other major currencies, the Japanese yen grabbed a chunk of the spotlight after another bout of weakening on Tuesday. The USD/JPY pair was last up 0.4% to 162.60, keeping the yen at its lowest against the dollar since 1986. Repeated attempts by Chief Cabinet Secretary Minoru Kihara and Finance Minister Satsuki Katayama to stabilize sentiment did little to arrest the slide. The yen’s persistent decline highlights the limits of Japan’s recent monetary policy shifts. Even as the Bank of Japan broke with decades of precedent to lift its benchmark policy rate to a 30-year high of 1%, the widening interest rate differential between the U.S. and Japan continues to favor the greenback.Additionally, Tokyo’s previous efforts to arrest the yen’s slide have yielded only fleeting relief, with authorities spending a record 11.73 trillion yen, or more than $70 billion, between late April and late May to prop up the currency.
- Oil prices rose on Wednesday on concerns breakdowns in discussions between Iran and the U.S. for a final agreement to end their war may extend supply disruptions in the key Middle East producing region. U.S. President Donald Trump’s son-in-law Jared Kushner and envoy Steve Witkoff arrived in Doha for what the White House described as "high level" talks on Tuesday, but Iran and host Qatar said they would meet with mediators, rather than the Iranians themselves. Qatar said Prime Minister Sheikh Mohammed bin Abdulrahman al-Thani was among those to meet with Witkoff and Kushner Brent fell by around $45 a barrel between the first and second quarters of this year, its largest quarterly loss since 2008 during the financial crisis. U.S. crude futures meanwhile fell by around $31, their largest quarterly loss since 2020, when the COVID-19 pandemic crushed global oil demand. The declines followed progress toward ending the Middle East conflict, pulling back from the sharp gains triggered earlier by the hostilities. Analysts have cut their 2026 oil price forecasts for the first time since the Iran war began, after five straight monthly increases, as the reopening of the Strait of Hormuz eased concerns over prolonged supply disruptions, a Reuters poll showed on Tuesday. U.S. Vice President JD Vance said Iran would be prevented from charging tolls through the strait, telling The Michael Knowles Show, "This is not going to end in a place where the Iranians are collecting tolls on ships going through the Strait of Hormuz." Tanker traffic through the critical waterway has started to recover, with Vance claiming that oil flows through the strait had been restored to pre-war levels. Meanwhile, U.S. crude oil inventories fell again last week while gasoline stocks also declined, market sources said, citing data from the American Petroleum Institute released on Tuesday. Crude stocks fell by 6.1 million barrels in the week ended June 26, the sources said on condition of anonymity Official U.S. oil stock data from the Energy Information Administration will be released at 10:30 a.m. EDT (1430 GMT) on Wednesday.
|
|
| Intraday RESISTANCE LEVELS |
| 1st July 2026 |
R1 |
R2 |
R3 |
| GOLD-XAU |
3990-4005-4023 |
4066-4085-4100 |
4132-4144-4160 |
| Silver-XAG |
58.40-59.00 |
59.90-60.40-61.00 |
61.48-62.10-63.00 |
| Crude Oil |
69.80-70.50-71.10 |
72.00-72.54-73.50 |
74.10-74.90-75.90 |
| EURO/USD |
1.1405 |
1.1417-1.1426 |
1.1440-1.1465-1.1485 |
| GBP/USD |
1.3200-1.3270-1.3300-1.3350 |
1.3390-1.3440-1.3490 |
1.3540-1.3600 1.3640 |
| USD/JPY |
161.90 |
162.50-162.90 |
163.50-164.00 |
| Intraday SUPPORTS LEVELS |
| 1st July 2026 |
S1 |
S2 |
S3 |
| GOLD-XAU |
3374-3958 |
3942-3921-3900 |
3884-3870 |
| Silver-XAG |
57.50-57.00-56.40-55.60 |
55.00-54.10-53.00 |
52.25-51.75-51.00 |
| Crude Oil |
69.10-68.50 |
67.90-67.00-66.00 |
65.90-65.30-64.50 |
| EURO/USD |
1.1385-1.1370-1.1355 |
1.1323-1.3190-1.1360 |
1.1310-1.1280-1.1250 |
| GBP/USD |
1.3180-1.3160 |
11.3135-1.3120 |
1.3100-1.3079 |
| USD/JPY |
160.70-161.00-161.40-160.00 |
159.40-158.70-158.00 |
157.10-156.60 |
|
|
| Intra-Day Strategy (1st July 2026) |
| GOLD-XAU |
Sell on Strength |
| Silver-XAG |
Buy on Dips |
|
| Crude Oil |
Neutral to Sell |
| EUR/USD |
Neutral to Sell |
|
| GBP/USD |
Neutral to Buy |
| USD/JPY |
Neutral to Sell |
|
|
|
|
Gold – XAU
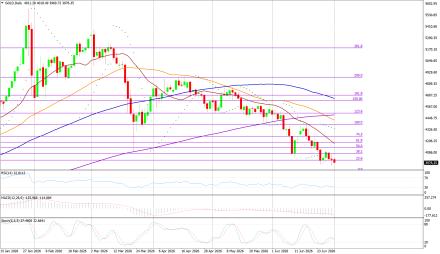
Gold on Tuesday interaday high of US$4063.38/oz and low of $3942.40/oz. God is up by 1.491% at US$4006.99/oz.
Technicals in Focus:
On the daily charts, gold trades higher than 20DMA (2197). If it drops below this level, it could lead to 2,100. The MACD is currently above the zero line and the histograms are showing an increasing trend, indicating that there may be upward movement in the coming sessions. The RSI is currently at 83.04, which is in the overbought region, suggesting there may be selling pressure in the next 2 to 3 sessions. The Stochastic Oscillator is also in the overbought territory but has given a positive crossover, indicating a bullish stance for intraday trades, but rebound in expected in all the overbought indicators.
Trading Strategy: Sell on Strength
Sell below 3990-4200 keeping stop loss closing above 4200, targeting 3774 and 3958-3940-3921-3900.
Buy in between 3970-3866 with risk below 3866 targeting 3990-4005-4023-4066-4085 and 4100-4130-4144-4160.
|
|
| Intraday Support Levels |
| S1 |
|
|
3374-3958 |
| S2 |
|
|
3942-3921-3900 |
| S3 |
|
|
3884-3870 |
| Intraday Resistance Levels |
| R1 |
|
|
3990-4005-4023 |
| R2 |
|
|
4066-4085-4100 |
| R3 |
|
|
4132-4144-4160 |
| Technical Indicators
|
| Name |
|
Value |
Action |
| 14DRSI |
|
52.916 |
Buy |
| 20-DMA |
|
4800.67 |
Buy |
| 50-DMA |
|
4497.76 |
Buy |
| 100-DMA |
|
4239.36 |
Buy |
| 200-DMA |
|
3800.35 |
Buy |
| STOCH(5,3) |
|
26.933 |
Sell |
| MACD(12,26,9) |
|
150.924 |
Buy |
|
|
|
|
Silver - XAG
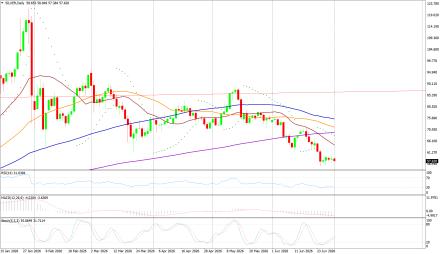
Silver on Friday its intraday high of US$60.42/oz and low of US$58.53/oz settle up by 0.499% at US$58.53/oz.
Technicals in Focus:
On daily charts, silver is sustaining above 20MA (25.05), breakage above will lead to 23.73. MACD is below the zero line and histograms are increasing trend, bringing a bullish stance in the upcoming sessions. RSI is in the oversold region, indicating a sell signal for now. The Stochastic Oscillator is in the overbought region and gives a positive crossover to show an upside move for the intraday trade.
Trading Strategy: Buy on Dips
Buy in between 57.40-51.00 targeting 58.40-59.00 and 59.90-60.40-61.00-61.48-62.10-63.00-63.60 with stop loss should be placed on the breakage below 51.00.
Sell in between 58.40-63.45 with a stop loss above 64.00 targeting 56.40-55.60-55.00-54.10 and 53.00-52.25-51.75-51.00.
|
|
| Intraday Support Levels |
| S1 |
|
|
57.50-57.00-56.40-55.60 |
| S2 |
|
|
55.00-54.10-53.00 |
| S3 |
|
|
52.25-51.75-51.00 |
| Intraday Resistance Levels |
| R1 |
|
|
58.40-59.00 |
| R2 |
|
|
59.90-60.40-61.00 |
| R3 |
|
|
61.48-62.10-63.00 |
| TECHNICAL INDICATORS |
| Name |
|
Value |
Action |
| 14DRSI |
|
46.1562 |
Buy |
| 20-DMA |
|
92.99 |
Sell |
| 50-DMA |
|
75.81 |
Sell |
| 100-DMA |
|
62.03 |
Sell |
| 200-DMA |
|
49.29 |
Sell |
| STOCH(5,3) |
|
21.094 |
Buy |
| MACD(12,26,9) |
|
5.262 |
Buy |
|
|
|
|
Oil - WTI
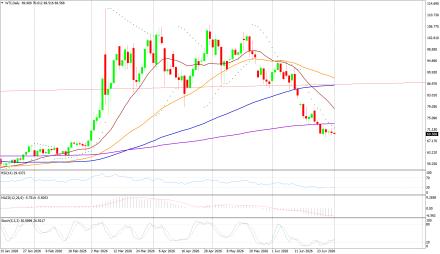
Crude Oil on Tuesday high of US$71.41/bbl, an intraday low of US$69.11/bbl, and settled down by 0.499% to close at US$69.88/bbl.
Technicals in Focus:
On daily charts, oil is sustaining above its 100DMA i.e. 75.37, a support level, and breakage above will call for 77.48. MACD is above the zero line and histograms are in increasing mode will bring a bullish stance in the upcoming sessions. The Stochastic Oscillator is in the overbought region, giving a negative crossover to confirm a bearish stance; while the RSI is in the neutral region, more upsides can be expected to reach the overbought region, which is highly probable.
Trading Strategy: Neutral to Sell
Sell in between 69.50-75.90 with stop loss at 76.00 targeting 69.10-68.50-67.90-67.00 and 65.90-65.30-64.50.
Buy above 69.80-75.90 with risk daily closing below 76.00, targeting 69.80-70.50-71.10-72.00-72.54 and 73.50-74.10-74.90-75.90.
|
|
| Intraday Support Levels |
| S1 |
|
|
69.10-68.50 |
| S2 |
|
|
67.90-67.00-66.00 |
| S3 |
|
|
65.90-65.30-64.50 |
| Intraday Resistance Levels |
| R1 |
|
|
69.80-70.50-71.10 |
| R2 |
|
|
72.00-72.54-73.50 |
| R3 |
|
|
74.10-74.90-75.90 |
| TECHNICAL INDICATORS |
| Name |
|
Value |
Action |
| 14DRSI |
|
29.346 |
Sell |
| 20-DMA |
|
67.35 |
Sell |
| 50-DMA |
|
69.06 |
Sell |
| 100-DMA |
|
70.28 |
Sell |
| 200-DMA |
|
71.85 |
Sell |
| STOCH(5,3) |
|
16.166 |
Sell |
| MACD(12,26,9) |
|
-1.306 |
Buy |
|
|
|
|
EUR/USD
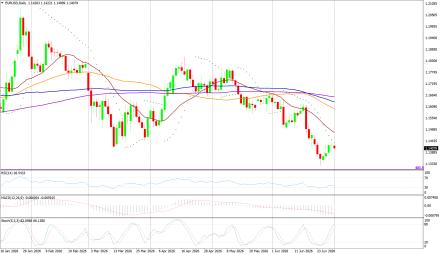
EUR/USD on Tuesday made an intraday low of US$1.1381/EUR, a high of US$1.1436/EUR, and settled up by 0.128% to close at US$1.1421/EUR.
Technicals in Focus:
On daily charts, prices are sustaining above 100DMA (1.1661), which becomes immediate support, a break below will target 1.1695. MACD is above the zero line and histograms are increasing mode, bringing a bullish view. Stochastic is in oversold territory, giving negative crossovers to the bullish outlook for intraday. 14D RSI is currently in a neutral region and giving no directions to consider right now.
Trading Strategy: Neutral to Sell
Sell below 1.1410-1.1520, targeting 1.1370-1.1385-1.1405-1.1417 and 1.1426-1.1440-1.1465-1.1520 with stop-loss at daily closing above 1.1520.
Buy above 1.1385-1.1250 with risk below 1.1250 targeting 1.1370-1.1385-1.1405-1.1426 and 1.1440-1.1465-1.1485-1.1590.
|
|
| Intraday Support Levels |
| S1 |
|
|
1.1385-1.1370-1.1355 |
| S2 |
|
|
1.1323-1.3190-1.1360 |
| S3 |
|
|
1.1310-1.1280-1.1250 |
| Intraday Resistance Levels |
| R1 |
|
|
1.1405 |
| R2 |
|
|
1.1417-1.1426 |
| R3 |
|
|
1.1440-1.1465-1.1485 |
| TECHNICAL INDICATORS |
| Name |
|
Value |
Action |
| 14DRSI |
|
48.897 |
Buy |
| 20-DMA |
|
1.1695 |
Sell |
| 50-DMA |
|
1.1656 |
Buy |
| 100-DMA |
|
1.1661 |
Buy |
| 200-DMA |
|
1.1585 |
Buy |
| STOCH(5,3) |
|
55.688 |
Buy |
| MACD(12,26,9) |
|
-0.0013 |
|
|
|
|
|
GBP/USD
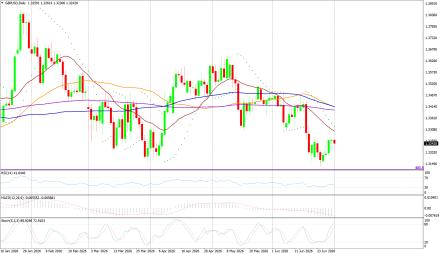
GBP/USD on Tuesday made a intraday low of US$1.3179GBP, a high of US$1.3231/GBP, and settled the day up by 0.0454% to close at US$1.3195/GBP.
Technicals in Focus:
On daily charts, prices are sustaining above 50DMA (1.2674) is becoming a support level. 14-D RSI is currently in a neutral region and direction is difficult to predict on an RSI basis. The Stochastic Oscillator is in oversold territory and gives a positive crossover to confirm a bullish stance. MACD is above the zero line, but histograms are increasing leading to movement.
Trading Strategy: Neutral to Buy
Based on the charts and explanations above; buy between 1.3180-1.3079 with a target of 1.3270-1.3350-1.3390-1.3436 and 1.3500-1.3570-1.3600-1.3640-1.3690 with a stop loss closing below 1.3150.
Sell in between 1.3270-1.3820 with targets at 1.3210-1.3190-1.3150-1.3135 and 1.3120-1.3100-1.3079 with a stop loss of 1.3900.
|
|
| Intraday Support Levels |
| S1 |
|
|
1.3180-1.3160 |
| S2 |
|
|
11.3135-1.3120 |
| S3 |
|
|
1.3100-1.3079 |
| Intraday Resistance Levels |
| R1 |
|
|
1.3200-1.3270-1.3300-1.3350 |
| R2 |
|
|
1.3390-1.3440-1.3490 |
| R3 |
|
|
1.3540-1.3600 1.3640 |
| TECHNICAL INDICATORS |
| Name |
|
Value |
Action |
| 14DRSI |
|
46.905 |
Buy |
| 20-DMA |
|
1.2932 |
Buy |
| 50-DMA |
|
1.2736 |
Buy |
| 100-DMA |
|
1.2629 |
Buy |
| 200-DMA |
|
1.2811 |
Buy |
| STOCH(5,3) |
|
9.458 |
Buy |
| MACD(12,26,9) |
|
-0.003 |
Sell |
|
|
|
|
USD/JPY
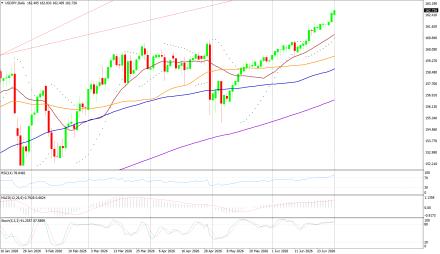
USD/JPY on Friday made an intra‐day low of JPY161.52/USD an intraday high of 161.84/USD, and settled the day up by 0.006% at JPY161.75/USD.
Technicals in Focus:
In daily charts, JPY is sustaining above 100DMA (152.35), major support on the daily chart. 14-D RSI is currently in the overbought region and chances of downward are expected based on RSI. MACD is above the zero line but histograms are decreasing mode which might lead to downward movement. The Stochastic Oscillator is in overbought territory and signaling to sell as it has given a negative crossover to confirm a bearish stance.
Trading Strategy: Neutral to Sell
Sell below 161.70-163.10 with risk above 163.10 targeting 158.70-158.10-157.00 and 156.60-153.00-152.65-152.10.
Long positions above 160.00-152.00 with targets of 159.40-160.00 and 160.90-161.60-162.20-162.60 with stops below 148.00.
|
|
| Intraday Support Levels |
| S1 |
|
|
160.70-161.00-161.40-160.00 |
| S2 |
|
|
159.40-158.70-158.00 |
| S3 |
|
|
157.10-156.60 |
| INTRADAY RESISTANCE LEVELS |
| R1 |
|
|
161.90 |
| R2 |
|
|
162.50-162.90 |
| R3 |
|
|
163.50-164.00 |
| TECHNICAL INDICATORS |
| Name |
|
Value |
Action |
| 14DRSI |
|
41.14 |
Buy |
| 20-DMA |
|
148.91 |
Buy |
| 50-DMA |
|
150.24 |
Buy |
| 100-DMA |
|
152.53 |
Buy |
| 200-DMA |
|
151.18 |
Buy |
| STOCH(9,6) |
|
93.662 |
Sell |
| MACD(12,26,9) |
|
|
|
|
|
|
 |