 |
|
|
Daily Market Lookup
- The United States has resumed some air shipments of U.S. dollars to Iraq, several months after suspending them, the New York Times reported on Thursday, citing two aides to Iraq’s prime minister. Mudhar Muhammad Salih, a financial adviser to the prime minister, also confirmed resumption of the transfer, the report said. In April, Washington halted a shipment of about $500 million in cash bound for Iraq and suspended parts of its security cooperation with Baghdad, in a move aimed at pressuring the Iraqi government over the actions of Iran-backed militias. The suspension in cooperation and funding for Iraq’s security services remains in place, the NYT report said. The White House, U.S. State Department and the Treasury did not immediately respond to requests for comment outside business hours. Reuters could not immediately verify the report. The measures were taken as the fallout from the Iran war escalated, with the U.S. blaming Iranian-backed militias for attacks in Iraq, including repeated strikes on the U.S. embassy in Baghdad and the U.S. consulate in the Kurdistan region. The best investments start with better data. Going with your gut has its place, but when excitement masquerades as intuition, it can lead to costly mistakes—or analysis paralysis.
- Oil prices fell on Thursday as traders continued to assess easing risks to Middle East crude supplies, with improving supply expectations keeping pressure on the market despite lingering geopolitical uncertainty. Markets also digested the outcome of indirect U.S.-Iran talks in Doha, where negotiators concluded two days of technical discussions without a breakthrough toward a lasting peace agreement, although Qatar said the talks made positive progress and both sides agreed to continue negotiations. Track real-time oil prices, geopolitical risks and expert energy market analysis with InvestingPro. Markets continued to assess the outcome of indirect U.S.-Iran talks in Doha after negotiators concluded two days of technical discussions without a breakthrough toward a lasting peace agreement. The discussions focused on shipping through the Strait of Hormuz and other confidence-building measures, while both sides agreed to continue negotiations, keeping hopes for a diplomatic resolution alive. Although tensions have eased since the recent conflict, traders continue to monitor developments closely, with any disruption to crude flows through the Strait of Hormuz still posing a key risk to global energy supplies. Meanwhile, crude shipments through the Strait of Hormuz climbed above 10 million barrels per day, underscoring the market’s growing confidence that supplies will continue to flow despite lingering geopolitical risk On the supply side, fresh U.S. Energy Information Administration data showed domestic crude production climbed to a record 13.93 million barrels per day in April, reinforcing expectations of abundant global supplies. ANZ said easing geopolitical tensions have reduced supply concerns, although lingering uncertainty in the Middle East continues to provide some underlying support for crude prices. The bank also noted its China Commodity Index rose 0.5%, with the energy component also advancing 0.5%, pointing to resilient underlying commodity demand despite the recent pullback in oil prices. Markets are also assessing expectations that OPEC+ could increase production again in August, alongside upcoming U.S. inventory data and further developments in U.S.-Iran negotiations, for fresh direction on crude prices.
- Gold prices recovered further from a recent eight-month low on Thursday, although gains remained limited amid caution over higher interest rates. Focus now turns to key U.S. labor data due later in the day for more cues on interest rate Bullion saw some bargain buying after logging its worst quarterly drop in 13 years in the June quarter. Federal Reserve Chair Kevin Warsh on Wednesday signaled that the central bank will firmly follow its 2% inflation target and disappoint anyone who expects loose monetary policy. But he largely declined to comment on the central bank’s plans for interest rates, noting that the outlook for higher inflation had somewhat improved since he took office. Still, Warsh’s hardline comments pointed to an increasingly hawkish tilt in the Fed– a notion that has weighed heavily on gold prices in recent months. His comments spurred some overnight gains in the dollar, keeping it close to recent 13-month highs. Markets are pricing in at least one rate hike by the Fed in 2026, amid increasing anxiety over sticky U.S. inflation. High energy prices drove sharp increases in inflation over the past three months. While energy prices have since cooled, markets have remained on edge over persistent inflation, with rising chip prices presenting another risk for price pressures. Higher rates bode poorly for metals, given that they increase the opportunity cost of investing in non-yielding assets like gold. Anxiety over higher rates has been a major weight on gold this year, dragging the yellow metal off its January record highs and even reversing its year-to-date gains. Nonfarm payrolls data for June, due later on Thursday, is also expected to factor into the Fed’s plans for interest rates. Inflation and labor strength are the central bank’s two main considerations in adjusting interest rates. The payrolls data is expected to show some cooling in labor market growth. But nonfarm payrolls have consistently surprised to the upside for the past three months. Strength in the labor market gives the Fed more headroom to hike rates. Still, private payroll data on Wednesday read weaker than expected for June.
|
|
| Intraday RESISTANCE LEVELS |
| 2nd July 2026 |
R1 |
R2 |
R3 |
| GOLD-XAU |
4066-4085-4100 |
4132-4144-4160 |
4188-4200-4214 |
| Silver-XAG |
60.40-61.00 |
61.48-62.10-63.00 |
63.60-64.00 |
| Crude Oil |
67.90-68.50-69.10 |
69.80-70.50-71.10 |
72.00-72.54-73.50 |
| EURO/USD |
1.1405 |
1.1417-1.1426 |
1.1440-1.1465-1.1485 |
| GBP/USD |
1.3300-1.3350 |
1.3390-1.3440-1.3490 |
1.3540-1.3600 1.3640 |
| USD/JPY |
162.50-162.90 |
163.50-164.00 |
164.60-165.00 |
| Intraday SUPPORTS LEVELS |
| 2nd July 2026 |
S1 |
S2 |
S3 |
| GOLD-XAU |
4023-3990-3374 |
3958-3942-3921 |
3900-3884-3870 |
| Silver-XAG |
59.90-59.00-58.40-57.50 |
57.00-56.40-55.60 |
55.00-54.10-53.00 |
| Crude Oil |
67.50-67.00-66.00 |
65.90-65.30-64.50 |
63.90-63.50 |
| EURO/USD |
1.1385-1.1370-1.1355 |
1.1323-1.3190-1.1360 |
1.1310-1.1280-1.1250 |
| GBP/USD |
1.3270-1.3200-1.3180 |
1.3160-1.3135-1.3120 |
1.3100-1.3079 |
| USD/JPY |
161.90-160.70 |
161.00-161.40-160.00 |
159.40-158.70-158.00 |
|
|
| Intra-Day Strategy (2nd July 2026) |
| GOLD-XAU |
Sell on Strength |
| Silver-XAG |
Buy on Dips |
|
| Crude Oil |
Neutral to Sell |
| EUR/USD |
Neutral to Sell |
|
| GBP/USD |
Neutral to Buy |
| USD/JPY |
Neutral to Sell |
|
|
|
|
Gold – XAU
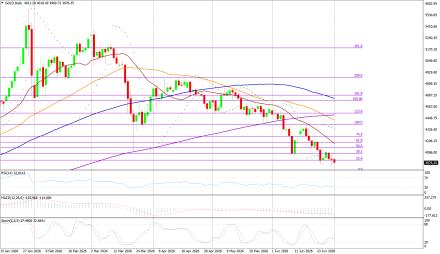
Gold on Wednesday interaday high of US$4115.69/oz and low of $3960.07/oz. God is up by 0.493% at US$4030.98/oz.
Technicals in Focus:
On the daily charts, gold trades higher than 20DMA (2197). If it drops below this level, it could lead to 2,100. The MACD is currently above the zero line and the histograms are showing an increasing trend, indicating that there may be upward movement in the coming sessions. The RSI is currently at 83.04, which is in the overbought region, suggesting there may be selling pressure in the next 2 to 3 sessions. The Stochastic Oscillator is also in the overbought territory but has given a positive crossover, indicating a bullish stance for intraday trades, but rebound in expected in all the overbought indicators.
Trading Strategy: Sell on Strength
Sell below 3990-4200 keeping stop loss closing above 4200, targeting 3774 and 3958-3940-3921-3900. Buy in between 3970-3866 with risk below 3866 targeting 3990-4005-4023-4066-4085 and 4100-4130-4144-4160. |
|
| Intraday Support Levels |
| S1 |
|
|
4023-3990-3374 |
| S2 |
|
|
3958-3942-3921 |
| S3 |
|
|
3900-3884-3870 |
| Intraday Resistance Levels |
| R1 |
|
|
4066-4085-4100 |
| R2 |
|
|
4132-4144-4160 |
| R3 |
|
|
4188-4200-4214 |
| Technical Indicators
|
| Name |
|
Value |
Action |
| 14DRSI |
|
52.916 |
Buy |
| 20-DMA |
|
4800.67 |
Buy |
| 50-DMA |
|
4497.76 |
Buy |
| 100-DMA |
|
4239.36 |
Buy |
| 200-DMA |
|
3800.35 |
Buy |
| STOCH(5,3) |
|
26.933 |
Sell |
| MACD(12,26,9) |
|
150.924 |
Buy |
|
|
|
|
Silver - XAG
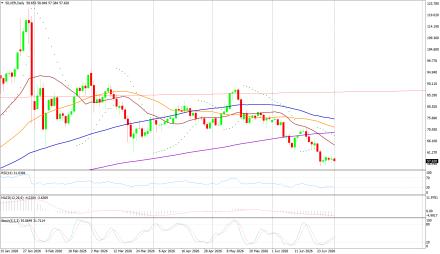
Silver on Wednesday its intraday high of US$60.98/oz and low of US$57.15/oz settle up by 0.726% at US$59.07/oz.
Technicals in Focus:
On daily charts, silver is sustaining above 20MA (25.05), breakage above will lead to 23.73. MACD is below the zero line and histograms are increasing trend, bringing a bullish stance in the upcoming sessions. RSI is in the oversold region, indicating a sell signal for now. The Stochastic Oscillator is in the overbought region and gives a positive crossover to show an upside move for the intraday trade.
Trading Strategy: Buy on Dips
Buy in between 59.90-53.00 targeting 60.40-61.00-61.48-62.10 and 63.00-63.60-64.00 with stop loss should be placed on the breakage below 53.00.
Sell in between 58.40-63.45 with a stop loss above 64.00 targeting 56.40-55.60-55.00-54.10 and 53.00-52.25-51.75-51.00.
|
|
| Intraday Support Levels |
| S1 |
|
|
59.90-59.00-58.40-57.50 |
| S2 |
|
|
57.00-56.40-55.60 |
| S3 |
|
|
55.00-54.10-53.00 |
| Intraday Resistance Levels |
| R1 |
|
|
60.40-61.00 |
| R2 |
|
|
61.48-62.10-63.00 |
| R3 |
|
|
63.60-64.00 |
| TECHNICAL INDICATORS |
| Name |
|
Value |
Action |
| 14DRSI |
|
46.1562 |
Buy |
| 20-DMA |
|
92.99 |
Sell |
| 50-DMA |
|
75.81 |
Sell |
| 100-DMA |
|
62.03 |
Sell |
| 200-DMA |
|
49.29 |
Sell |
| STOCH(5,3) |
|
21.094 |
Buy |
| MACD(12,26,9) |
|
5.262 |
Buy |
|
|
|
|
Oil - WTI
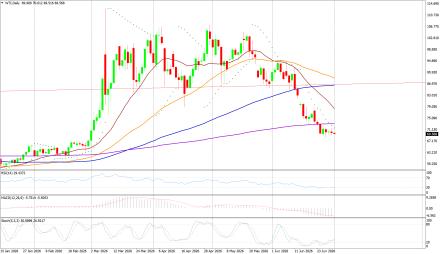
Crude Oil on Wednesday high of US$70.01/bbl, an intraday low of US$67.87/bbl, and settled down by 2.75% to close at US$67.97/bbl.
Technicals in Focus:
On daily charts, oil is sustaining above its 100DMA i.e. 75.37, a support level, and breakage above will call for 77.48. MACD is above the zero line and histograms are in increasing mode will bring a bullish stance in the upcoming sessions. The Stochastic Oscillator is in the overbought region, giving a negative crossover to confirm a bearish stance; while the RSI is in the neutral region, more upsides can be expected to reach the overbought region, which is highly probable.
Trading Strategy: Neutral to Sell
Sell in between 67.90-75.90 with stop loss at 76.00 targeting 69.10-68.50-67.90-67.00 and 65.90-65.30-64.50.
Buy above 67.50-75.90 with risk daily closing below 76.00, targeting 67.90-68.50-69.10-69.80 and 70.50-71.10-72.00-72.54 and 73.50-74.10-74.90-75.90.
|
|
| Intraday Support Levels |
| S1 |
|
|
67.50-67.00-66.00 |
| S2 |
|
|
65.90-65.30-64.50 |
| S3 |
|
|
63.90-63.50 |
| Intraday Resistance Levels |
| R1 |
|
|
67.90-68.50-69.10 |
| R2 |
|
|
69.80-70.50-71.10 |
| R3 |
|
|
72.00-72.54-73.50 |
| TECHNICAL INDICATORS |
| Name |
|
Value |
Action |
| 14DRSI |
|
29.346 |
Sell |
| 20-DMA |
|
67.35 |
Sell |
| 50-DMA |
|
69.06 |
Sell |
| 100-DMA |
|
70.28 |
Sell |
| 200-DMA |
|
71.85 |
Sell |
| STOCH(5,3) |
|
16.166 |
Sell |
| MACD(12,26,9) |
|
-1.306 |
Buy |
|
|
|
|
EUR/USD
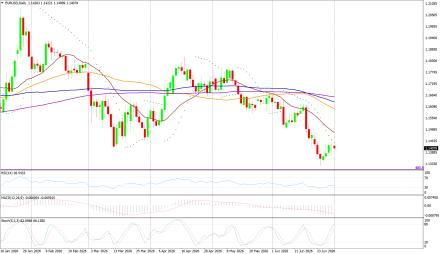
EUR/USD on Wednesday made an intraday low of US$1.1361/EUR, a high of US$1.1422/EUR, and settled down by 0.385% to close at US$1.1376/EUR.
Technicals in Focus:
On daily charts, prices are sustaining above 100DMA (1.1661), which becomes immediate support, a break below will target 1.1695. MACD is above the zero line and histograms are increasing mode, bringing a bullish view. Stochastic is in oversold territory, giving negative crossovers to the bullish outlook for intraday. 14D RSI is currently in a neutral region and giving no directions to consider right now.
Trading Strategy: Neutral to Sell
Sell below 1.1410-1.1520, targeting 1.1370-1.1385-1.1405-1.1417 and 1.1426-1.1440-1.1465-1.1520 with stop-loss at daily closing above 1.1520.
Buy above 1.1385-1.1250 with risk below 1.1250 targeting 1.1370-1.1385-1.1405-1.1426 and 1.1440-1.1465-1.1485-1.1590.
|
|
| Intraday Support Levels |
| S1 |
|
|
1.1385-1.1370-1.1355 |
| S2 |
|
|
1.1323-1.3190-1.1360 |
| S3 |
|
|
1.1310-1.1280-1.1250 |
| Intraday Resistance Levels |
| R1 |
|
|
1.1405 |
| R2 |
|
|
1.1417-1.1426 |
| R3 |
|
|
1.1440-1.1465-1.1485 |
| TECHNICAL INDICATORS |
| Name |
|
Value |
Action |
| 14DRSI |
|
48.897 |
Buy |
| 20-DMA |
|
1.1695 |
Sell |
| 50-DMA |
|
1.1656 |
Buy |
| 100-DMA |
|
1.1661 |
Buy |
| 200-DMA |
|
1.1585 |
Buy |
| STOCH(5,3) |
|
55.688 |
Buy |
| MACD(12,26,9) |
|
-0.0013 |
|
|
|
|
|
GBP/USD
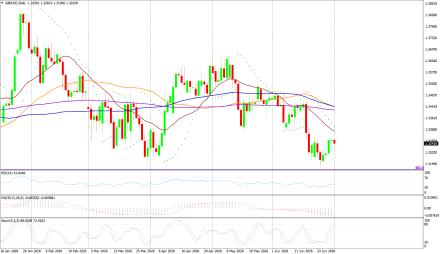
GBP/USD on Wednesday made a intraday low of US$1.3218/GBP, a high of US$1.3291/GBP, and settled the day up by 0.107% to close at US$1.3273/GBP
Technicals in Focus:
On daily charts, prices are sustaining above 50DMA (1.2674) is becoming a support level. 14-D RSI is currently in a neutral region and direction is difficult to predict on an RSI basis. The Stochastic Oscillator is in oversold territory and gives a positive crossover to confirm a bullish stance. MACD is above the zero line, but histograms are increasing leading to movement
Trading Strategy: Neutral to Buy
Based on the charts and explanations above; buy between 1.3180-1.3079 with a target of 1.3270-1.3350-1.3390-1.3436 and 1.3500-1.3570-1.3600-1.3640-1.3690 with a stop loss closing below 1.3150.
Sell in between 1.3270-1.3820 with targets at 1.3210-1.3190-1.3150-1.3135 and 1.3120-1.3100-1.3079 with a stop loss of 1.3900.
|
|
| Intraday Support Levels |
| S1 |
|
|
1.3270-1.3200-1.3180 |
| S2 |
|
|
1.3160-1.3135-1.3120 |
| S3 |
|
|
1.3100-1.3079 |
| Intraday Resistance Levels |
| R1 |
|
|
1.3300-1.3350 |
| R2 |
|
|
1.3390-1.3440-1.3490 |
| R3 |
|
|
1.3540-1.3600 1.3640 |
| TECHNICAL INDICATORS |
| Name |
|
Value |
Action |
| 14DRSI |
|
46.905 |
Buy |
| 20-DMA |
|
1.2932 |
Buy |
| 50-DMA |
|
1.2736 |
Buy |
| 100-DMA |
|
1.2629 |
Buy |
| 200-DMA |
|
1.2811 |
Buy |
| STOCH(5,3) |
|
9.458 |
Buy |
| MACD(12,26,9) |
|
-0.003 |
Sell |
|
|
|
|
USD/JPY
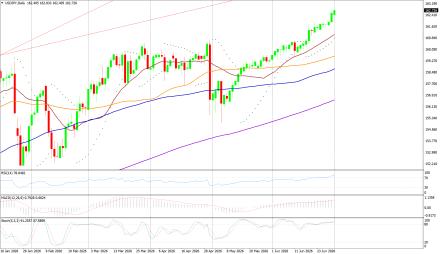
USD/JPY on Wednesday made an intra‐day low of JPY162.28/USD an intraday high of 162.83/USD, and settled the day up by 0.006% at JPY162.57/USD
Technicals in Focus:
In daily charts, JPY is sustaining above 100DMA (152.35), major support on the daily chart. 14-D RSI is currently in the overbought region and chances of downward are expected based on RSI. MACD is above the zero line but histograms are decreasing mode which might lead to downward movement. The Stochastic Oscillator is in overbought territory and signaling to sell as it has given a negative crossover to confirm a bearish stance.
Trading Strategy: Neutral to Sell
Sell below 162.70-163.10 with risk above 163.10 targeting 158.70-158.10-157.00 and 156.60-153.00-152.65-152.10.
Long positions above 161.90-152.00 with targets of 159.40-160.00 and 160.90-161.60-162.20-162.60 with stops below 148.00.
|
|
| Intraday Support Levels |
| S1 |
|
|
161.90-160.70 |
| S2 |
|
|
161.00-161.40-160.00 |
| S3 |
|
|
159.40-158.70-158.00 |
| INTRADAY RESISTANCE LEVELS |
| R1 |
|
|
162.50-162.90 |
| R2 |
|
|
163.50-164.00 |
| R3 |
|
|
164.60-165.00 |
| TECHNICAL INDICATORS |
| Name |
|
Value |
Action |
| 14DRSI |
|
41.14 |
Buy |
| 20-DMA |
|
148.91 |
Buy |
| 50-DMA |
|
150.24 |
Buy |
| 100-DMA |
|
152.53 |
Buy |
| 200-DMA |
|
151.18 |
Buy |
| STOCH(9,6) |
|
93.662 |
Sell |
| MACD(12,26,9) |
|
0.683 |
Sell |
|
|
|
 |