 |
|
|
Daily Market Lookup
- Most Asian currencies weakened on Monday, with the Japanese yen remaining close to 40-year lows and keeping markets on guard for any more potential government intervention. The dollar firmed slightly after falling from 13-month highs last week, after a soft labor report sparked questions over just how much headroom the Federal Reserve has to hike interest rates this year. Asian currencies had gained some ground after the labor report, which was released on Thursday. But they struggled to hold gains amid persistent concerns over sticky U.S. inflation, which could keep the Fed hawkish in the coming months. Get more insights on the dollar and the Fed by subscribing to InvestingPr The Japanese yen’s USD/JPY pair rose 0.3% to 161.82 yen, remaining close to levels last seen in 1986. The pair had fallen sharply after the weak U.S. labor data last week, but rebounded just as quickly on Friday. The yen remained under continued pressure from a wide gulf in U.S.-Japanese interest rates, while doubts over more government spending also weighed. USDJPY remained well above 160 yen– a level that has in the past attracted heavy government intervention. Officials were seen offering verbal warnings on speculation against the yen in recent weeks, keeping markets largely on guard over any intervention. Weakness in the yen came even as the Bank of Japan hiked interest rates in June and warned of more hawkish moves The greenback was pressured chiefly by softer-than-expected nonfarm payrolls data for June, which raised questions over just how much headroom the Fed has to hike rates. Still, losses in the dollar were limited by continued uncertainty over a hawkish Fed, especially as the central bank’s June meeting showed policymakers growing increasingly in favor of higher rates amid sticky inflation. The minutes of the central bank’s June meeting are due this week, although it remained unclear just how much insight they will provide, given that new Fed Chair Kevin Warsh called for an overhaul of the central bank’s communication with the public.
- Gold prices rose in Asian trade on Monday, aided by a softer dollar as investors pared expectations that the Federal Reserve will hike interest rates this year. The yellow metal extended its recovery after rebounding from eight-month lows last week, while the dollar fell to near two-week lows. Gains in gold came following a weak nonfarm payrolls print on Thursday, which spurred a sharp scaling back in bets that the Federal Reserve will have enough headroom to raise interest rates this year. Inflation and the labor market are the central bank’s two biggest considerations for adjusting rates. Sticky U.S. inflation is expected to keep the central bank leaning hawkish in the coming months. Higher rates bode poorly for gold, given that they increase the opportunity cost of investing in non-yielding assets over government debt. This notion was a major weight on gold this year, dragging the yellow metal well off its January record highs. The minutes of Fed’s June meeting are due this week and are expected to offer more insight on the path of interest rates. While bullion did recover last week, overall gains were still limited by the prospect of sticky inflation keeping the Fed hawkish. Falling oil prices did help soothe some concerns over sticky inflation. But markets were on guard over the inflationary effects of the artificial intelligence industry, while rising temperatures across the globe are also expected to factor into higher price pressures.
- Oil prices inched lower on Monday after OPEC+ agreed to further increase its output targets from August while exports from key producers via the Strait of Hormuz are recovering, potentially adding to global supplies. Brent crude futures fell 34 cents, or 0.47%, to $71.78 a barrel by 0408 GMT after settling 0.45% higher on Friday. U.S. West Texas Intermediate crude was at $68.49 a barrel, down 20 cents, or 0.29%. There was no settlement for WTI on Friday as U.S. markets were closed ahead of the Independence Day holiday on Saturday. Both contracts were little changed last week, after mostly falling over the past few weeks, as investors kept a close eye on talks between the United States and Iran over the fate of shipping through the Strait of Hormuz while keeping tabs on the recovery in Gulf oil exports. The Organization of the Petroleum Exporting Countries and their allies including Russia agreed on Sunday to further increase output targets by 188,000 barrels per day from August, on top of similar increases for June and July. However, the increase has remained largely on paper because of the U.S.-Israeli war with Iran, which closed the Strait of Hormuz to tanker traffic for key OPEC producers, including Saudi Arabia, Kuwait and Iraq, capping their output. Gulf members have begun reviving supplies shut during the Iran war and are increasing exports. OPEC oil output in June rose by 3.3 million barrels per day month-on-month to 19.43 million bpd, a Reuters survey found, recovering from its lowest in more than two decades. Gulf oil exports in June jumped more than 3 million barrels from May to exceed 10 million barrels per day, although the volume remained 40% below pre-war levels, data showed. In addition, oil shipments from Russia’s western ports hit a record high in June and are expected to maintain that level in July as its refineries have been damaged in drone attacks by Ukraine that have forced Moscow to boost crude exports, industry sources said.
|
|
| Intraday RESISTANCE LEVELS |
| 6th July 2026 |
R1 |
R2 |
R3 |
| GOLD-XAU |
4188-4200-4214 |
4268-4280-4294 |
4310-4346-4385 |
| Silver-XAG |
62.10-63.20 |
63.60-64.00-64.60 |
66.95-67.50-68.40 |
| Crude Oil |
68.60-69.10 |
69.80-70.50-71.10 |
72.00-72.54-73.50 |
| EURO/USD |
1.1440-1.1465-1.1485 |
1.1510-1.1550-1.1588 |
1.1610-1.1640 |
| GBP/USD |
1.3350 |
1.3390-1.3440-1.3490 |
1.3540-1.3600 1.3640 |
| USD/JPY |
162.50-162.90 |
163.50-164.00 |
164.60-165.00 |
| Intraday SUPPORTS LEVELS |
| 6th July 2026 |
S1 |
S2 |
S3 |
| GOLD-XAU |
4160-4144-4132 |
4100-4085-4066 |
4023-3990-3958 |
| Silver-XAG |
61.48-61.00-60.40-59.90 |
59.00-58.40-57.50 |
57.00-56.40-55.60 |
| Crude Oil |
67.90-67.50-67.00-66.00 |
65.90-65.30-64.50 |
63.90-63.50 |
| EURO/USD |
1.1417-1.1405-1.1385 |
1.1370-1.1355-1.1323 |
1.3190-1.1360-1.1310 |
| GBP/USD |
1.3300-1.3270-1.3200 |
1.3180-1.3160-1.3135 |
1.3120-1.3100-1.3079 |
| USD/JPY |
161.90-160.70 |
161.00-161.40-160.00 |
159.40-158.70-158.00 |
|
|
| Intra-Day Strategy (6th July 2026) |
| GOLD-XAU |
Sell on Strength |
| Silver-XAG |
Buy on Dips |
|
| Crude Oil |
Neutral to Sell |
| EUR/USD |
Neutral to Sell |
|
| GBP/USD |
Neutral to Buy |
| USD/JPY |
Neutral to Sell |
|
|
|
|
Gold – XAU
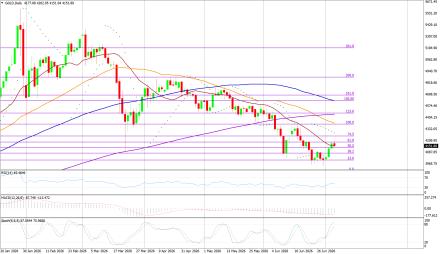
Gold on Friday interaday high of US$4195.34/oz and low of $4121.03/oz. God is up by 1.209% at US$4174.84/oz.
Technicals in Focus:
On the daily charts, gold trades higher than 20DMA (2197). If it drops below this level, it could lead to 2,100. The MACD is currently above the zero line and the histograms are showing an increasing trend, indicating that there may be upward movement in the coming sessions. The RSI is currently at 83.04, which is in the overbought region, suggesting there may be selling pressure in the next 2 to 3 sessions. The Stochastic Oscillator is also in the overbought territory but has given a positive crossover, indicating a bullish stance for intraday trades, but rebound in expected in all the overbought indicators.
Trading Strategy: Sell on Strength
Sell below 4188-4400 keeping stop loss closing above 4400, targeting 4160-4144-4132-4100 and 4066-4023-3990-3974-3958. Buy in between 4160-3958 with risk below 3866 targeting 4188-4200-4224-4268 and 4280-4294-4310-4346-4385. |
|
| Intraday Support Levels |
| S1 |
|
|
4160-4144-4132 |
| S2 |
|
|
4100-4085-4066 |
| S3 |
|
|
4023-3990-3958 |
| Intraday Resistance Levels |
| R1 |
|
|
4188-4200-4214 |
| R2 |
|
|
4268-4280-4294 |
| R3 |
|
|
4310-4346-4385 |
| Technical Indicators
|
| Name |
|
Value |
Action |
| 14DRSI |
|
52.916 |
Buy |
| 20-DMA |
|
4800.67 |
Buy |
| 50-DMA |
|
4497.76 |
Buy |
| 100-DMA |
|
4239.36 |
Buy |
| 200-DMA |
|
3800.35 |
Buy |
| STOCH(5,3) |
|
26.933 |
Sell |
| MACD(12,26,9) |
|
150.924 |
Buy |
|
|
|
|
Silver - XAG
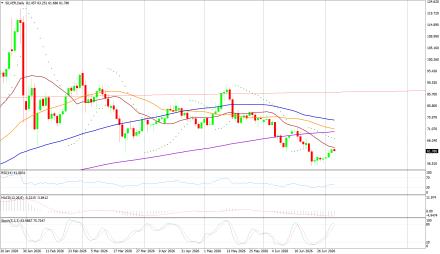
Silver on Friday its intraday high of US$62.87/oz and low of US$60.88/oz settle up by 2.25% at US$62.37/oz.
Technicals in Focus:
On daily charts, silver is sustaining above 20MA (25.05), breakage above will lead to 23.73. MACD is below the zero line and histograms are increasing trend, bringing a bullish stance in the upcoming sessions. RSI is in the oversold region, indicating a sell signal for now. The Stochastic Oscillator is in the overbought region and gives a positive crossover to show an upside move for the intraday trade.
Trading Strategy: Buy on Dips
Buy in between 61.48-53.00 targeting 61.48-62.10 and 63.00-63.60-64.00 with stop loss should be placed on the breakage below 53.00.
Sell in between 62.10-63.45 with a stop loss above 64.00 targeting 56.40-55.60-55.00-54.10 and 53.00-52.25-51.75-51.00.
|
|
| Intraday Support Levels |
| S1 |
|
|
61.48-61.00-60.40-59.90 |
| S2 |
|
|
59.00-58.40-57.50 |
| S3 |
|
|
57.00-56.40-55.60 |
| Intraday Resistance Levels |
| R1 |
|
|
62.10-63.20 |
| R2 |
|
|
63.60-64.00-64.60 |
| R3 |
|
|
66.95-67.50-68.40 |
| TECHNICAL INDICATORS |
| Name |
|
Value |
Action |
| 14DRSI |
|
46.1562 |
Buy |
| 20-DMA |
|
92.99 |
Sell |
| 50-DMA |
|
75.81 |
Sell |
| 100-DMA |
|
62.03 |
Sell |
| 200-DMA |
|
49.29 |
Sell |
| STOCH(5,3) |
|
21.094 |
Buy |
| MACD(12,26,9) |
|
5.262 |
Buy |
|
|
|
|
Oil - WTI
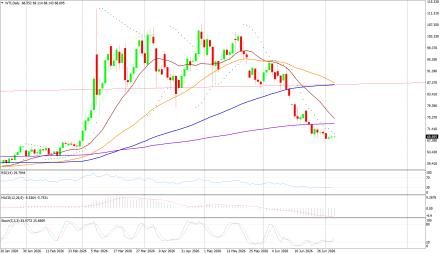
Crude Oil on Friday high of US$69.22/bbl, an intraday low of US$68.04/bbl, and settled up by 0.342% to close at US$68.63/bbl.
Technicals in Focus:
On daily charts, oil is sustaining above its 100DMA i.e. 75.37, a support level, and breakage above will call for 77.48. MACD is above the zero line and histograms are in increasing mode will bring a bullish stance in the upcoming sessions. The Stochastic Oscillator is in the overbought region, giving a negative crossover to confirm a bearish stance; while the RSI is in the neutral region, more upsides can be expected to reach the overbought region, which is highly probable
Trading Strategy: Neutral to Sell
Sell in between 68.60-75.90 with stop loss at 76.00 targeting 69.10-68.50-67.90-67.00 and 65.90-65.30-64.50.
Buy above 67.90-75.90 with risk daily closing below 76.00, targeting 67.90-68.50-69.10-69.80 and 70.50-71.10-72.00-72.54 and 73.50-74.10-74.90-75.90.
|
|
| Intraday Support Levels |
| S1 |
|
|
67.90-67.50-67.00-66.00 |
| S2 |
|
|
65.90-65.30-64.50 |
| S3 |
|
|
63.90-63.50 |
| Intraday Resistance Levels |
| R1 |
|
|
68.60-69.10 |
| R2 |
|
|
69.80-70.50-71.10 |
| R3 |
|
|
72.00-72.54-73.50 |
| TECHNICAL INDICATORS |
| Name |
|
Value |
Action |
| 14DRSI |
|
29.346 |
Sell |
| 20-DMA |
|
67.35 |
Sell |
| 50-DMA |
|
69.06 |
Sell |
| 100-DMA |
|
70.28 |
Sell |
| 200-DMA |
|
71.85 |
Sell |
| STOCH(5,3) |
|
16.166 |
Sell |
| MACD(12,26,9) |
|
-1.306 |
Buy |
|
|
|
|
EUR/USD
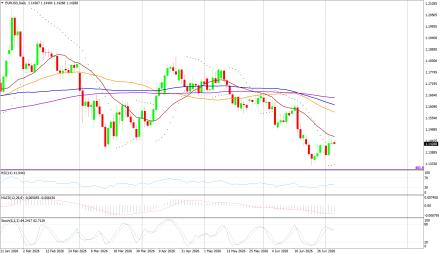
EUR/USD on Friday made an intraday low of US$1.1419/EUR, a high of US$1.1461/EUR, and settled up by 0.0323% to close at US$1.1433/EUR.
Technicals in Focus:
On daily charts, prices are sustaining above 100DMA (1.1661), which becomes immediate support, a break below will target 1.1695. MACD is above the zero line and histograms are increasing mode, bringing a bullish view. Stochastic is in oversold territory, giving negative crossovers to the bullish outlook for intraday. 14D RSI is currently in a neutral region and giving no directions to consider right now.
Trading Strategy: Neutral to Sell
Sell below 1.1410-1.1520, targeting 1.1370-1.1385-1.1405-1.1417 and 1.1426-1.1440-1.1465-1.1520 with stop-loss at daily closing above 1.1520.
Buy above 1.1385-1.1250 with risk below 1.1250 targeting 1.1370-1.1385-1.1405-1.1426 and 1.1440-1.1465-1.1485-1.1590.
|
|
| Intraday Support Levels |
| S1 |
|
|
1.1417-1.1405-1.1385 |
| S2 |
|
|
1.1370-1.1355-1.1323 |
| S3 |
|
|
1.3190-1.1360-1.1310 |
| Intraday Resistance Levels |
| R1 |
|
|
1.1440-1.1465-1.1485 |
| R2 |
|
|
1.1510-1.1550-1.1588 |
| R3 |
|
|
1.1610-1.1640 |
| TECHNICAL INDICATORS |
| Name |
|
Value |
Action |
| 14DRSI |
|
48.897 |
Buy |
| 20-DMA |
|
1.1695 |
Sell |
| 50-DMA |
|
1.1656 |
Buy |
| 100-DMA |
|
1.1661 |
Buy |
| 200-DMA |
|
1.1585 |
Buy |
| STOCH(5,3) |
|
55.688 |
Buy |
| MACD(12,26,9) |
|
-0.0013 |
|
|
|
|
|
GBP/USD
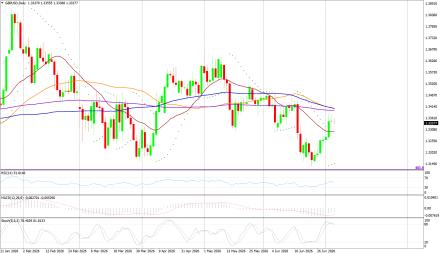
GBP/USD on Friday made a intraday low of US$1.3333/GBP, a high of US$1.3380/GBP, and settled the day up by 0.107% to close at US$1.3345/GBP.
Technicals in Focus:
On daily charts, prices are sustaining above 50DMA (1.2674) is becoming a support level. 14-D RSI is currently in a neutral region and direction is difficult to predict on an RSI basis. The Stochastic Oscillator is in oversold territory and gives a positive crossover to confirm a bullish stance. MACD is above the zero line, but histograms are increasing leading to movement.
Trading Strategy: Neutral to Buy
Based on the charts and explanations above; buy between 1.3180-1.3079 with a target of 1.3270-1.3350-1.3390-1.3436 and 1.3500-1.3570-1.3600-1.3640-1.3690 with a stop loss closing below 1.3150.
Sell in between 1.3270-1.3820 with targets at 1.3210-1.3190-1.3150-1.3135 and 1.3120-1.3100-1.3079 with a stop loss of 1.3900.
|
|
| Intraday Support Levels |
| S1 |
|
|
1.3300-1.3270-1.3200 |
| S2 |
|
|
1.3180-1.3160-1.3135 |
| S3 |
|
|
1.3120-1.3100-1.3079 |
| Intraday Resistance Levels |
| R1 |
|
|
1.3350 |
| R2 |
|
|
1.3390-1.3440-1.3490 |
| R3 |
|
|
1.3540-1.3600 1.3640 |
| TECHNICAL INDICATORS |
| Name |
|
Value |
Action |
| 14DRSI |
|
46.905 |
Buy |
| 20-DMA |
|
1.2932 |
Buy |
| 50-DMA |
|
1.2736 |
Buy |
| 100-DMA |
|
1.2629 |
Buy |
| 200-DMA |
|
1.2811 |
Buy |
| STOCH(5,3) |
|
9.458 |
Buy |
| MACD(12,26,9) |
|
-0.003 |
Sell |
|
|
|
|
USD/JPY
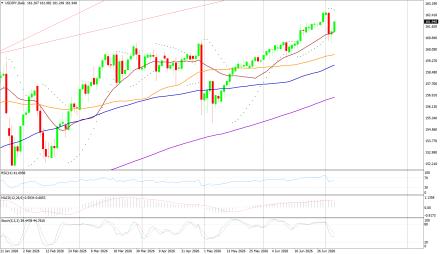
USD/JPY on Tuesday made an intra‐day low of JPY160.47/USD an intraday high of 161.51/USD, and settled the day up by 0.128% at JPY161.27/USD
Technicals in Focus:
In daily charts, JPY is sustaining above 100DMA (152.35), major support on the daily chart. 14-D RSI is currently in the overbought region and chances of downward are expected based on RSI. MACD is above the zero line but histograms are decreasing mode which might lead to downward movement. The Stochastic Oscillator is in overbought territory and signaling to sell as it has given a negative crossover to confirm a bearish stance.
Trading Strategy: Neutral to Sell
Sell below 162.70-163.10 with risk above 163.10 targeting 158.70-158.10-157.00 and 156.60-153.00-152.65-152.10.
Long positions above 161.90-152.00 with targets of 159.40-160.00 and 160.90-161.60-162.20-162.60 with stops below 148.00.
|
|
| Intraday Support Levels |
| S1 |
|
|
161.90-160.70 |
| S2 |
|
|
161.00-161.40-160.00 |
| S3 |
|
|
159.40-158.70-158.00 |
| INTRADAY RESISTANCE LEVELS |
| R1 |
|
|
162.50-162.90 |
| R2 |
|
|
163.50-164.00 |
| R3 |
|
|
164.60-165.00 |
| TECHNICAL INDICATORS |
| Name |
|
Value |
Action |
| 14DRSI |
|
41.14 |
Buy |
| 20-DMA |
|
148.91 |
Buy |
| 50-DMA |
|
150.24 |
Buy |
| 100-DMA |
|
152.53 |
Buy |
| 200-DMA |
|
151.18 |
Buy |
| STOCH(9,6) |
|
93.662 |
Sell |
| MACD(12,26,9) |
|
0.683 |
Sell |
|
|
|
 |