 |
|
|
Daily Market Lookup
- The U.S. dollar was little changed on Monday, after posting its worst day since the end of April in the previous session. Monetary policy outlook remained the key focus for currency market participants. Meanwhile, the euro was mostly flat after the release of two key economic indicators, while the Japanese yen remained at a 40-year low deep in intervention territory. The dollar index on Thursday slid 0.5% after a softer-than-expected June nonfarm payrolls report. The data was received favorably by traders as it meant that the labor market was resilient but not too strong, giving the Fed some breathing room to potentially keep interest rates on hold and not tighten policy. Higher rate environments generally tend to strengthen the greenback. The Fed under new chair Kevin Warsh last month signaled that it would give up forward guidance and focus solely on combating inflation, as the labor market remained steady. Warsh reiterated his stance of not giving forward guidance in public comments in Portugal last week. The minutes of the Fed’s June meeting will now be looked at on Wednesday for further insight into the thinking of policymakers, half of whom indicated that rate hikes could be warranted this year. Warsh in Portugal also said that inflation risks had come down. With oil prices having slid back to levels before the start of the U.S.-Israeli joint assault on Iran at the end of February, inflationary concerns have eased Looking at other major currencies, the euro was a smidge higher at $1.1441 following data on Eurozone industrial producer prices and retail sales As per first estimates from Eurostat, industrial producer prices rose 0.2% M/M in May, moderating from April’s 0.7%. But on a Y/Y basis, prices jumped 5.9% from 5% in April, driven mainly by a 14% surge in energy prices. Separately, retail sales in the Eurozone ticked up 0.2% in May, a marked improvement from April’s fall of 0.3%. The European Central Bank (ECB) last month became the first major global reserve bank to hike interest rates in reaction to the inflationary shock that emerged from the oil supply crisis sparked by the Middle East conflict. But with Eurozone annual inflation now expected to fall in June from May, and with oil prices having slumped, the case for another rate hike is growing more unlikely. Investors will be hearing from ECB President Christine Lagarde and chief economist Philip Lane later this week. Elsewhere, the Japanese yen weakened against the dollar on Monday, with the USD/JPY pair last up 0.4% to 162.04. The currency has languished at a 40-year low against the greenback, though it saw a sharp bout of strengthening last Thursday after the jobs report dented Fed rate hike expectations. The yen has now remained well above 160 since mid-June, a level that has in the past attracted heavy intervention from Tokyo. Officials were seen offering verbal warnings on speculation against the yen in recent weeks, keeping markets largely on guard for any intervention. Weakness in the yen has persisted even as the Bank of Japan hiked interest rates in June and warned of more hawkish moves
- Gold prices fell in Asian trade on Tuesday, cutting short a recent recovery as markets remained uncertain over U.S. interest rates and inflation. Reports of a vessel being struck in the Strait of Hormuz revived concerns over energy market disruptions and their effects on inflation, keeping the dollar upbeat and pressuring metal markets. Focus this week is squarely on the minutes of the Federal Reserve’s June meeting, which are set to offer more cues on the central bank’s plans for interest rates. But focus will also be on the tone of the Fed’s communications under new Chair Kevin Warsh, who has called for a tapering in the central bank’s messaging to the public. Warsh had recently warned that the Fed remained committed to its 2% annual target for inflation, keeping markets on edge over any potential tightening in monetary policy. Gold had risen sharply last week, recovering from its weakest levels for the year after softer-than-expected payrolls data helped ease some concerns over rising interest rates. The dollar also fell from 13-month highs following the print But markets still remained cautious over sticky inflation driving up rates this year, keeping the dollar underpinned and gold close to its weakest levels for the year.
- Oil prices edged higher on Tuesday as renewed security concerns in the Strait of Hormuz offset expectations of stronger global crude supplies following Saudi Arabia’s steep price cuts for Asian buyers and OPEC+’s latest output increase. A tanker transiting near the Strait of Hormuz was reportedly struck by a projectile off the coast of Oman, causing a fire but no casualties. The incident underscored that, although vessel traffic through the strategic waterway continues to recover following the U.S.-Iran ceasefire, security concerns remain elevated. The Strait has reopened to commercial traffic, including recent transits by Japan-linked vessels, but shipping volumes remain below pre-conflict levels. Traders continue to monitor whether isolated security incidents could slow the normalization of Gulf crude exports and keep a modest geopolitical premium embedded in oil prices. While Saudi Arabia and OPEC+ have reinforced expectations of a better-supplied crude market, a reported strike on a tanker near the Strait of Hormuz highlighted that shipping risks have yet to fully disappear, preventing a sharper pullback in prices. The broader market remains focused on rising supply. Saudi Aramco cut the August official selling price of its flagship Arab Light crude for Asia to a discount against the regional benchmark for the first time since 2020, highlighting intensifying competition for market share as Gulf exports recover. The move follows OPEC+’s decision over the weekend to raise August production targets, reinforcing expectations that more barrels will return to the market as regional conditions normalize. ANZ said product markets remain considerably tighter than crude markets, with firm refining margins and relatively lean fuel inventories helping cushion the downside for oil even as crude supply improves. However, the bank noted that recovering exports and rising Gulf production continue to point to a looser crude market over the coming months. Markets are now awaiting the U.S. Energy Information Administration’s Short-Term Energy Outlook for updated production and demand forecasts, while traders continue to monitor shipping conditions through the Strait of Hormuz and the pace at which additional OPEC+ supply reaches global markets.
|
|
| Intraday RESISTANCE LEVELS |
| 7th July 2026 |
R1 |
R2 |
R3 |
| GOLD-XAU |
4132-4144-4160-4188 |
4200-4214-4268 |
4280-4294-4310 |
| Silver-XAG |
61.48-62.10-63.20 |
63.60-64.00-64.60 |
66.95-67.50-68.40 |
| Crude Oil |
69.10-69.80 |
70.50-71.10 |
72.00-72.54-73.50 |
| EURO/USD |
1.1440-1.1465-1.1485 |
1.1510-1.1550-1.1588 |
1.1610-1.1640 |
| GBP/USD |
1.3390-1.3440-1.3490 |
1.3540-1.3600 1.3640 |
1.3700 |
| USD/JPY |
161.90-162.50-162.90 |
163.50-164.00 |
164.60-165.00 |
| Intraday SUPPORTS LEVELS |
| 7th July 2026 |
S1 |
S2 |
S3 |
| GOLD-XAU |
4100-4085-4066 |
4023-3990-3958 |
3942-3920-3900 |
| Silver-XAG |
61.00-60.40-59.90 |
59.00-58.40-57.50 |
57.00-56.40-55.60 |
| Crude Oil |
68.60-67.90-67.50- |
67.00-65.90-65.30 |
64.50-63.90-63.50 |
| EURO/USD |
1.1417-1.1405-1.1385 |
1.1370-1.1355-1.1323 |
1.3190-1.1360-1.1310 |
| GBP/USD |
1.3350-1.3300-1.3270-1.3200 |
1.3180-1.3160-1.3135 |
1.3120-1.3100-1.3079 |
| USD/JPY |
161.40-161.00-160.70 |
160.00-159.40 |
158.70-158.00 |
|
|
| Intra-Day Strategy (7th July 2026) |
| GOLD-XAU |
Sell on Strength |
| Silver-XAG |
Buy on Dips |
|
| Crude Oil |
Neutral to Sell |
| EUR/USD |
Neutral to Sell |
|
| GBP/USD |
Neutral to Buy |
| USD/JPY |
Neutral to Sell |
|
|
|
|
Gold – XAU
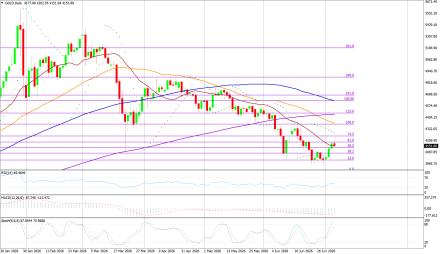
Gold on Monday interaday high of US$4202.95/oz and low of $4165.15/oz. God is up by 0.304% at US$4165.15/oz.
Technicals in Focus:
On the daily charts, gold trades higher than 20DMA (2197). If it drops below this level, it could lead to 2,100. The MACD is currently above the zero line and the histograms are showing an increasing trend, indicating that there may be upward movement in the coming sessions. The RSI is currently at 83.04, which is in the overbought region, suggesting there may be selling pressure in the next 2 to 3 sessions. The Stochastic Oscillator is also in the overbought territory but has given a positive crossover, indicating a bullish stance for intraday trades, but rebound in expected in all the overbought indicators.
Trading Strategy: Sell on Strength
Sell below 4144-4400 keeping stop loss closing above 4400, targeting 4100 and 4066-4023-3990-3974-3958. Buy in between 4100-3958 with risk below 3866 targeting 4144-4160-4188-4200-4224 and 4268-4280-4294-4310. |
|
| Intraday Support Levels |
| S1 |
|
|
4100-4085-4066 |
| S2 |
|
|
4023-3990-3958 |
| S3 |
|
|
3942-3920-3900 |
| Intraday Resistance Levels |
| R1 |
|
|
4132-4144-4160-4188 |
| R2 |
|
|
4200-4214-4268 |
| R3 |
|
|
4280-4294-4310 |
| Technical Indicators
|
| Name |
|
Value |
Action |
| 14DRSI |
|
52.916 |
Buy |
| 20-DMA |
|
4800.67 |
Buy |
| 50-DMA |
|
4497.76 |
Buy |
| 100-DMA |
|
4239.36 |
Buy |
| 200-DMA |
|
3800.35 |
Buy |
| STOCH(5,3) |
|
26.933 |
Sell |
| MACD(12,26,9) |
|
150.924 |
Buy |
|
|
|
|
Silver - XAG
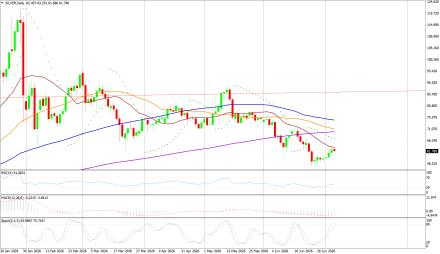
Silver on Monday its intraday high of US$63.25/oz and low of US$61.34/oz settle up by 0.69% at US$62.02/oz.
Technicals in Focus:
On daily charts, silver is sustaining above 20MA (25.05), breakage above will lead to 23.73. MACD is below the zero line and histograms are increasing trend, bringing a bullish stance in the upcoming sessions. RSI is in the oversold region, indicating a sell signal for now. The Stochastic Oscillator is in the overbought region and gives a positive crossover to show an upside move for the intraday trade.
Trading Strategy: Buy on Dips
Buy in between 61.00-53.00 targeting 61.48-62.10-63.00-63.60 and 64.00-64.60-65.20-66.40-66.95 with stop loss should be placed on the breakage below 53.00.
Sell in between 61.48-63.45 with a stop loss above 64.00 targeting 61.00-60.40-59.90-59.00 and 58.40-57.50-56.40-55.60-55.00-54.10.
|
|
| Intraday Support Levels |
| S1 |
|
|
61.00-60.40-59.90 |
| S2 |
|
|
59.00-58.40-57.50 |
| S3 |
|
|
57.00-56.40-55.60 |
| Intraday Resistance Levels |
| R1 |
|
|
61.48-62.10-63.20 |
| R2 |
|
|
63.60-64.00-64.60 |
| R3 |
|
|
66.95-67.50-68.40 |
| TECHNICAL INDICATORS |
| Name |
|
Value |
Action |
| 14DRSI |
|
46.1562 |
Buy |
| 20-DMA |
|
92.99 |
Sell |
| 50-DMA |
|
75.81 |
Sell |
| 100-DMA |
|
62.03 |
Sell |
| 200-DMA |
|
49.29 |
Sell |
| STOCH(5,3) |
|
21.094 |
Buy |
| MACD(12,26,9) |
|
5.262 |
Buy |
|
|
|
|
Oil - WTI
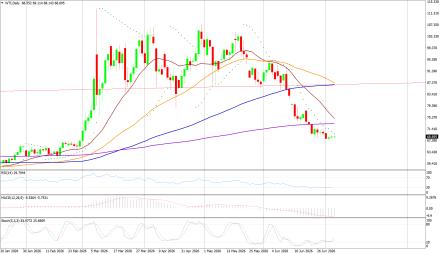
Crude Oil on Friday high of US$69.15/bbl, an intraday low of US$67.79/bbl, and settled up by 3.014% to close at US$68.55/bbl.
Technicals in Focus:
On daily charts, oil is sustaining above its 100DMA i.e. 75.37, a support level, and breakage above will call for 77.48. MACD is above the zero line and histograms are in increasing mode will bring a bullish stance in the upcoming sessions. The Stochastic Oscillator is in the overbought region, giving a negative crossover to confirm a bearish stance; while the RSI is in the neutral region, more upsides can be expected to reach the overbought region, which is highly probable.
Trading Strategy: Neutral to Sell
Sell in between 69.60-75.90 with stop loss at 76.00 targeting 69.10-68.50-67.90-67.00 and 65.90-65.30-64.50.
Buy above 68.90-75.90 with risk daily closing below 76.00, targeting 67.90-68.50-69.10-69.80 and 70.50-71.10-72.00-72.54 and 73.50-74.10-74.90-75.90.
|
|
| Intraday Support Levels |
| S1 |
|
|
68.60-67.90-67.50- |
| S2 |
|
|
67.00-65.90-65.30 |
| S3 |
|
|
64.50-63.90-63.50 |
| Intraday Resistance Levels |
| R1 |
|
|
69.10-69.80 |
| R2 |
|
|
70.50-71.10 |
| R3 |
|
|
72.00-72.54-73.50 |
| TECHNICAL INDICATORS |
| Name |
|
Value |
Action |
| 14DRSI |
|
29.346 |
Sell |
| 20-DMA |
|
67.35 |
Sell |
| 50-DMA |
|
69.06 |
Sell |
| 100-DMA |
|
70.28 |
Sell |
| 200-DMA |
|
71.85 |
Sell |
| STOCH(5,3) |
|
16.166 |
Sell |
| MACD(12,26,9) |
|
-1.306 |
Buy |
|
|
|
|
EUR/USD
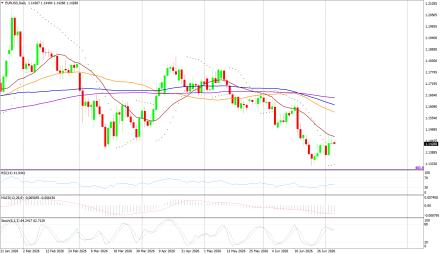
EUR/USD on Monday made an intraday low of US$1.1654/EUR, a high of US$1.1741/EUR, and settled up by 0.0323% to close at US$1.1730/EUR.
Technicals in Focus:
On daily charts, prices are sustaining above 100DMA (1.1661), which becomes immediate support, a break below will target 1.1695. MACD is above the zero line and histograms are increasing mode, bringing a bullish view. Stochastic is in oversold territory, giving negative crossovers to the bullish outlook for intraday. 14D RSI is currently in a neutral region and giving no directions to consider right now.
Trading Strategy: Neutral to Sell
Sell below 1.1440-1.1520, targeting 1.1370-1.1385-1.1405-1.1417 and 1.1426-1.1440-1.1465-1.1520 with stop-loss at daily closing above 1.1520.
Buy above 1.1385-1.1250 with risk below 1.1250 targeting 1.1370-1.1385-1.1405-1.1426 and 1.1440-1.1465-1.1485-1.1590.
|
|
| Intraday Support Levels |
| S1 |
|
|
1.1417-1.1405-1.1385 |
| S2 |
|
|
1.1370-1.1355-1.1323 |
| S3 |
|
|
1.3190-1.1360-1.1310 |
| Intraday Resistance Levels |
| R1 |
|
|
1.1440-1.1465-1.1485 |
| R2 |
|
|
1.1510-1.1550-1.1588 |
| R3 |
|
|
1.1610-1.1640 |
| TECHNICAL INDICATORS |
| Name |
|
Value |
Action |
| 14DRSI |
|
48.897 |
Buy |
| 20-DMA |
|
1.1695 |
Sell |
| 50-DMA |
|
1.1656 |
Buy |
| 100-DMA |
|
1.1661 |
Buy |
| 200-DMA |
|
1.1585 |
Buy |
| STOCH(5,3) |
|
55.688 |
Buy |
| MACD(12,26,9) |
|
-0.0013 |
|
|
|
|
|
GBP/USD
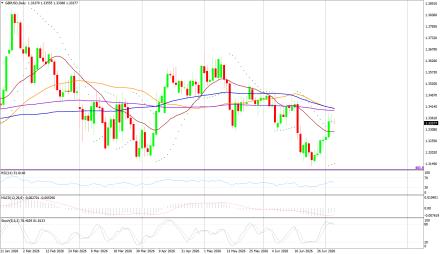
GBP/USD on Monday made a intraday low of US$1.3327/GBP, a high of US$1.3396/GBP, and settled the day up by 0.412% to close at US$1.3388/GBP.
Technicals in Focus:
On daily charts, prices are sustaining above 50DMA (1.2674) is becoming a support level. 14-D RSI is currently in a neutral region and direction is difficult to predict on an RSI basis. The Stochastic Oscillator is in oversold territory and gives a positive crossover to confirm a bullish stance. MACD is above the zero line, but histograms are increasing leading to movement.
Trading Strategy: Neutral to Buy
Based on the charts and explanations above; buy between 1.3350-1.3079 with a target of 1.3390-1.3436 and 1.3500-1.3570-1.3600-1.3640-1.3690 with a stop loss closing below 1.3150.
Sell in between 1.3390-1.3820 with targets at 1.3350-1.3300-1.3210-1.3190-1.3150 and 1.3135-1.3120-1.3100-1.3079 with a stop loss of 1.3900.
|
|
| Intraday Support Levels |
| S1 |
|
|
1.3350-1.3300-1.3270-1.3200 |
| S2 |
|
|
1.3180-1.3160-1.3135 |
| S3 |
|
|
1.3120-1.3100-1.3079 |
| Intraday Resistance Levels |
| R1 |
|
|
1.3390-1.3440-1.3490 |
| R2 |
|
|
1.3540-1.3600 1.3640 |
| R3 |
|
|
1.3700 |
| TECHNICAL INDICATORS |
| Name |
|
Value |
Action |
| 14DRSI |
|
46.905 |
Buy |
| 20-DMA |
|
1.2932 |
Buy |
| 50-DMA |
|
1.2736 |
Buy |
| 100-DMA |
|
1.2629 |
Buy |
| 200-DMA |
|
1.2811 |
Buy |
| STOCH(5,3) |
|
9.458 |
Buy |
| MACD(12,26,9) |
|
-0.003 |
Sell |
|
|
|
|
USD/JPY
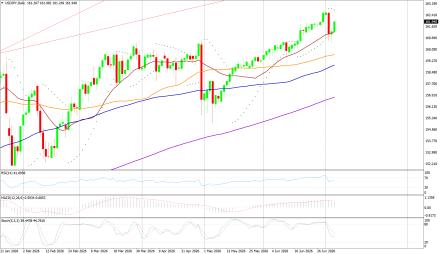
USD/JPY on Monday made an intra‐day low of JPY161.24/USD an intraday high of 162.42/USD, and settled the day up by 0.4911% at JPY162.05/USD.
Technicals in Focus:
In daily charts, JPY is sustaining above 100DMA (152.35), major support on the daily chart. 14-D RSI is currently in the overbought region and chances of downward are expected based on RSI. MACD is above the zero line but histograms are decreasing mode which might lead to downward movement. The Stochastic Oscillator is in overbought territory and signaling to sell as it has given a negative crossover to confirm a bearish stance.
Trading Strategy: Neutral to Sell
Sell below 161.90-163.10 with risk above 163.10 targeting 160.70-161158.70-158.10-157.00 and 156.60-153.00-152.65-152.10.
Long positions above 161.90-152.00 with targets of 159.40-160.00 and 160.90-161.60-162.20-162.60 with stops below 148.00.
|
|
| Intraday Support Levels |
| S1 |
|
|
161.40-161.00-160.70 |
| S2 |
|
|
160.00-159.40 |
| S3 |
|
|
158.70-158.00 |
| INTRADAY RESISTANCE LEVELS |
| R1 |
|
|
161.90-162.50-162.90 |
| R2 |
|
|
163.50-164.00 |
| R3 |
|
|
164.60-165.00 |
| TECHNICAL INDICATORS |
| Name |
|
Value |
Action |
| 14DRSI |
|
41.14 |
Buy |
| 20-DMA |
|
148.91 |
Buy |
| 50-DMA |
|
150.24 |
Buy |
| 100-DMA |
|
152.53 |
Buy |
| 200-DMA |
|
151.18 |
Buy |
| STOCH(9,6) |
|
93.662 |
Sell |
| MACD(12,26,9) |
|
0.683 |
Sell |
|
|
|
 |