 |
|
|
Daily Market Lookup
- The U.S. dollar ticked up on Tuesday, as geopolitical tensions outweighed monetary policy as the main driver of the greenback. Washington revoked a key Iranian license in what was said to be a response against Tehran following fresh attacks on ships in the Gulf, boosting oil prices and safe haven demand. Meanwhile, the euro dipped after forecast-beating German manufacturing data was offset by a cautious outlook from a senior European Central Bank official, while the Japanese yen remained in potential intervention territory. The U.S. Treasury Department’s Office of Foreign Assets Control on Tuesday revoked the general license authorizing the production, delivery, and sale of crude oil, petrochemical products, and petroleum products of Iranian origin. Both Reuters and Axios, citing a U.S. official, said the move was in response to the new attacks on ships. The official blamed Iran, calling the actions "unacceptable" and promising "consequences" while adding that negotiations continued in "good faith," according to the news outlets. Earlier, the United Kingdom Maritime Trade Operations (UKMTO) said it had received reports about attacks on three separate oil tankers over the past 24 hours in and around the critical Strait of Hormuz. Two of those tankers were hit by unknown projectiles while the third was truck by a drone, the UKMTO said, adding that there were no casualties reported. The agency later updated its threat level for the region to "severe" from "substantial. While Iran has not publicly said it was responsible for the attacks, Axios reported that Iran’s military had fired upon three commercial ships, citing U.S. officials. Iran has previously said any vessels attempting to transit the strait must only use routes approved by Tehran, and avoid a separate temporary shipping corridor established by Oman and the International Maritime Organization. Qatar identified one of the vessels reported to the UKMTO as the Al-Rekayyat and condemned the attack on the ship, saying it held Iran "fully legally responsible." Meanwhile, Saudi Arabia identified one of the other vessels as a Saudi tanker called the Vijian and likewise condemned the attack. Tuesday’s escalation threatens to further destabilize relations between Washington and Tehran after both sides inked an interim peace deal last month that ended fighting on all fronts and reopened the strait. Tensions had already flared at the end of June when Iran’s military attacked ships that prompted retaliatory airstrikes from the U.S. military. Since the signing of peace deal and the subsequent slide in oil prices to pre-war levels, monetary policy outlook had become the main driver of the greenback. The dollar last Thursday posted its worst day since the end of April after a softer-than-expected June jobs report. The data was received favorably by traders as it meant that the labor market was resilient but not too strong, giving the Federal Reserve some breathing room to potentially keep interest rates on hold and not tighten policy. Higher rate environments generally tend to strengthen the greenback The Fed under new chair Kevin Warsh last month signaled that it would give up forward guidance and focus solely on combating inflation, as the labor market remained steady. Warsh reiterated his stance of not giving forward guidance in public comments in Portugal last week, though he did note that inflation risks had come down. The minutes of the Fed’s June meeting will now be looked at on Wednesday for further insight into the thinking of policymakers, half of whom indicated that rate hikes could be warranted this year. overnment data earlier showed that German industrial production rose by 0.9% in May, comfortably beating a Reuters poll of analysts who had forecast a modest 0.2% increase. The unexpected bounce was primarily driven by a 3.6% surge in automotive production. However, the positive manufacturing surprise was quickly offset by a sober assessment of the bloc’s wider economy. Speaking at a conference in Rome, ECB Governing Council member and Bank of Italy Governor Fabio Panetta warned that the eurozone’s outlook remained fragile as the global economy underwent a profound structural shift. Elsewhere, the Japanese yen notched brief gains against the dollar after data showed Japanese wages grew for a fifth straight month in May, keeping the door open for further Bank of Japan rate hikes. However, the recovery was fleeting, and the USD/JPY pair was last little changed at 162.10, remaining at 40-year lows against the greenback. Against the sterling, the yen touched its lowest level since 2007, leaving traders highly alert to potential market intervention from Tokyo as Japanese economic officials continue to push back against over-speculation.
- Oil prices rose sharply in early trade on Wednesday after the U.S. military said it launched fresh strikes against Iran and reimposed sanctions on the country’s oil over attacks on vessels in the Strait of Hormuz. U.S. Central Command (Centcom) said it had begun a series of strikes against Iran, aimed at imposing what it described as “heavy costs” for Tehran’s attacks on commercial shipping. The resumption in hostilities and signs of more shipping trouble in Hormuz rekindled concerns over supply disruptions in the Middle East. The attacks also came shortly after the U.S. withdrew a key concession allowing Iran to sell oil internationally– a move that could herald tighter oil markets in the coming weeks. Iran had reportedly attacked vessels attempting to cross the Strait of Hormuz this week, raising tensions with the U.S. and sparking more uncertainty over the status of the critical waterway. Crude had tumbled to pre-war lows in June after the U.S. and Iran agreed to a framework peace deal, which also saw improving ship flows through Hormuz. But the latest round of hostilities stands to undermine the agreement, with future peace talks between the two countries now appearing uncertain. "A return to full-scale US-Iran conflict appears unlikely given growing US political pressure to keep oil prices contained ahead of the November midterm elections. However, there is still no clear path to fully securing the Strait of Hormuz," OCBC analysts wrote in a note. Renewed supply concerns in the Middle East largely overshadowed signs of increasing supply elsewhere, after the Organization of Petroleum Exporting Countries and allies agreed to increase production during a weekend meeting.
|
|
| Intraday RESISTANCE LEVELS |
| 8th July 2026 |
R1 |
R2 |
R3 |
| GOLD-XAU |
4132-4144-4160-4188 |
4200-4214-4268 |
4280-4294-4310 |
| Silver-XAG |
61.00-61.48-62.10-63.20 |
63.60-64.00-64.60 |
66.95-67.50-68.40 |
| Crude Oil |
61.00-62.10-62.80 |
63.50-63.90-64.50-65.30 |
65.90-68.60-69.10 |
| EURO/USD |
1.1440-1.1465-1.1485 |
1.1510-1.1550-1.1588 |
1.1610-1.1640 |
| GBP/USD |
1.3390-1.3440-1.3490 |
1.3540-1.3600 1.3640 |
1.3700 |
| USD/JPY |
162.50-162.90 |
163.50-164.00 |
164.60-165.00 |
| Intraday SUPPORTS LEVELS |
| 8th July 2026 |
S1 |
S2 |
S3 |
| GOLD-XAU |
4100-4085-4066 |
4023-3990-3958 |
3942-3920-3900 |
| Silver-XAG |
60.20-59.90 |
59.00-58.40-57.50 |
57.00-56.40-55.60 |
| Crude Oil |
60.10-59.00-58.00 |
57.10-56.59-55.90 |
56.50-57.00 |
| EURO/USD |
1.1417-1.1405-1.1385 |
1.1370-1.1355-1.1323 |
1.3190-1.1360-1.1310 |
| GBP/USD |
1.3350-1.3300-1.3270-1.3200 |
1.3180-1.3160-1.3135 |
1.3120-1.3100-1.3079 |
| USD/JPY |
161.90-161.40-161.00-160.70 |
160.00-159.40 |
158.70-158.00 |
|
|
| Intra-Day Strategy (8th July 2026) |
| GOLD-XAU |
Sell on Strength |
| Silver-XAG |
Buy on Dips |
|
| Crude Oil |
Neutral to Sell |
| EUR/USD |
Neutral to Sell |
|
| GBP/USD |
Neutral to Buy |
| USD/JPY |
Neutral to Sell |
|
|
|
|
Gold – XAU
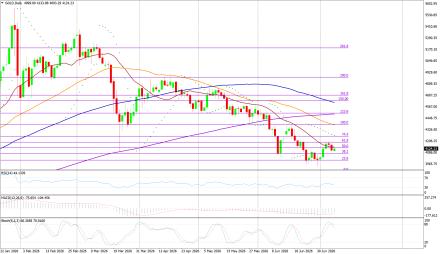
Gold on Tuesday interaday high of US$4180.42/oz and low of $4092.11/oz. God is up by 1.402% at US$4105.84/oz.
Technicals in Focus:
On the daily charts, gold trades higher than 20DMA (2197). If it drops below this level, it could lead to 2,100. The MACD is currently above the zero line and the histograms are showing an increasing trend, indicating that there may be upward movement in the coming sessions. The RSI is currently at 83.04, which is in the overbought region, suggesting there may be selling pressure in the next 2 to 3 sessions. The Stochastic Oscillator is also in the overbought territory but has given a positive crossover, indicating a bullish stance for intraday trades, but rebound in expected in all the overbought indicators.
Trading Strategy: Sell on Strength
Sell below 4132-4400 keeping stop loss closing above 4400, targeting 4100 and 4066-4023-3990-3974-3958. Buy in between 4100-3958 with risk below 3866 targeting 4144-4160-4188-4200-4224 and 4268-4280-4294-4310. |
|
| Intraday Support Levels |
| S1 |
|
|
4100-4085-4066 |
| S2 |
|
|
4023-3990-3958 |
| S3 |
|
|
3942-3920-3900 |
| Intraday Resistance Levels |
| R1 |
|
|
4132-4144-4160-4188 |
| R2 |
|
|
4200-4214-4268 |
| R3 |
|
|
4280-4294-4310 |
| Technical Indicators
|
| Name |
|
Value |
Action |
| 14DRSI |
|
52.916 |
Buy |
| 20-DMA |
|
4800.67 |
Buy |
| 50-DMA |
|
4497.76 |
Buy |
| 100-DMA |
|
4239.36 |
Buy |
| 200-DMA |
|
3800.35 |
Buy |
| STOCH(5,3) |
|
26.933 |
Sell |
| MACD(12,26,9) |
|
150.924 |
Buy |
|
|
|
|
Silver - XAG
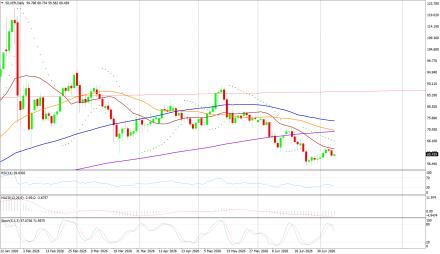
Silver on Tuesday its intraday high of US$62.13/oz and low of US$59.42/oz settle down by 3.353% at US$59.93/oz.
Technicals in Focus:
On daily charts, silver is sustaining above 20MA (25.05), breakage above will lead to 23.73. MACD is below the zero line and histograms are increasing trend, bringing a bullish stance in the upcoming sessions. RSI is in the oversold region, indicating a sell signal for now. The Stochastic Oscillator is in the overbought region and gives a positive crossover to show an upside move for the intraday trade.
Trading Strategy: Buy on Dips
Buy in between 61.00-53.00 targeting 61.48-62.10-63.00-63.60 and 64.00-64.60-65.20-66.40-66.95 with stop loss should be placed on the breakage below 53.00.
Sell in between 61.48-63.45 with a stop loss above 64.00 targeting 61.00-60.40-59.90-59.00 and 58.40-57.50-56.40-55.60-55.00-54.10.
|
|
| Intraday Support Levels |
| S1 |
|
|
60.20-59.90 |
| S2 |
|
|
59.00-58.40-57.50 |
| S3 |
|
|
57.00-56.40-55.60 |
| Intraday Resistance Levels |
| R1 |
|
|
61.00-61.48-62.10-63.20 |
| R2 |
|
|
63.60-64.00-64.60 |
| R3 |
|
|
66.95-67.50-68.40 |
| TECHNICAL INDICATORS |
| Name |
|
Value |
Action |
| 14DRSI |
|
46.1562 |
Buy |
| 20-DMA |
|
92.99 |
Sell |
| 50-DMA |
|
75.81 |
Sell |
| 100-DMA |
|
62.03 |
Sell |
| 200-DMA |
|
49.29 |
Sell |
| STOCH(5,3) |
|
21.094 |
Buy |
| MACD(12,26,9) |
|
5.262 |
Buy |
|
|
|
|
Oil - WTI
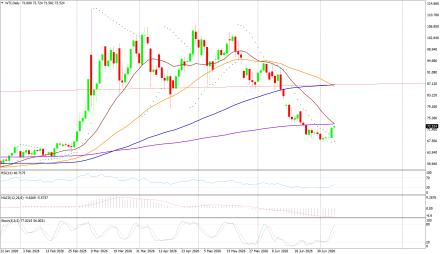
Crude Oil on Tuesday high of US$65.79/bbl, an intraday low of US$64.65/bbl, and settled up by 3.35% to close at US$64.65/bbl.
Technicals in Focus:
On daily charts, oil is sustaining above its 100DMA i.e. 75.37, a support level, and breakage above will call for 77.48. MACD is above the zero line and histograms are in increasing mode will bring a bullish stance in the upcoming sessions. The Stochastic Oscillator is in the overbought region, giving a negative crossover to confirm a bearish stance; while the RSI is in the neutral region, more upsides can be expected to reach the overbought region, which is highly probable.
Trading Strategy: Neutral to Sell
Sell in between 61.00-69.10 with stop loss at 69.10 targeting 60.10-59.00-58.00-57.10 and 56.59
Buy above 60.10-57.90 with risk daily closing below 57.00, targeting 61.00-62.10-62.80-63.50 and 63.90-64.50-65.30-65.90-68.60.
|
|
| Intraday Support Levels |
| S1 |
|
|
60.10-59.00-58.00 |
| S2 |
|
|
57.10-56.59-55.90 |
| S3 |
|
|
56.50-57.00 |
| Intraday Resistance Levels |
| R1 |
|
|
61.00-62.10-62.80 |
| R2 |
|
|
63.50-63.90-64.50-65.30 |
| R3 |
|
|
65.90-68.60-69.10 |
| TECHNICAL INDICATORS |
| Name |
|
Value |
Action |
| 14DRSI |
|
29.346 |
Sell |
| 20-DMA |
|
67.35 |
Sell |
| 50-DMA |
|
69.06 |
Sell |
| 100-DMA |
|
70.28 |
Sell |
| 200-DMA |
|
71.85 |
Sell |
| STOCH(5,3) |
|
16.166 |
Sell |
| MACD(12,26,9) |
|
-1.306 |
Buy |
|
|
|
|
EUR/USD
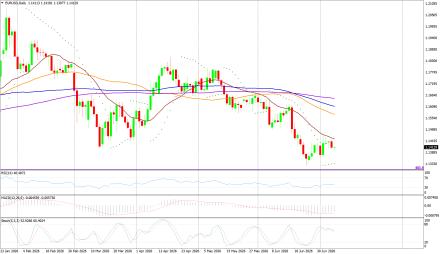
EUR/USD on Tuesday made an intraday low of US$1.1407/EUR, a high of US$1.1447/EUR, and settled up by 0.257% to close at US$1.1411/EUR.
Technicals in Focus:
On daily charts, prices are sustaining above 100DMA (1.1661), which becomes immediate support, a break below will target 1.1695. MACD is above the zero line and histograms are increasing mode, bringing a bullish view. Stochastic is in oversold territory, giving negative crossovers to the bullish outlook for intraday. 14D RSI is currently in a neutral region and giving no directions to consider right now.
Trading Strategy: Neutral to Sell
Sell below 1.1440-1.1520, targeting 1.1370-1.1385-1.1405-1.1417 and 1.1426-1.1440-1.1465-1.1520 with stop-loss at daily closing above 1.1520.
Buy above 1.1385-1.1250 with risk below 1.1250 targeting 1.1370-1.1385-1.1405-1.1426 and 1.1440-1.1465-1.1485-1.1590.
|
|
| Intraday Support Levels |
| S1 |
|
|
1.1417-1.1405-1.1385 |
| S2 |
|
|
1.1370-1.1355-1.1323 |
| S3 |
|
|
1.3190-1.1360-1.1310 |
| Intraday Resistance Levels |
| R1 |
|
|
1.1440-1.1465-1.1485 |
| R2 |
|
|
1.1510-1.1550-1.1588 |
| R3 |
|
|
1.1610-1.1640 |
| TECHNICAL INDICATORS |
| Name |
|
Value |
Action |
| 14DRSI |
|
48.897 |
Buy |
| 20-DMA |
|
1.1695 |
Sell |
| 50-DMA |
|
1.1656 |
Buy |
| 100-DMA |
|
1.1661 |
Buy |
| 200-DMA |
|
1.1585 |
Buy |
| STOCH(5,3) |
|
55.688 |
Buy |
| MACD(12,26,9) |
|
-0.0013 |
|
|
|
|
|
GBP/USD
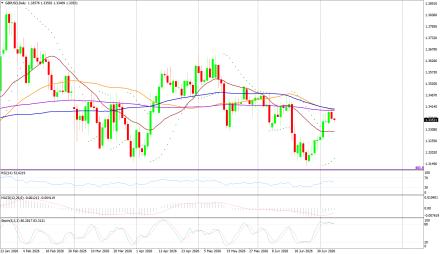
GBP/USD on Monday made a intraday low of US$1.3347/GBP, a high of US$1.3400/GBP, and settled the day down by 0.227% to close at US$1.3357/GBP.
Technicals in Focus:
On daily charts, prices are sustaining above 50DMA (1.2674) is becoming a support level. 14-D RSI is currently in a neutral region and direction is difficult to predict on an RSI basis. The Stochastic Oscillator is in oversold territory and gives a positive crossover to confirm a bullish stance. MACD is above the zero line, but histograms are increasing leading to movement.
Trading Strategy: Neutral to Buy
Based on the charts and explanations above; buy between 1.3350-1.3079 with a target of 1.3390-1.3436 and 1.3500-1.3570-1.3600-1.3640-1.3690 with a stop loss closing below 1.3150.
Sell in between 1.3390-1.3820 with targets at 1.3350-1.3300-1.3210-1.3190-1.3150 and 1.3135-1.3120-1.3100-1.3079 with a stop loss of 1.3900.
|
|
| Intraday Support Levels |
| S1 |
|
|
1.3350-1.3300-1.3270-1.3200 |
| S2 |
|
|
1.3180-1.3160-1.3135 |
| S3 |
|
|
1.3120-1.3100-1.3079 |
| Intraday Resistance Levels |
| R1 |
|
|
1.3390-1.3440-1.3490 |
| R2 |
|
|
1.3540-1.3600 1.3640 |
| R3 |
|
|
1.3700 |
| TECHNICAL INDICATORS |
| Name |
|
Value |
Action |
| 14DRSI |
|
46.905 |
Buy |
| 20-DMA |
|
1.2932 |
Buy |
| 50-DMA |
|
1.2736 |
Buy |
| 100-DMA |
|
1.2629 |
Buy |
| 200-DMA |
|
1.2811 |
Buy |
| STOCH(5,3) |
|
9.458 |
Buy |
| MACD(12,26,9) |
|
-0.003 |
Sell |
|
|
|
|
USD/JPY
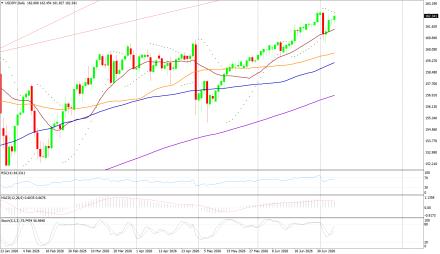
USD/JPY on Monday made an intra‐day low of JPY161.66/USD an intraday high of 162.17/USD, and settled the day up by % at JPY162.06/USD.
Technicals in Focus:
In daily charts, JPY is sustaining above 100DMA (152.35), major support on the daily chart. 14-D RSI is currently in the overbought region and chances of downward are expected based on RSI. MACD is above the zero line but histograms are decreasing mode which might lead to downward movement. The Stochastic Oscillator is in overbought territory and signaling to sell as it has given a negative crossover to confirm a bearish stance.
Trading Strategy: Neutral to Sell
Sell below 161.90-163.10 with risk above 163.10 targeting 160.70-161158.70-158.10-157.00 and 156.60-153.00-152.65-152.10.
Long positions above 161.90-152.00 with targets of 159.40-160.00 and 160.90-161.60-162.20-162.60 with stops below 148.00.
|
|
| Intraday Support Levels |
| S1 |
|
|
161.90-161.40-161.00-160.70 |
| S2 |
|
|
160.00-159.40 |
| S3 |
|
|
158.70-158.00 |
| INTRADAY RESISTANCE LEVELS |
| R1 |
|
|
162.50-162.90 |
| R2 |
|
|
163.50-164.00 |
| R3 |
|
|
164.60-165.00 |
| TECHNICAL INDICATORS |
| Name |
|
Value |
Action |
| 14DRSI |
|
41.14 |
Buy |
| 20-DMA |
|
148.91 |
Buy |
| 50-DMA |
|
150.24 |
Buy |
| 100-DMA |
|
152.53 |
Buy |
| 200-DMA |
|
151.18 |
Buy |
| STOCH(9,6) |
|
93.662 |
Sell |
| MACD(12,26,9) |
|
0.683 |
Sell |
|
|
|
 |