 |
|
|
Daily Market Lookup
- The U.S. dollar reversed course on Wednesday to turn slightly lower, as safe haven demand for the greenback from earlier in the day amid escalating tensions between Washington and Tehran was offset by Federal Reserve minutes that showed an evenly divided debate over monetary policy outlook. Track currency markets, central bank moves, and real-time macro developments with InvestingPr U.S. monetary policymakers noted high uncertainty with regard to the outlook on interest rates and discussed a range of scenarios from inflationary pressures dissipating to remaining elevated, the minutes of the Federal Reserve’s June meeting showed on Wednesday. Participants at the June 16-17 meeting noted that inflation remained high and reflected in part price increases from energy supply shocks emanating from the Middle East conflict. A few participants made a case for raising interest rates right away. The broader debate about rates appeared to be equally divided, with "most" participants pointing to scenarios where inflation would start coming back towards the Fed’s 2% target on its own. This is the first minutes published under the leadership of new chair Kevin Warsh. The Fed last month held the federal funds rate steady at 3.50%-3.75%, as widely expected. More notably, the central bank’s updated dot plot showed a decidedly hawkish tilt, with half of the policymakers that contribute to the projections anticipating rate hikes this year Wall Street was also keen to hear what Warsh would have to say, and the new chief did not disappoint. He unveiled a significantly shorter Federal Open Market Committee statement, committed to solely focus on combating inflation, decided to drop forward guidance, and announced a sweeping review of several Fed operations. The dollar had been higher ahead of the Fed minutes, as investors flocked to its safe haven status following the biggest escalation of tensions between Washington and Tehran since the signing of their interim peace deal in mid-June. The U.S. military on Tuesday launched strikes against Iran in retaliation for attacks on three commercial oil tankers in and around the critical Strait of Hormuz. Iran responded with strikes of its own, while President Donald Trump ramped up his harsh rhetoric against the country. Trump at a North Atlantic Treaty Organization (NATO) summit in Türkiye said a ceasefire between the U.S. and Iran was now "over" and that he didn’t want to deal with Tehran anymore. Trump also said that the U.S. may reimpose a naval blockade on Iran’s ports and coastline that was removed as part of the interim agreement. The U.S. on Tuesday revoked a general license that allowed the production and sale of Iranian oil as a response to the attacks on the ships. Moreover, Trump warned that Iran would "probably" be hit "hard again tonight" and a few hours later, the U.S. military confirmed that it had launched additional strikes. Against this backdrop, oil prices surged on Wednesday, with Brent crude futures, the global benchmark, briefly topping $80 a barrel for the first time since June 22. Bank of Japan board member Toichiro Asada reiterated that clearer evidence of demand-driven inflation is needed before supporting further interest-rate increases, reinforcing expectations that Japan will normalize policy only gradually.
- Gold prices fell slightly on Thursday, remaining under pressure from a stronger dollar as renewed U.S.-Iran military action rekindled concerns over sticky inflation and high interest rates. The yellow metal took little relief from the minutes of the Federal Reserve’s June meeting, which showed policymakers largely split over whether the central bank should raise rates further. Gold was nursing three straight days of losses after a flare-up in U.S.-Iran military activity sent oil prices soaring. This in turn sparked heightened concerns over sticky energy-driven inflation and its effects on interest rates. The dollar benefited from fears of higher inflation, with the dollar index remaining in sight of 13-month highs hit in June. The U.S. launched a series of attacks on Iran this week, with President Donald Trump claiming that a ceasefire with the country was over. The latest hostilities stem from Iranian attacks on vessels attempting to cross the Strait of Hormuz. Other precious metals were also largely subdued on Thursday, after tracking gold lower in recent sessions. Spot silver fell 0.7% to $57.8635/oz, while spot platinum rose 0.7% to $1,598.13/oz. Higher rates bode poorly for gold and precious metals, given that they increase the opportunity costs of investing in non-yielding assets. The minutes of the Fed’s June meeting, released on Wednesday, were less dovish than markets were fearing, with policymakers largely split over the need for rate hikes this year. But the minutes did show increasing anxiety among central bankers over sticky inflation– a trend that could invite rate hikes later in the year, especially if price pressures show few signs of cooling. U.S. inflation has increased sharply since the onset of the U.S.-Iran war in late-February, with price growth remaining well above the Fed’s 2% annual target.Fed Chair Kevin Warsh had reiterated the bank’s commitment to meeting the target during a recent address.
|
|
| Intraday RESISTANCE LEVELS |
| 9th July 2026 |
R1 |
R2 |
R3 |
| GOLD-XAU |
4085-4100-4132 |
4144-4160-4188 |
4200-4214-4268 |
| Silver-XAG |
58.40-59.00-59.90- |
61.00-61.48-62.10 |
63.20-63.60-64.00 |
| Crude Oil |
61.00-62.10-62.80 |
63.50-63.90-64.50-65.30 |
65.90-68.60-69.10 |
| EURO/USD |
1.1440-1.1465-1.1485 |
1.1510-1.1550-1.1588 |
1.1610-1.1640 |
| GBP/USD |
1.3390-1.3440-1.3490 |
1.3540-1.3600 1.3640 |
1.3700 |
| USD/JPY |
162.50-162.90 |
163.50-164.00 |
164.60-165.00 |
| Intraday SUPPORTS LEVELS |
| 9th July 2026 |
S1 |
S2 |
S3 |
| GOLD-XAU |
4066 |
4023-3990-3958 |
3942-3920-3900 |
| Silver-XAG |
57.70-57.50 |
57.00-56.40-55.60 |
55.00-54.00 |
| Crude Oil |
60.10-59.00-58.00 |
57.10-56.59-55.90 |
56.50-57.00 |
| EURO/USD |
1.1417-1.1405-1.1385 |
1.1370-1.1355-1.1323 |
1.3190-1.1360-1.1310 |
| GBP/USD |
1.3350-1.3300-1.3270-1.3200 |
1.3180-1.3160-1.3135 |
1.3120-1.3100-1.3079 |
| USD/JPY |
161.90-161.40-161.00-160.70 |
160.00-159.40 |
158.70-158.00 |
|
|
| Intra-Day Strategy (9th July 2026) |
| GOLD-XAU |
Sell on Strength |
| Silver-XAG |
Buy on Dips |
|
| Crude Oil |
Neutral to Sell |
| EUR/USD |
Neutral to Sell |
|
| GBP/USD |
Neutral to Buy |
| USD/JPY |
Neutral to Sell |
|
|
|
|
Gold – XAU
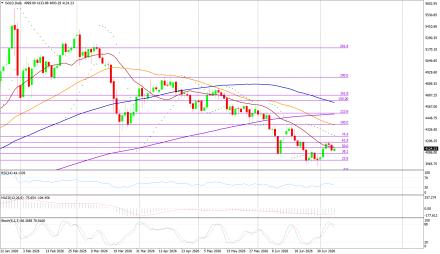
Gold on Wednesday interaday high of US$4133.88/oz and low of $4092.11/oz. God is up by 0.564% at US$4076.56/oz.
Technicals in Focus:
On the daily charts, gold trades higher than 20DMA (2197). If it drops below this level, it could lead to 2,100. The MACD is currently above the zero line and the histograms are showing an increasing trend, indicating that there may be upward movement in the coming sessions. The RSI is currently at 83.04, which is in the overbought region, suggesting there may be selling pressure in the next 2 to 3 sessions. The Stochastic Oscillator is also in the overbought territory but has given a positive crossover, indicating a bullish stance for intraday trades, but rebound in expected in all the overbought indicators.
Trading Strategy: Sell on Strength
Sell below 4085-4400 keeping stop loss closing above 4400, targeting 4066-4023-3990-3974-3958. Buy in between 4066-3958 with risk below 3866 targeting 4085-4100-4144-4160-4188-4200-4224 and 4268-4280-4294-4310. |
|
| Intraday Support Levels |
| S1 |
|
|
4066 |
| S2 |
|
|
4023-3990-3958 |
| S3 |
|
|
3942-3920-3900 |
| Intraday Resistance Levels |
| R1 |
|
|
4085-4100-4132 |
| R2 |
|
|
4144-4160-4188 |
| R3 |
|
|
4200-4214-4268 |
| Technical Indicators
|
| Name |
|
Value |
Action |
| 14DRSI |
|
52.916 |
Buy |
| 20-DMA |
|
4800.67 |
Buy |
| 50-DMA |
|
4497.76 |
Buy |
| 100-DMA |
|
4239.36 |
Buy |
| 200-DMA |
|
3800.35 |
Buy |
| STOCH(5,3) |
|
26.933 |
Sell |
| MACD(12,26,9) |
|
150.924 |
Buy |
|
|
|
|
Silver - XAG
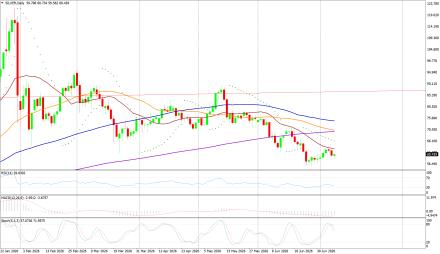
Silver on Wednesday its intraday high of US$61.00/oz and low of US$57.20/oz settle down by 2.54% at US$58.27/oz.
Technicals in Focus:
On daily charts, silver is sustaining above 20MA (25.05), breakage above will lead to 23.73. MACD is below the zero line and histograms are increasing trend, bringing a bullish stance in the upcoming sessions. RSI is in the oversold region, indicating a sell signal for now. The Stochastic Oscillator is in the overbought region and gives a positive crossover to show an upside move for the intraday trade.
Trading Strategy: Buy on Dips
Buy in between 57.60.00-53.00 targeting 58.40-59.00-59.90 and 61.00-61.48-62.10-63.00-63.60 with stop loss should be placed on the breakage below 53.00.
Sell in between 58.40-63.45 with a stop loss above 64.00 targeting 57.50-56.40-55.60-55.00-54.10.
|
|
| Intraday Support Levels |
| S1 |
|
|
57.70-57.50 |
| S2 |
|
|
57.00-56.40-55.60 |
| S3 |
|
|
55.00-54.00 |
| Intraday Resistance Levels |
| R1 |
|
|
58.40-59.00-59.90- |
| R2 |
|
|
61.00-61.48-62.10 |
| R3 |
|
|
63.20-63.60-64.00 |
| TECHNICAL INDICATORS |
| Name |
|
Value |
Action |
| 14DRSI |
|
46.1562 |
Buy |
| 20-DMA |
|
92.99 |
Sell |
| 50-DMA |
|
75.81 |
Sell |
| 100-DMA |
|
62.03 |
Sell |
| 200-DMA |
|
49.29 |
Sell |
| STOCH(5,3) |
|
21.094 |
Buy |
| MACD(12,26,9) |
|
5.262 |
Buy |
|
|
|
|
Oil - WTI
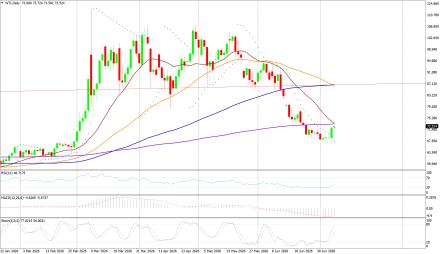
Crude Oil on Wednesday high of US$65.79/bbl, an intraday low of US$64.65/bbl, and settled up by 3.35% to close at US$64.65/bbl.
Technicals in Focus:
On daily charts, oil is sustaining above its 100DMA i.e. 75.37, a support level, and breakage above will call for 77.48. MACD is above the zero line and histograms are in increasing mode will bring a bullish stance in the upcoming sessions. The Stochastic Oscillator is in the overbought region, giving a negative crossover to confirm a bearish stance; while the RSI is in the neutral region, more upsides can be expected to reach the overbought region, which is highly probable.
Trading Strategy: Neutral to Sell
Sell in between 61.00-69.10 with stop loss at 69.10 targeting 60.10-59.00-58.00-57.10 and 56.59
Buy above 60.10-57.90 with risk daily closing below 57.00, targeting 61.00-62.10-62.80-63.50 and 63.90-64.50-65.30-65.90-68.60.
|
|
| Intraday Support Levels |
| S1 |
|
|
60.10-59.00-58.00 |
| S2 |
|
|
57.10-56.59-55.90 |
| S3 |
|
|
56.50-57.00 |
| Intraday Resistance Levels |
| R1 |
|
|
61.00-62.10-62.80 |
| R2 |
|
|
63.50-63.90-64.50-65.30 |
| R3 |
|
|
65.90-68.60-69.10 |
| TECHNICAL INDICATORS |
| Name |
|
Value |
Action |
| 14DRSI |
|
29.346 |
Sell |
| 20-DMA |
|
67.35 |
Sell |
| 50-DMA |
|
69.06 |
Sell |
| 100-DMA |
|
70.28 |
Sell |
| 200-DMA |
|
71.85 |
Sell |
| STOCH(5,3) |
|
16.166 |
Sell |
| MACD(12,26,9) |
|
-1.306 |
Buy |
|
|
|
|
EUR/USD
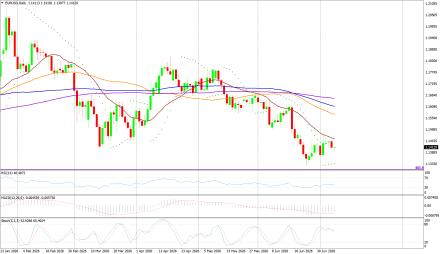
EUR/USD on Wednesday made an intraday low of US$1.1390/EUR, a high of US$1.1431/EUR, and settled up by 00431% to close at US$1.1415/EUR.
Technicals in Focus:
On daily charts, prices are sustaining above 100DMA (1.1661), which becomes immediate support, a break below will target 1.1695. MACD is above the zero line and histograms are increasing mode, bringing a bullish view. Stochastic is in oversold territory, giving negative crossovers to the bullish outlook for intraday. 14D RSI is currently in a neutral region and giving no directions to consider right now.
Trading Strategy: Neutral to Sell
Sell below 1.1440-1.1520, targeting 1.1370-1.1385-1.1405-1.1417 and 1.1426-1.1440-1.1465-1.1520 with stop-loss at daily closing above 1.1520.
Buy above 1.1385-1.1250 with risk below 1.1250 targeting 1.1370-1.1385-1.1405-1.1426 and 1.1440-1.1465-1.1485-1.1590.
|
|
| Intraday Support Levels |
| S1 |
|
|
1.1417-1.1405-1.1385 |
| S2 |
|
|
1.1370-1.1355-1.1323 |
| S3 |
|
|
1.3190-1.1360-1.1310 |
| Intraday Resistance Levels |
| R1 |
|
|
1.1440-1.1465-1.1485 |
| R2 |
|
|
1.1510-1.1550-1.1588 |
| R3 |
|
|
1.1610-1.1640 |
| TECHNICAL INDICATORS |
| Name |
|
Value |
Action |
| 14DRSI |
|
48.897 |
Buy |
| 20-DMA |
|
1.1695 |
Sell |
| 50-DMA |
|
1.1656 |
Buy |
| 100-DMA |
|
1.1661 |
Buy |
| 200-DMA |
|
1.1585 |
Buy |
| STOCH(5,3) |
|
55.688 |
Buy |
| MACD(12,26,9) |
|
-0.0013 |
|
|
|
|
|
GBP/USD
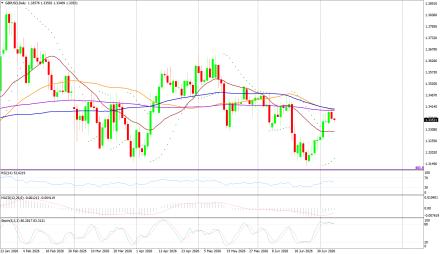
GBP/USD on Wednesday made a intraday low of US$1.3321/GBP, a high of US$1.3409/GBP, and settled the day down by 0.2275% to close at US$1.3388/GBP.
Technicals in Focus:
On daily charts, prices are sustaining above 50DMA (1.2674) is becoming a support level. 14-D RSI is currently in a neutral region and direction is difficult to predict on an RSI basis. The Stochastic Oscillator is in oversold territory and gives a positive crossover to confirm a bullish stance. MACD is above the zero line, but histograms are increasing leading to movement.
Trading Strategy: Neutral to Buy
Based on the charts and explanations above; buy between 1.3350-1.3079 with a target of 1.3390-1.3436 and 1.3500-1.3570-1.3600-1.3640-1.3690 with a stop loss closing below 1.3150.
Sell in between 1.3390-1.3820 with targets at 1.3350-1.3300-1.3210-1.3190-1.3150 and 1.3135-1.3120-1.3100-1.3079 with a stop loss of 1.3900.
|
|
| Intraday Support Levels |
| S1 |
|
|
1.3350-1.3300-1.3270-1.3200 |
| S2 |
|
|
1.3180-1.3160-1.3135 |
| S3 |
|
|
1.3120-1.3100-1.3079 |
| Intraday Resistance Levels |
| R1 |
|
|
1.3390-1.3440-1.3490 |
| R2 |
|
|
1.3540-1.3600 1.3640 |
| R3 |
|
|
1.3700 |
| TECHNICAL INDICATORS |
| Name |
|
Value |
Action |
| 14DRSI |
|
46.905 |
Buy |
| 20-DMA |
|
1.2932 |
Buy |
| 50-DMA |
|
1.2736 |
Buy |
| 100-DMA |
|
1.2629 |
Buy |
| 200-DMA |
|
1.2811 |
Buy |
| STOCH(5,3) |
|
9.458 |
Buy |
| MACD(12,26,9) |
|
-0.003 |
Sell |
|
|
|
|
USD/JPY
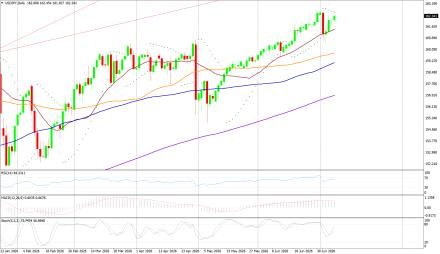
USD/JPY on Monday made an intra‐day low of JPY161.82/USD an intraday high of 162.70/USD, and settled the day up by 0.310% at JPY162.57/USD.
Technicals in Focus:
In daily charts, JPY is sustaining above 100DMA (152.35), major support on the daily chart. 14-D RSI is currently in the overbought region and chances of downward are expected based on RSI. MACD is above the zero line but histograms are decreasing mode which might lead to downward movement. The Stochastic Oscillator is in overbought territory and signaling to sell as it has given a negative crossover to confirm a bearish stance.
Trading Strategy: Neutral to Sell
Sell below 161.90-163.10 with risk above 163.10 targeting 160.70-161158.70-158.10-157.00 and 156.60-153.00-152.65-152.10.
Long positions above 161.90-152.00 with targets of 159.40-160.00 and 160.90-161.60-162.20-162.60 with stops below 148.00.
|
|
| Intraday Support Levels |
| S1 |
|
|
161.90-161.40-161.00-160.70 |
| S2 |
|
|
160.00-159.40 |
| S3 |
|
|
158.70-158.00 |
| INTRADAY RESISTANCE LEVELS |
| R1 |
|
|
162.50-162.90 |
| R2 |
|
|
163.50-164.00 |
| R3 |
|
|
164.60-165.00 |
| TECHNICAL INDICATORS |
| Name |
|
Value |
Action |
| 14DRSI |
|
41.14 |
Buy |
| 20-DMA |
|
148.91 |
Buy |
| 50-DMA |
|
150.24 |
Buy |
| 100-DMA |
|
152.53 |
Buy |
| 200-DMA |
|
151.18 |
Buy |
| STOCH(9,6) |
|
93.662 |
Sell |
| MACD(12,26,9) |
|
0.683 |
Sell |
|
|
|
 |