 |
|
|
Daily Market Lookup
- The dollar rose against most of its peers as a renewal of hostilities in the Middle East fanned inflation fears and raised prospects for interest rate hikes among global central banks. U.S. and Iranian forces exchanged heavy missile and drone assaults at the weekend, with Tehran targeting U.S. facilities in states across the Gulf on Sunday and saying it had again closed the vital Strait of Hormuz shipping route. Fed funds futures are pricing an implied 50.9% probability of two or more rate hikes by the time of the U.S. central bank’s December meeting, up from a 47.6% chance on Friday. The U.S. dollar index, which measures the greenback’s strength against a basket of six currencies, was up 0.1% at 101.13 after earlier touching its highest level since July 8. Inflation risks are likely to remain in focus with the release of U.S. CPI data on Tuesday, PPI gauges the following day, and Fed Chair Kevin Warsh’s testimony before the House and Senate, Westpac analysts wrote in a research report. The Bank of Japan may revise up its economic growth forecast for fiscal 2026 and keep its focus on the risk of an inflation overshoot as rising costs from a weak yen and strong AI demand offset some of the declines in oil prices, three sources familiar with the central bank’s thinking told Reuters.
- Gold prices fell on Monday after renewed U.S. and Iranian strikes over the weekend lifted oil prices and reinforced concerns that a fresh inflation shock could keep the Federal Reserve on a hawkish path, weighing on the appeal of non-yielding bullion. The conflict in the Middle East intensified over the weekend after the U.S. carried out another round of strikes on Iranian targets following an attack on a Cyprus-flagged cargo vessel in the Strait of Hormuz. Although Tehran said the key shipping route would remain closed until further notice, U.S. officials disputed the claim, highlighting the fragile state of ceasefire negotiations. Oil prices rose roughly 3% after the weekend flare-up, reflecting concerns that renewed fighting could disrupt crude flows through the Strait of Hormuz, through which around a fifth of global oil supply passes. The prospect of sustained energy price gains has revived fears of another inflation shock, reinforcing expectations that the Federal Reserve may have to keep interest rates elevated for longer. Higher yields and a firmer dollar tend to reduce the appeal of non-interest-bearing assets such as gold. Minutes from the Fed's June meeting released last week already showed several policymakers believed there was a case for raising interest rates, while officials broadly expressed greater concern over inflation pressures even as worries about the labor market eased. The next Federal Reserve meeting is scheduled for July 28-29. Investors are now awaiting Tuesday's U.S. consumer price index report and Federal Reserve Chair Kevin Warsh's first congressional testimony for further clues on the interest-rate outlook. According to Tony Sycamore, market analyst at IG, gold remains highly sensitive to both geopolitical developments and incoming U.S. inflation data. He said gold found support near the psychologically important $4,000 level last week, and a sustained break above $4,200-$4,220 would strengthen the case for a broader recovery toward the 200-day moving average near $4,491. However, Sycamore warned that a stronger-than-expect CPI report could reinforce expectations for another Fed rate hike before year-end and bolster the greenback, adding pressure on bullion. A softer inflation reading, by contrast, could help gold stabilize after recent losses.
- Oil prices surged more than 3% in Asian trade on Monday after renewed fighting between the U.S. and Iran revived fears of a major disruption to global crude supplies, with Tehran announcing the closure of the Strait of Hormuz. Both contracts advanced more than 4% in the previous week as the U.S.-Iran conflict reignited. Get premium commodity market insights with InvestinPro subscription The latest rally came after Iran on Sunday expanded missile and drone attacks to Gulf states including Qatar and the United Arab Emirates in retaliation for U.S. military strikes. Tehran also declared the Strait of Hormuz closed after a commercial vessel was hit, intensifying concerns over one of the world's most critical energy shipping routes. The U.S. disputed Iran's claim, with President Donald Trump saying commercial shipping through the waterway remained open under U.S. protection. However, shipping activity slowed sharply over the weekend, adding to worries that prolonged disruptions could tighten global oil supplies. The Strait of Hormuz serves as the primary export route for crude from Saudi Arabia, Iraq, Kuwait, the United Arab Emirates and other Gulf producers. Any sustained disruption could force refiners, particularly in Asia, to seek alternative supplies and push freight and insurance costs higher. Market participants are also watching for any coordinated response from major oil producers or potential releases from strategic petroleum reserves if supply disruptions worsen The geopolitical risk premium has returned to the oil market after easing in recent weeks, as diplomatic efforts to restore the previous U.S.-Iran understanding appear to have stalled.
|
|
| Intraday RESISTANCE LEVELS |
| 13th July 2026 |
R1 |
R2 |
R3 |
| GOLD-XAU |
4085-4100-4132 |
4144-4160-4188 |
4200-4214-4268 |
| Silver-XAG |
58.40-59.00-59.90- |
61.00-61.48-62.10 |
63.20-63.60-64.00 |
| Crude Oil |
59.00-60.10-59.00-61.30 |
62.10-62.80-63.50 |
63.90-64.50-65.30 |
| EURO/USD |
1.1405-1.1417 |
1.1440-1.1465-1.1485 |
1.1510-1.1550-1.1588 |
| GBP/USD |
1.3390-1.3440-1.3490 |
1.3540-1.3600 1.3640 |
1.3700 |
| USD/JPY |
162.50-162.90 |
163.50-164.00 |
164.60-165.00 |
| Intraday SUPPORTS LEVELS |
| 13th July 2026 |
S1 |
S2 |
S3 |
| GOLD-XAU |
4056 |
4023-3990-3958 |
3942-3920-3900 |
| Silver-XAG |
58.00-57.70-57.50 |
57.00-56.40-55.60 |
55.00-54.00 |
| Crude Oil |
58.00-57.10 |
56.59-55.90-55.40 |
54.90-54.50 |
| EURO/USD |
1.1385-1.1370 |
1.1355-1.1323 |
1.3190-1.1360-1.1310 |
| GBP/USD |
1.3350-1.3300-1.3270-1.3200 |
1.3180-1.3160-1.3135 |
1.3120-1.3100-1.3079 |
| USD/JPY |
161.90-161.40-161.00-160.70 |
160.00-159.40 |
158.70-158.00 |
|
|
| Intra-Day Strategy (13th July 2026) |
| GOLD-XAU |
Sell on Strength |
| Silver-XAG |
Buy on Dips |
|
| Crude Oil |
Neutral to Sell |
| EUR/USD |
Neutral to Sell |
|
| GBP/USD |
Neutral to Buy |
| USD/JPY |
Neutral to Sell |
|
|
|
|
Gold – XAU
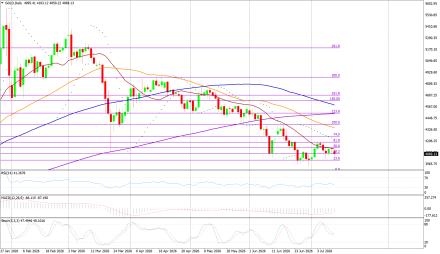
Gold on Friday interaday high of US$4134.71/oz and low of $4072.73/oz. God is down by 0.092% at US$4120.29/oz.
Technicals in Focus:
On the daily charts, gold trades higher than 20DMA (2197). If it drops below this level, it could lead to 2,100. The MACD is currently above the zero line and the histograms are showing an increasing trend, indicating that there may be upward movement in the coming sessions. The RSI is currently at 83.04, which is in the overbought region, suggesting there may be selling pressure in the next 2 to 3 sessions. The Stochastic Oscillator is also in the overbought territory but has given a positive crossover, indicating a bullish stance for intraday trades, but rebound in expected in all the overbought indicators.
Trading Strategy: Sell on Strength
Sell below 4085-4400 keeping stop loss closing above 4400, targeting 4066-4023-3990-3974-3958. Buy in between 4066-3958 with risk below 3866 targeting 4085-4100-4144-4160-4188-4200-4224 and 4268-4280-4294-4310. |
|
| Intraday Support Levels |
| S1 |
|
|
4056 |
| S2 |
|
|
4023-3990-3958 |
| S3 |
|
|
3942-3920-3900 |
| Intraday Resistance Levels |
| R1 |
|
|
4085-4100-4132 |
| R2 |
|
|
4144-4160-4188 |
| R3 |
|
|
4200-4214-4268 |
| Technical Indicators
|
| Name |
|
Value |
Action |
| 14DRSI |
|
52.916 |
Buy |
| 20-DMA |
|
4800.67 |
Buy |
| 50-DMA |
|
4497.76 |
Buy |
| 100-DMA |
|
4239.36 |
Buy |
| 200-DMA |
|
3800.35 |
Buy |
| STOCH(5,3) |
|
26.933 |
Sell |
| MACD(12,26,9) |
|
150.924 |
Buy |
|
|
|
|
Silver - XAG
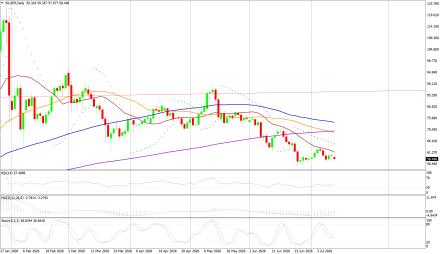
Silver on Friday its intraday high of US$60.75/oz and low of US$58.74/oz settle down by 0.151% at US$59.84/oz.
Technicals in Focus:
On daily charts, silver is sustaining above 20MA (25.05), breakage above will lead to 23.73. MACD is below the zero line and histograms are increasing trend, bringing a bullish stance in the upcoming sessions. RSI is in the oversold region, indicating a sell signal for now. The Stochastic Oscillator is in the overbought region and gives a positive crossover to show an upside move for the intraday trade.
Trading Strategy: Buy on Dips
Buy in between 57.60.00-53.00 targeting 58.40-59.00-59.90 and 61.00-61.48-62.10-63.00-63.60 with stop loss should be placed on the breakage below 53.00.
Sell in between 58.40-63.45 with a stop loss above 64.00 targeting 57.50-56.40-55.60-55.00-54.10.
|
|
| Intraday Support Levels |
| S1 |
|
|
58.00-57.70-57.50 |
| S2 |
|
|
57.00-56.40-55.60 |
| S3 |
|
|
55.00-54.00 |
| Intraday Resistance Levels |
| R1 |
|
|
58.40-59.00-59.90- |
| R2 |
|
|
61.00-61.48-62.10 |
| R3 |
|
|
63.20-63.60-64.00 |
| TECHNICAL INDICATORS |
| Name |
|
Value |
Action |
| 14DRSI |
|
46.1562 |
Buy |
| 20-DMA |
|
92.99 |
Sell |
| 50-DMA |
|
75.81 |
Sell |
| 100-DMA |
|
62.03 |
Sell |
| 200-DMA |
|
49.29 |
Sell |
| STOCH(5,3) |
|
21.094 |
Buy |
| MACD(12,26,9) |
|
5.262 |
Buy |
|
|
|
|
Oil - WTI
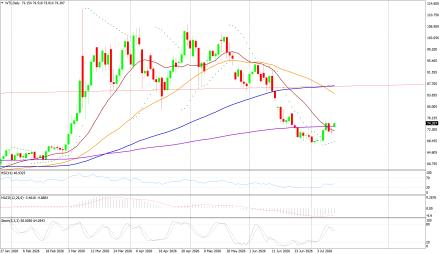
Crude Oil on high of US$62.36/bbl, an intraday low of US$58.74/bbl, and settled down by 0.151% to close at US$59.84/bbl.
Technicals in Focus:
On daily charts, oil is sustaining above its 100DMA i.e. 75.37, a support level, and breakage above will call for 77.48. MACD is above the zero line and histograms are in increasing mode will bring a bullish stance in the upcoming sessions. The Stochastic Oscillator is in the overbought region, giving a negative crossover to confirm a bearish stance; while the RSI is in the neutral region, more upsides can be expected to reach the overbought region, which is highly probable.
Trading Strategy: Neutral to Sell
Sell in between 59.10-69.10 with stop loss at 69.10 targeting 60.10-59.00-58.00-57.10 and 56.59
Buy above 58.10-54.90 with risk daily closing below 54.00, targeting 59.00-60.10-61.30-62.10-62.80 and 63.50-63.90-64.50-65.30.
|
|
| Intraday Support Levels |
| S1 |
|
|
58.00-57.10 |
| S2 |
|
|
56.59-55.90-55.40 |
| S3 |
|
|
54.90-54.50 |
| Intraday Resistance Levels |
| R1 |
|
|
59.00-60.10-59.00-61.30 |
| R2 |
|
|
62.10-62.80-63.50 |
| R3 |
|
|
63.90-64.50-65.30 |
| TECHNICAL INDICATORS |
| Name |
|
Value |
Action |
| 14DRSI |
|
29.346 |
Sell |
| 20-DMA |
|
67.35 |
Sell |
| 50-DMA |
|
69.06 |
Sell |
| 100-DMA |
|
70.28 |
Sell |
| 200-DMA |
|
71.85 |
Sell |
| STOCH(5,3) |
|
16.166 |
Sell |
| MACD(12,26,9) |
|
-1.306 |
Buy |
|
|
|
|
EUR/USD
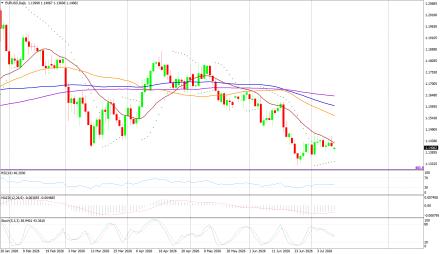
EUR/USD on Friday made an intraday low of US$1.1410/EUR, a high of US$1.1460/EUR, and settled up by 00431% to close at US$1.1438/EUR.
Technicals in Focus:
On daily charts, prices are sustaining above 100DMA (1.1661), which becomes immediate support, a break below will target 1.1695. MACD is above the zero line and histograms are increasing mode, bringing a bullish view. Stochastic is in oversold territory, giving negative crossovers to the bullish outlook for intraday. 14D RSI is currently in a neutral region and giving no directions to consider right now.
Trading Strategy: Neutral to Sell
Sell below 1.1405-1.1520, targeting 1.1370-1.1385-1.1405-1.1417 and 1.1426-1.1440-1.1465-1.1520 with stop-loss at daily closing above 1.1520.
Buy above 1.1385-1.1250 with risk below 1.1250 targeting 1.1370-1.1385-1.1405-1.1426 and 1.1440-1.1465-1.1485-1.1590.
|
|
| Intraday Support Levels |
| S1 |
|
|
1.1385-1.1370 |
| S2 |
|
|
1.1355-1.1323 |
| S3 |
|
|
1.3190-1.1360-1.1310 |
| Intraday Resistance Levels |
| R1 |
|
|
1.1405-1.1417 |
| R2 |
|
|
1.1440-1.1465-1.1485 |
| R3 |
|
|
1.1510-1.1550-1.1588 |
| TECHNICAL INDICATORS |
| Name |
|
Value |
Action |
| 14DRSI |
|
48.897 |
Buy |
| 20-DMA |
|
1.1695 |
Sell |
| 50-DMA |
|
1.1656 |
Buy |
| 100-DMA |
|
1.1661 |
Buy |
| 200-DMA |
|
1.1585 |
Buy |
| STOCH(5,3) |
|
55.688 |
Buy |
| MACD(12,26,9) |
|
-0.0013 |
|
|
|
|
|
GBP/USD
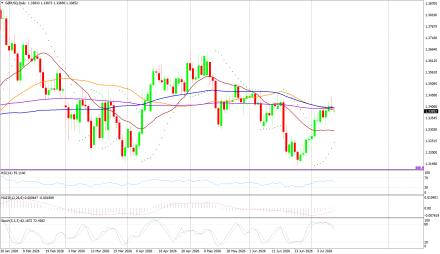
GBP/USD on Monday made a intraday low of US$1.3391/GBP, a high of US$1.3450/GBP, and settled the day down by 0.029% to close at US$1.3400/GBP.
Technicals in Focus:
On daily charts, prices are sustaining above 50DMA (1.2674) is becoming a support level. 14-D RSI is currently in a neutral region and direction is difficult to predict on an RSI basis. The Stochastic Oscillator is in oversold territory and gives a positive crossover to confirm a bullish stance. MACD is above the zero line, but histograms are increasing leading to movement.
Trading Strategy: Neutral to Buy
Based on the charts and explanations above; buy between 1.3350-1.3079 with a target of 1.3390-1.3436 and 1.3500-1.3570-1.3600-1.3640-1.3690 with a stop loss closing below 1.3150.
Sell in between 1.3390-1.3820 with targets at 1.3350-1.3300-1.3210-1.3190-1.3150 and 1.3135-1.3120-1.3100-1.3079 with a stop loss of 1.3900.
|
|
| Intraday Support Levels |
| S1 |
|
|
1.3350-1.3300-1.3270-1.3200 |
| S2 |
|
|
1.3180-1.3160-1.3135 |
| S3 |
|
|
1.3120-1.3100-1.3079 |
| Intraday Resistance Levels |
| R1 |
|
|
1.3390-1.3440-1.3490 |
| R2 |
|
|
1.3540-1.3600 1.3640 |
| R3 |
|
|
1.3700 |
| TECHNICAL INDICATORS |
| Name |
|
Value |
Action |
| 14DRSI |
|
46.905 |
Buy |
| 20-DMA |
|
1.2932 |
Buy |
| 50-DMA |
|
1.2736 |
Buy |
| 100-DMA |
|
1.2629 |
Buy |
| 200-DMA |
|
1.2811 |
Buy |
| STOCH(5,3) |
|
9.458 |
Buy |
| MACD(12,26,9) |
|
-0.003 |
Sell |
|
|
|
|
USD/JPY
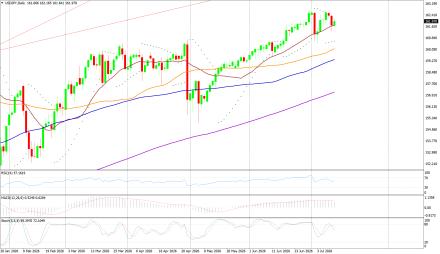
USD/JPY on Friday made an intra‐day low of JPY161.27/USD an intraday high of 162.41/USD, and settled the day down by 0.393% at JPY161.69/USD.
Technicals in Focus:
In daily charts, JPY is sustaining above 100DMA (152.35), major support on the daily chart. 14-D RSI is currently in the overbought region and chances of downward are expected based on RSI. MACD is above the zero line but histograms are decreasing mode which might lead to downward movement. The Stochastic Oscillator is in overbought territory and signaling to sell as it has given a negative crossover to confirm a bearish stance.
Trading Strategy: Neutral to Sell
Sell below 161.90-163.10 with risk above 163.10 targeting 160.70-161158.70-158.10-157.00 and 156.60-153.00-152.65-152.10.
Long positions above 161.90-152.00 with targets of 159.40-160.00 and 160.90-161.60-162.20-162.60 with stops below 148.00.
|
|
| Intraday Support Levels |
| S1 |
|
|
161.90-161.40-161.00-160.70 |
| S2 |
|
|
160.00-159.40 |
| S3 |
|
|
158.70-158.00 |
| INTRADAY RESISTANCE LEVELS |
| R1 |
|
|
162.50-162.90 |
| R2 |
|
|
163.50-164.00 |
| R3 |
|
|
164.60-165.00 |
| TECHNICAL INDICATORS |
| Name |
|
Value |
Action |
| 14DRSI |
|
41.14 |
Buy |
| 20-DMA |
|
148.91 |
Buy |
| 50-DMA |
|
150.24 |
Buy |
| 100-DMA |
|
152.53 |
Buy |
| 200-DMA |
|
151.18 |
Buy |
| STOCH(9,6) |
|
93.662 |
Sell |
| MACD(12,26,9) |
|
0.683 |
Sell |
|
|
|
 |