 |
|
|
Daily Market Lookup
- Sterling traded higher on Wednesday while the euro also gained, as a benign US CPI print took the sting out of the dollar’s upside across G10 currencies. Marino added that UBS still favours "buying USD dips," noting Fed tightening risks "have been reduced but not eliminated" and that oil prices face "upside asymmetry risk if Middle East tensions persist." Fed Chair Kevin Warsh struck a hawkish tone in Humphrey-Hawkins testimony, saying policymakers have "no tolerance for persistently elevated inflation," while Governor Christopher Waller sounded similarly cautious, stressing the need to hike if core CPI remains strong. Markets still price a 25bp hike by year-end, though the expected timing has slipped to 29 October from 16 September. Traders now look ahead to Wednesday’s PPI release and further Warsh testimony for confirmation of the disinflation trend. Sterling’s gains were not driven by domestic UK fundamentals. UBS strategist Benjamin Jarrett said recent gilt weakness, 10-year yields up 21bps and 30-year up 20bps month-to-date, "appear global in nature rather than being driven by domestic factors," with oil prices the dominant driver of the gilt-Treasury spread rather than UK-specific risk premia UBS remains "comfortable with our positive stance on GBP," citing net short positioning and Prime Minister-designate Andy Burnham’s repeated commitment to fiscal rules ahead of his formal entry to Downing Street on Monday. The euro’s move tracked the broader dollar retreat rather than any shift in ECB expectations. A durable break of the dollar-bullish view would require either a further run of soft US inflation prints or a de-escalation in the Strait of Hormuz that removes the oil-driven upside risk UBS sees as the key offset to Fed repricing.
- Gold prices fell on Thursday as renewed gains in oil prices revived concerns that inflation could remain elevated, reinforcing expectations the Federal Reserve will keep interest rates higher for longer, bolstering the dollar and reducing demand for non-yielding bullion. U.S. producer prices unexpectedly fell 0.3% in June, versus expectations for no monthly change, following softer consumer inflation data earlier this week. The back-to-back reports reinforced signs that underlying price pressures were easing and reduced expectations of an imminent Federal Reserve rate increase. However, investors largely looked through the backward-looking inflation data as renewed fighting in the Middle East pushed crude prices higher for a fourth straight session. The latest escalation has revived concerns that higher energy costs could feed into future inflation, potentially limiting the Federal Reserve's scope to ease policy despite the recent cooling in price pressures. That uncertainty has kept pressure on gold. While softer inflation would normally weaken the dollar and support bullion by reducing expectations for higher interest rates, renewed gains in oil have raised doubts about whether the recent disinflation trend can be sustained. Fed Chair Kevin Warsh reiterated this week that policymakers remain committed to returning inflation to the central bank's 2% target, while stressing they would be prepared to adjust interest rates if price pressures prove more persistent. He also downplayed concerns that heavy investment in artificial intelligence would, by itself, fuel broader inflation Elsewhere, Fed Governor Lisa Cook said she would support further policy action if inflation remained elevated, while New York Fed President John Williams said current interest rates were "well positioned" to bring inflation back toward target, underscoring that officials remain cautious despite the recent cooling in price data. Despite the softer inflation backdrop, renewed fighting in the Middle East has kept investors cautious. The United States carried out a fifth consecutive day of strikes on Iranian targets, while President Donald Trump vowed to intensify military operations until Tehran halts attacks on commercial shipping and reopens the Strait of Hormuz.
- Oil prices climbed for a fourth straight session on Thursday as the U.S. intensified military operations against Iran, stoking concerns over prolonged disruptions to shipping through the Strait of Hormuz. Both benchmarks were set for their fourth straight day of gains. They surged nearly 10% to one-month highs at the start of the week when the Iran conflict reignited Markets remained focused on the security of the Strait of Hormuz, through which roughly one-fifth of global oil and liquefied natural gas shipments normally pass. The latest gains followed a fresh wave of U.S. strikes launched on Wednesday against Iranian military targets linked to attacks on commercial shipping. Washington said the operation was aimed at degrading Iran’s ability to threaten maritime traffic in the Gulf. Tehran said it was engaged in an "existential war" with the U.S. and warned that regional energy exports could face further disruption if hostilities continue. The renewed conflict has reversed much of the optimism that followed last month’s temporary easing in tensions. Further supporting prices, the U.S. Energy Information Administration said on Wednesday crude oil inventories fell by 1.7 million barrels in the week ended July 10, largely in line with expectations. Gasoline stockpiles declined by 1.5 million barrels as peak summer driving demand remained firm. Distillate inventories, however, unexpectedly rose by 4.6 million barrels. The International Energy Agency said in its July Oil Market Report that while oil flows through the Strait had partially recovered in June, renewed hostilities this month have clouded the outlook and could derail expectations for a return to surplus in 2027.
|
|
| Intraday RESISTANCE LEVELS |
| 16th July 2026 |
R1 |
R2 |
R3 |
| GOLD-XAU |
4056-4085-4100-4132 |
4144-4160-4188 |
4200-4214-4268 |
| Silver-XAG |
57.50-57.70-58.00 |
58.40-59.00-59.90- |
61.00-61.48-62.10 |
| Crude Oil |
80.10-81.00 |
81.78-82.55-83.00 |
84.05-84.90 |
| EURO/USD |
1.1465-1.1485 |
1.1510-1.1550-1.1588 |
1.1610-1.1650 |
| GBP/USD |
1.3540-1.3600 1.3640 |
1.3670-1.3700-1.3730 |
1.3760-1.3800 |
| USD/JPY |
162.50-162.90 |
163.50-164.00 |
164.60-165.00 |
| Intraday SUPPORTS LEVELS |
| 16th July 2026 |
S1 |
S2 |
S3 |
| GOLD-XAU |
4028-4017-3990 |
3958-3942 |
3920-3900 |
| Silver-XAG |
57.00-56.40-55.60 |
55.00-54.00-53.30 |
52.50-51.90 |
| Crude Oil |
79.00-78.00-77.60 |
76.50-75.70-75.00 |
74.20-73.54 |
| EURO/USD |
1.1440-1.1405-1.1385 |
1.1370-1.1355-1.1323 |
1.1390-1.1360-1.1310 |
| GBP/USD |
1.3520-1.3490-1.3440 |
1.3390-1.3350 |
1.3300-1.3270-1.3200 |
| USD/JPY |
161.90-161.40-161.00-160.70 |
160.00-159.40 |
158.70-158.00 |
|
|
| Intra-Day Strategy (16th July 2026) |
| GOLD-XAU |
Sell on Strength |
| Silver-XAG |
Buy on Dips |
|
| Crude Oil |
Neutral to Sell |
| EUR/USD |
Neutral to Sell |
|
| GBP/USD |
Neutral to Buy |
| USD/JPY |
Neutral to Sell |
|
|
|
|
Gold – XAU
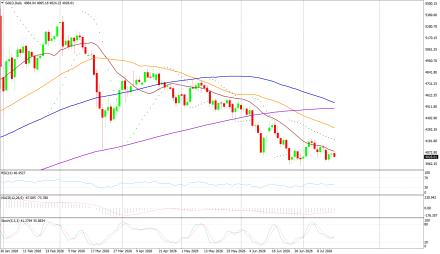
Gold on Wednesday interaday high of US$4134.71/oz and low of $4072.73/oz. God is down by 0.092% at US$4001.55/oz.
Technicals in Focus:
On the daily charts, gold trades higher than 20DMA (2197). If it drops below this level, it could lead to 2,100. The MACD is currently above the zero line and the histograms are showing an increasing trend, indicating that there may be upward movement in the coming sessions. The RSI is currently at 83.04, which is in the overbought region, suggesting there may be selling pressure in the next 2 to 3 sessions. The Stochastic Oscillator is also in the overbought territory but has given a positive crossover, indicating a bullish stance for intraday trades, but rebound in expected in all the overbought indicators.
Trading Strategy: Sell on Strength
Sell below 4050-4400 keeping stop loss closing above 4400, targeting 4066-4023-3990-3974-3958. Buy in between 4020-3958 with risk below 3866 targeting 4085-4100-4144-4160-4188-4200-4224 and 4268-4280-4294-4310. |
|
| Intraday Support Levels |
| S1 |
|
|
4028-4017-3990 |
| S2 |
|
|
3958-3942 |
| S3 |
|
|
3920-3900 |
| Intraday Resistance Levels |
| R1 |
|
|
4056-4085-4100-4132 |
| R2 |
|
|
4144-4160-4188 |
| R3 |
|
|
4200-4214-4268 |
| Technical Indicators
|
| Name |
|
Value |
Action |
| 14DRSI |
|
52.916 |
Buy |
| 20-DMA |
|
4800.67 |
Buy |
| 50-DMA |
|
4497.76 |
Buy |
| 100-DMA |
|
4239.36 |
Buy |
| 200-DMA |
|
3800.35 |
Buy |
| STOCH(5,3) |
|
26.933 |
Sell |
| MACD(12,26,9) |
|
150.924 |
Buy |
|
|
|
|
Silver - XAG
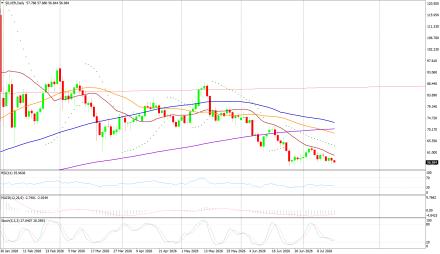
Silver on Wednesday its intraday high of US$59.05/oz and low of US$56.60/oz settle down by 1.567% at US$57.75/oz.
Technicals in Focus:
On daily charts, silver is sustaining above 20MA (25.05), breakage above will lead to 23.73. MACD is below the zero line and histograms are increasing trend, bringing a bullish stance in the upcoming sessions. RSI is in the oversold region, indicating a sell signal for now. The Stochastic Oscillator is in the overbought region and gives a positive crossover to show an upside move for the intraday trade.
Trading Strategy: Buy on Dips
Buy in between 57.00.00-53.00 targeting 58.40-59.00-59.90 and 61.00-61.48-62.10-63.00-63.60 with stop loss should be placed on the breakage below 53.00.
Sell in between 57.40-63.45 with a stop loss above 64.00 targeting 57.50-56.40-55.60-55.00-54.10.
|
|
| Intraday Support Levels |
| S1 |
|
|
57.00-56.40-55.60 |
| S2 |
|
|
55.00-54.00-53.30 |
| S3 |
|
|
52.50-51.90 |
| Intraday Resistance Levels |
| R1 |
|
|
57.50-57.70-58.00 |
| R2 |
|
|
58.40-59.00-59.90- |
| R3 |
|
|
61.00-61.48-62.10 |
| TECHNICAL INDICATORS |
| Name |
|
Value |
Action |
| 14DRSI |
|
46.1562 |
Buy |
| 20-DMA |
|
92.99 |
Sell |
| 50-DMA |
|
75.81 |
Sell |
| 100-DMA |
|
62.03 |
Sell |
| 200-DMA |
|
49.29 |
Sell |
| STOCH(5,3) |
|
21.094 |
Buy |
| MACD(12,26,9) |
|
5.262 |
Buy |
|
|
|
|
Oil - WTI
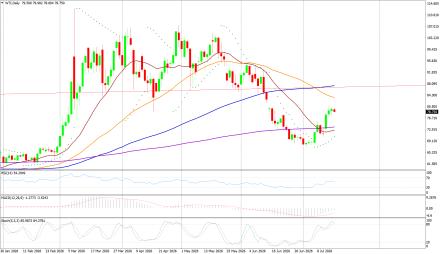
Crude Oil on Wednesday high of US$80.14/bbl, an intraday low of US$77.77/bbl, and settled up by 0.942% to close at US$79.70/bbl.
Technicals in Focus:
On daily charts, oil is sustaining above its 100DMA i.e. 75.37, a support level, and breakage above will call for 77.48. MACD is above the zero line and histograms are in increasing mode will bring a bullish stance in the upcoming sessions. The Stochastic Oscillator is in the overbought region, giving a negative crossover to confirm a bearish stance; while the RSI is in the neutral region, more upsides can be expected to reach the overbought region, which is highly probable.
Trading Strategy: Neutral to Sell
Sell in between 80.10-85.10 with stop loss at 86.00 targeting 79.00-78.00-77.60-76.50 and 75.70-75.00-74.20
Buy above 9.000-72.90 with risk daily closing below 54.00, targeting 59.00-60.10-61.30-62.10-62.80 and 63.50-63.90-64.50-65.30.
|
|
| Intraday Support Levels |
| S1 |
|
|
79.00-78.00-77.60 |
| S2 |
|
|
76.50-75.70-75.00 |
| S3 |
|
|
74.20-73.54 |
| Intraday Resistance Levels |
| R1 |
|
|
80.10-81.00 |
| R2 |
|
|
81.78-82.55-83.00 |
| R3 |
|
|
84.05-84.90 |
| TECHNICAL INDICATORS |
| Name |
|
Value |
Action |
| 14DRSI |
|
29.346 |
Sell |
| 20-DMA |
|
67.35 |
Sell |
| 50-DMA |
|
69.06 |
Sell |
| 100-DMA |
|
70.28 |
Sell |
| 200-DMA |
|
71.85 |
Sell |
| STOCH(5,3) |
|
16.166 |
Sell |
| MACD(12,26,9) |
|
-1.306 |
Buy |
|
|
|
|
EUR/USD
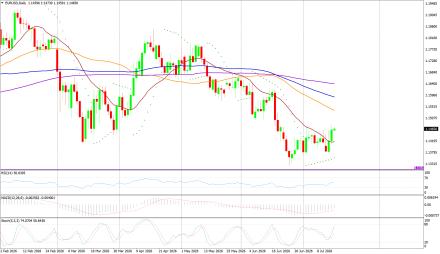
EUR/USD on Wednesday made an intraday low of US$1.1405/EUR, a high of US$1.1445/EUR, and settled down by 0.180% to close at US$1.1462/EUR.
Technicals in Focus:
On daily charts, prices are sustaining above 100DMA (1.1661), which becomes immediate support, a break below will target 1.1695. MACD is above the zero line and histograms are increasing mode, bringing a bullish view. Stochastic is in oversold territory, giving negative crossovers to the bullish outlook for intraday. 14D RSI is currently in a neutral region and giving no directions to consider right now.
Trading Strategy: Neutral to Sell
Sell below 1.1465-1.1650, targeting 1.1405-1.1370-1.1355 and 1.1323-1.1390-1.1360-1.1310 with stop-loss at daily closing above 1.1520.
Buy above 1.1440-1.1250 with risk below 1.1250 targeting 1.1440-1.1465-1.1485-1.1590 and 1.1610-1.1650.
|
|
| Intraday Support Levels |
| S1 |
|
|
1.1440-1.1405-1.1385 |
| S2 |
|
|
1.1370-1.1355-1.1323 |
| S3 |
|
|
1.1390-1.1360-1.1310 |
| Intraday Resistance Levels |
| R1 |
|
|
1.1465-1.1485 |
| R2 |
|
|
1.1510-1.1550-1.1588 |
| R3 |
|
|
1.1610-1.1650 |
| TECHNICAL INDICATORS |
| Name |
|
Value |
Action |
| 14DRSI |
|
48.897 |
Buy |
| 20-DMA |
|
1.1695 |
Sell |
| 50-DMA |
|
1.1656 |
Buy |
| 100-DMA |
|
1.1661 |
Buy |
| 200-DMA |
|
1.1585 |
Buy |
| STOCH(5,3) |
|
55.688 |
Buy |
| MACD(12,26,9) |
|
-0.0013 |
|
|
|
|
|
GBP/USD
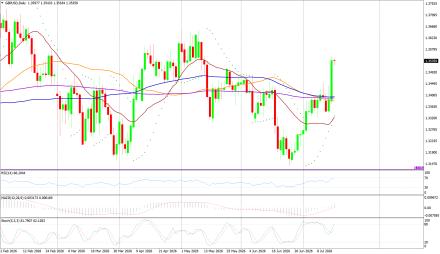
GBP/USD on Wednesday made a intraday low of US$1.3373/GBP, a high of US$1.3357/GBP, and settled the day up by 1.154% to close at US$1.3537/GBP.
Technicals in Focus:
On daily charts, prices are sustaining above 50DMA (1.2674) is becoming a support level. 14-D RSI is currently in a neutral region and direction is difficult to predict on an RSI basis. The Stochastic Oscillator is in oversold territory and gives a positive crossover to confirm a bullish stance. MACD is above the zero line, but histograms are increasing leading to movement.
Trading Strategy: Neutral to Buy
Based on the charts and explanations above; buy between 1.3520-1.3079 with a target of 1.3540-1.3570-1.3600-1.3640-1.3690 with a stop loss closing below 1.3150.
Sell in between 1.3390-1.3820 with targets at 1.3350-1.3300-1.3210-1.3190-1.3150 and 1.3135-1.3120-1.3100-1.3079 with a stop loss of 1.3900.
|
|
| Intraday Support Levels |
| S1 |
|
|
1.3520-1.3490-1.3440 |
| S2 |
|
|
1.3390-1.3350 |
| S3 |
|
|
1.3300-1.3270-1.3200 |
| Intraday Resistance Levels |
| R1 |
|
|
1.3540-1.3600 1.3640 |
| R2 |
|
|
1.3670-1.3700-1.3730 |
| R3 |
|
|
1.3760-1.3800 |
| TECHNICAL INDICATORS |
| Name |
|
Value |
Action |
| 14DRSI |
|
46.905 |
Buy |
| 20-DMA |
|
1.2932 |
Buy |
| 50-DMA |
|
1.2736 |
Buy |
| 100-DMA |
|
1.2629 |
Buy |
| 200-DMA |
|
1.2811 |
Buy |
| STOCH(5,3) |
|
9.458 |
Buy |
| MACD(12,26,9) |
|
-0.003 |
Sell |
|
|
|
|
USD/JPY
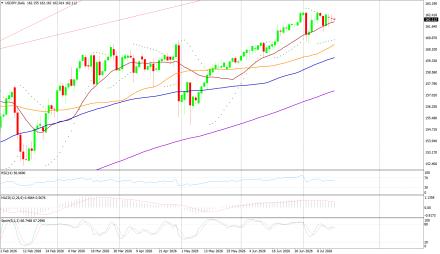
USD/JPY on Wednesday made an intra‐day low of JPY161.88/USD an intraday high of 162.41/USD, and settled the day down by 0.016% at JPY162.17/USD.
Technicals in Focus:
In daily charts, JPY is sustaining above 100DMA (152.35), major support on the daily chart. 14-D RSI is currently in the overbought region and chances of downward are expected based on RSI. MACD is above the zero line but histograms are decreasing mode which might lead to downward movement. The Stochastic Oscillator is in overbought territory and signaling to sell as it has given a negative crossover to confirm a bearish stance.
Trading Strategy: Neutral to Sell
Sell below 162.50-165.10 with risk above 163.10 targeting 161.90-161.00-160.70-159.40-158.70 and 158.10-157.00-156.60.
Long positions above 161.90-152.00 with targets of 162.60-163.00-163.50 and 164.00-164.60-165.00 with stops below 152.00.
|
|
| Intraday Support Levels |
| S1 |
|
|
161.90-161.40-161.00-160.70 |
| S2 |
|
|
160.00-159.40 |
| S3 |
|
|
158.70-158.00 |
| INTRADAY RESISTANCE LEVELS |
| R1 |
|
|
162.50-162.90 |
| R2 |
|
|
163.50-164.00 |
| R3 |
|
|
164.60-165.00 |
| TECHNICAL INDICATORS |
| Name |
|
Value |
Action |
| 14DRSI |
|
41.14 |
Buy |
| 20-DMA |
|
148.91 |
Buy |
| 50-DMA |
|
150.24 |
Buy |
| 100-DMA |
|
152.53 |
Buy |
| 200-DMA |
|
151.18 |
Buy |
| STOCH(9,6) |
|
93.662 |
Sell |
| MACD(12,26,9) |
|
0.683 |
Sell |
|
|
|
 |