 |
|
|
Daily Market Lookup
- The U.S. dollar on Thursday was on track to snap a two-day losing streak, as monetary policy outlook was clouded after a Federal Reserve regional president called for "modestly higher" interest rates. The greenback had fallen over the last two sessions after economic data showed a moderation in U.S. consumer and producer inflation. urrency market participants and watchers of monetary policy have been keenly focused on this week’s U.S. economic calendar for interest rate cues. Earlier this week softer-than-anticipated U.S. consumer price index (CPI) and producer price index (PPI) reports for June arrived. On Thursday, data from the U.S. Census Bureau showed retail sales ticking up 0.2% M/M in June to $768.6 billion, matching expectations. Retail sales from gasoline stations slipped 5.3% M/M in June to $60.6 billion, as global oil prices slumped following the signing of an interim peace deal between the U.S. and Iran. Separately, the U.S. Department of Labor said the number of Americans filing for initial jobless claims in the past week fell to 208k, lower than the consensus estimate of 216k. The reading pointed at continued resilience in the labor market. The combination of easing price pressures and gasoline station retail sales suggests some breathing room for the Fed in terms of not having to immediately hike interest rates. According to the CME FedWatch tool, the odds of a quarter-point rate hike at the end of the July 28-29 meeting have fallen significantly from a week ago. But some comments from Dallas Fed President Lorie Logan later on Thursday cast a hawkish spell. The inflation dynamic has been further complicated this month by the biggest escalation in tensions between Washington and Tehran since they inked their interim agreement in mid-June. Oil prices have posted double-digit percentage gains this week as a result, with Brent crude futures, the global benchmark, having soared more than 11%.
- The U.S. military on Thursday said it was conducting a new wave of strikes against Iran, the latest in a sustained bombardment for five consecutive nights. The fresh fighting erupted after reported Iranian attacks on commercial tanker ships in and around the Strait of Hormuz, leading to a collapse in the ceasefire between the two sides. President Donald Trump has vowed further attacks on Iranian infrastructure if Tehran doesn’t come to the negotiating table. Iran’s state media on Thursday said the country would not allow the U.S. to interfere in the strait, citing comments made by the Islamic Revolutionary Guard Corps’ spokesperson, who called the vital waterway an "invincible red line" and warned of a response if infrastructure was targeted. Turning to other major currencies, the sterling was in focus after posting its best day since March 19 in the previous session. It had been buoyed by reports that incoming Prime Minister Andy Burnham was poised to name interior minister Shabana Mahmood as his next Chancellor of the Exchequer when he formally takes office next week. UK markets welcomed the prospect. Investors had previously grown highly uneasy over a fierce internal Labour briefing war, fearing the powerful Treasury post might instead go to the more left-leaning energy minister, Ed Miliband. A potential Miliband appointment was viewed as a threat to rigid fiscal discipline, given his past willingness to challenge orthodox Treasury spending rules. The sterling slipped 0.5% to $1.3470 on Thursday, giving back some gains after the sharp advance. Earlier, the Office for National Statistics said monthly UK real gross domestic product was estimated to have increased 0.1% in May, returning to growth after a 0.1% contraction in April, which had been the first fall since October 2025.
- Oil prices rose on Friday after the U.S. and Iran stepped up attacks across the Gulf, with their broken truce limiting oil flows out of the Strait of Hormuz and with Tehran asking the Houthi political and military organisation to stand ready to shut the Red Sea export route. Both benchmark contracts have climbed nearly 12% this week, with Brent on track for a third consecutive weekly gain and WTI on pace for a second weekly gain. For the first time since a memorandum of understanding paused fighting last month, the U.S. launched two major waves of air strikes in a single day on Wednesday, mostly at targets near Iran’s southern coast. It kept firing on Thursday. Meanwhile, Qatar’s defence ministry said its armed forces thwarted an Iranian missile attack early on Friday, while the interior ministry said a child was injured by shrapnel resulting from interception operations. In a statement, the U.S. Central Command said American forces began "a new wave of strikes against Iran for the sixth consecutive night to further degrade Iranian military capabilities" at 2 p.m. EDT (1800 GMT), or 9:30 p.m. in Tehran. Tehran has countered with missiles and drones aimed at U.S. military bases in neighbouring states, including a barrage at a recently expanded air base in Jordan. Adding to oil supply concerns, Iran’s leadership has told its Houthi allies to be prepared to close the Red Sea oil route if the U.S. strikes Iranian power infrastructure, three sources told Reuters. IG analysts said technically, WTI could test the mid-$80s if it holds above key support in the mid-$70s.
|
|
| Intraday RESISTANCE LEVELS |
| 17th July 2026 |
R1 |
R2 |
R3 |
| GOLD-XAU |
4017-4028-4056-4085 |
4100-4132-4144 |
4160-4188-4200 |
| Silver-XAG |
55.60-56.40-57.00 |
57.50-57.70-58.00 |
58.40-59.00-59.90 |
| Crude Oil |
80.10-81.00 |
81.78-82.55-83.00 |
84.05-84.90 |
| EURO/USD |
1.1465-1.1485 |
1.1510-1.1550-1.1588 |
1.1610-1.1650 |
| GBP/USD |
1.3490-1.3520 |
1.3540-1.3600 1.3640 |
1.3670-1.3700-1.3730 |
| USD/JPY |
162.50-162.90 |
163.50-164.00 |
164.60-165.00 |
| Intraday SUPPORTS LEVELS |
| 17th July 2026 |
S1 |
S2 |
S3 |
| GOLD-XAU |
3990-3974 |
3958-3942 |
3920-3900 |
| Silver-XAG |
55.00-54.00-53.30 |
52.50-51.90 |
51.50-50.90 |
| Crude Oil |
79.00-78.00-77.60 |
76.50-75.70-75.00 |
74.20-73.54 |
| EURO/USD |
1.1440-1.1405-1.1385 |
1.1370-1.1355-1.1323 |
1.1390-1.1360-1.1310 |
| GBP/USD |
1.3440-1.3390-1.3350 |
1.3315-1.3290-1.3270 |
1.3300-1.3270-1.3200 |
| USD/JPY |
161.90-161.40-161.00-160.70 |
160.00-159.40 |
158.70-158.00 |
|
|
| Intra-Day Strategy (17th July 2026) |
| GOLD-XAU |
Sell on Strength |
| Silver-XAG |
Buy on Dips |
|
| Crude Oil |
Neutral to Sell |
| EUR/USD |
Neutral to Sell |
|
| GBP/USD |
Neutral to Buy |
| USD/JPY |
Neutral to Sell |
|
|
|
|
Gold – XAU
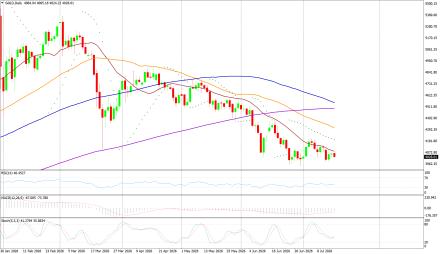
Gold on Thursday interaday high of US$4065.18/oz and low of $3969.35/oz. God is down by 2.19% at US$3975.86/oz.
Technicals in Focus:
On the daily charts, gold trades higher than 20DMA (2197). If it drops below this level, it could lead to 2,100. The MACD is currently above the zero line and the histograms are showing an increasing trend, indicating that there may be upward movement in the coming sessions. The RSI is currently at 83.04, which is in the overbought region, suggesting there may be selling pressure in the next 2 to 3 sessions. The Stochastic Oscillator is also in the overbought territory but has given a positive crossover, indicating a bullish stance for intraday trades, but rebound in expected in all the overbought indicators.
Trading Strategy: Sell on Strength
Sell below 4010-4400 keeping stop loss closing above 4400, targeting 3990-3974-3958 and 3942-3920-3900. Buy in between 3990-3900 with risk below 3866 targeting 4017-4028-4056-4085 and 4100-4144-4160-4188-4200. |
|
| Intraday Support Levels |
| S1 |
|
|
3990-3974 |
| S2 |
|
|
3958-3942 |
| S3 |
|
|
3920-3900 |
| Intraday Resistance Levels |
| R1 |
|
|
4017-4028-4056-4085 |
| R2 |
|
|
4100-4132-4144 |
| R3 |
|
|
4160-4188-4200 |
| Technical Indicators
|
| Name |
|
Value |
Action |
| 14DRSI |
|
52.916 |
Buy |
| 20-DMA |
|
4800.67 |
Buy |
| 50-DMA |
|
4497.76 |
Buy |
| 100-DMA |
|
4239.36 |
Buy |
| 200-DMA |
|
3800.35 |
Buy |
| STOCH(5,3) |
|
26.933 |
Sell |
| MACD(12,26,9) |
|
150.924 |
Buy |
|
|
|
|
Silver - XAG
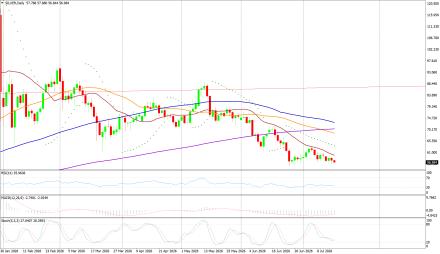
Silver on Thursday its intraday high of US$57.88/oz and low of US$55.31/oz settle down by 1.567% at US$55.49/oz.
Technicals in Focus:
On daily charts, silver is sustaining above 20MA (25.05), breakage above will lead to 23.73. MACD is below the zero line and histograms are increasing trend, bringing a bullish stance in the upcoming sessions. RSI is in the oversold region, indicating a sell signal for now. The Stochastic Oscillator is in the overbought region and gives a positive crossover to show an upside move for the intraday trade.
Trading Strategy: Buy on Dips
Buy in between 55.00.00-51.00 targeting 55.60-56.40-57.00-57.70 and 58.40-59.00-59.90-61.00-61.48 with stop loss should be placed on the breakage below 53.00.
Sell in between 55.40-63.45 with a stop loss above 64.00 targeting 55.00-54.10-53.30-52.50 and 51.90-51.50-50.90.
|
|
| Intraday Support Levels |
| S1 |
|
|
55.00-54.00-53.30 |
| S2 |
|
|
52.50-51.90 |
| S3 |
|
|
51.50-50.90 |
| Intraday Resistance Levels |
| R1 |
|
|
55.60-56.40-57.00 |
| R2 |
|
|
57.50-57.70-58.00 |
| R3 |
|
|
58.40-59.00-59.90 |
| TECHNICAL INDICATORS |
| Name |
|
Value |
Action |
| 14DRSI |
|
46.1562 |
Buy |
| 20-DMA |
|
92.99 |
Sell |
| 50-DMA |
|
75.81 |
Sell |
| 100-DMA |
|
62.03 |
Sell |
| 200-DMA |
|
49.29 |
Sell |
| STOCH(5,3) |
|
21.094 |
Buy |
| MACD(12,26,9) |
|
5.262 |
Buy |
|
|
|
|
Oil - WTI
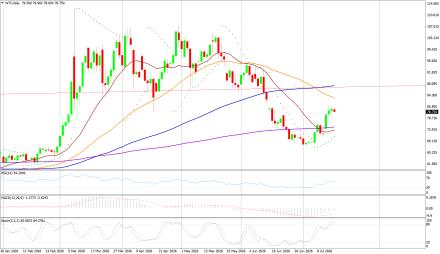
Crude Oil on Thursday high of US$80.26/bbl, an intraday low of US$77.98/bbl, and settled down by 0.796% to close at US$78.86/bbl.
Technicals in Focus:
On daily charts, oil is sustaining above its 100DMA i.e. 75.37, a support level, and breakage above will call for 77.48. MACD is above the zero line and histograms are in increasing mode will bring a bullish stance in the upcoming sessions. The Stochastic Oscillator is in the overbought region, giving a negative crossover to confirm a bearish stance; while the RSI is in the neutral region, more upsides can be expected to reach the overbought region, which is highly probable.
Trading Strategy: Neutral to Sell
Sell in between 80.10-85.10 with stop loss at 86.00 targeting 79.00-78.00-77.60-76.50 and 75.70-75.00-74.20
Buy above 9.000-72.90 with risk daily closing below 54.00, targeting 59.00-60.10-61.30-62.10-62.80 and 63.50-63.90-64.50-65.30.
|
|
| Intraday Support Levels |
| S1 |
|
|
79.00-78.00-77.60 |
| S2 |
|
|
76.50-75.70-75.00 |
| S3 |
|
|
74.20-73.54 |
| Intraday Resistance Levels |
| R1 |
|
|
80.10-81.00 |
| R2 |
|
|
81.78-82.55-83.00 |
| R3 |
|
|
84.05-84.90 |
| TECHNICAL INDICATORS |
| Name |
|
Value |
Action |
| 14DRSI |
|
29.346 |
Sell |
| 20-DMA |
|
67.35 |
Sell |
| 50-DMA |
|
69.06 |
Sell |
| 100-DMA |
|
70.28 |
Sell |
| 200-DMA |
|
71.85 |
Sell |
| STOCH(5,3) |
|
16.166 |
Sell |
| MACD(12,26,9) |
|
-1.306 |
Buy |
|
|
|
|
EUR/USD
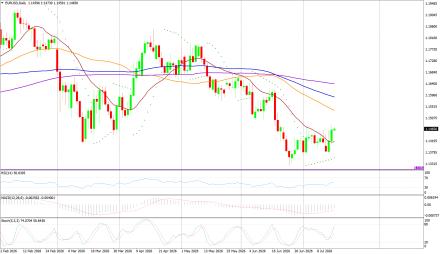
EUR/USD on Thursday made an intraday low of US$1.1430/EUR, a high of US$1.1475/EUR, and settled down by 0.151% to close at US$1.1442/EUR.
Technicals in Focus:
On daily charts, prices are sustaining above 100DMA (1.1661), which becomes immediate support, a break below will target 1.1695. MACD is above the zero line and histograms are increasing mode, bringing a bullish view. Stochastic is in oversold territory, giving negative crossovers to the bullish outlook for intraday. 14D RSI is currently in a neutral region and giving no directions to consider right now.
Trading Strategy: Neutral to Sell
Sell below 1.1465-1.1650, targeting 1.1405-1.1370-1.1355 and 1.1323-1.1390-1.1360-1.1310 with stop-loss at daily closing above 1.1520.
Buy above 1.1440-1.1250 with risk below 1.1250 targeting 1.1440-1.1465-1.1485-1.1590 and 1.1610-1.1650.
|
|
| Intraday Support Levels |
| S1 |
|
|
1.1440-1.1405-1.1385 |
| S2 |
|
|
1.1370-1.1355-1.1323 |
| S3 |
|
|
1.1390-1.1360-1.1310 |
| Intraday Resistance Levels |
| R1 |
|
|
1.1465-1.1485 |
| R2 |
|
|
1.1510-1.1550-1.1588 |
| R3 |
|
|
1.1610-1.1650 |
| TECHNICAL INDICATORS |
| Name |
|
Value |
Action |
| 14DRSI |
|
48.897 |
Buy |
| 20-DMA |
|
1.1695 |
Sell |
| 50-DMA |
|
1.1656 |
Buy |
| 100-DMA |
|
1.1661 |
Buy |
| 200-DMA |
|
1.1585 |
Buy |
| STOCH(5,3) |
|
55.688 |
Buy |
| MACD(12,26,9) |
|
-0.0013 |
|
|
|
|
|
GBP/USD
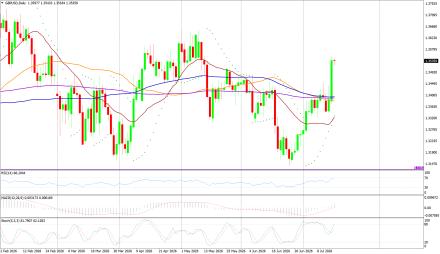
GBP/USD on Thursday made a intraday low of US$1.3458/GBP, a high of US$1.3543/GBP, and settled the day down by 0.443% to close at US$1.3477/GBP.
Technicals in Focus:
On daily charts, prices are sustaining above 50DMA (1.2674) is becoming a support level. 14-D RSI is currently in a neutral region and direction is difficult to predict on an RSI basis. The Stochastic Oscillator is in oversold territory and gives a positive crossover to confirm a bullish stance. MACD is above the zero line, but histograms are increasing leading to movement.
Trading Strategy: Neutral to Buy
Based on the charts and explanations above; buy between 1.3440-1.3079 with a target of 1.3490-1.3520-1.3540-1.3570 and 1.3600-1.3640-1.3690 with a stop loss closing below 1.3150.
Sell in between 1.3390-1.3820 with targets at 1.3350-1.3300-1.3210-1.3190-1.3150 and 1.3135-1.3120-1.3100-1.3079 with a stop loss of 1.3900.
|
|
| Intraday Support Levels |
| S1 |
|
|
1.3440-1.3390-1.3350 |
| S2 |
|
|
1.3315-1.3290-1.3270 |
| S3 |
|
|
1.3300-1.3270-1.3200 |
| Intraday Resistance Levels |
| R1 |
|
|
1.3490-1.3520 |
| R2 |
|
|
1.3540-1.3600 1.3640 |
| R3 |
|
|
1.3670-1.3700-1.3730 |
| TECHNICAL INDICATORS |
| Name |
|
Value |
Action |
| 14DRSI |
|
46.905 |
Buy |
| 20-DMA |
|
1.2932 |
Buy |
| 50-DMA |
|
1.2736 |
Buy |
| 100-DMA |
|
1.2629 |
Buy |
| 200-DMA |
|
1.2811 |
Buy |
| STOCH(5,3) |
|
9.458 |
Buy |
| MACD(12,26,9) |
|
-0.003 |
Sell |
|
|
|
|
USD/JPY
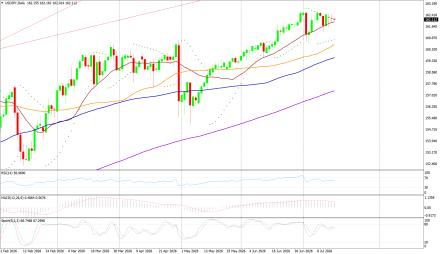
USD/JPY on Wednesday made an intra‐day low of JPY161.88/USD an intraday high of 162.41/USD, and settled the day down by 0.016% at JPY162.17/USD.
Technicals in Focus:
In daily charts, JPY is sustaining above 100DMA (152.35), major support on the daily chart. 14-D RSI is currently in the overbought region and chances of downward are expected based on RSI. MACD is above the zero line but histograms are decreasing mode which might lead to downward movement. The Stochastic Oscillator is in overbought territory and signaling to sell as it has given a negative crossover to confirm a bearish stance.
Trading Strategy: Neutral to Sell
Sell below 162.50-165.10 with risk above 163.10 targeting 161.90-161.00-160.70-159.40-158.70 and 158.10-157.00-156.60.
Long positions above 161.90-152.00 with targets of 162.60-163.00-163.50 and 164.00-164.60-165.00 with stops below 152.00.
|
|
| Intraday Support Levels |
| S1 |
|
|
161.90-161.40-161.00-160.70 |
| S2 |
|
|
160.00-159.40 |
| S3 |
|
|
158.70-158.00 |
| INTRADAY RESISTANCE LEVELS |
| R1 |
|
|
162.50-162.90 |
| R2 |
|
|
163.50-164.00 |
| R3 |
|
|
164.60-165.00 |
| TECHNICAL INDICATORS |
| Name |
|
Value |
Action |
| 14DRSI |
|
41.14 |
Buy |
| 20-DMA |
|
148.91 |
Buy |
| 50-DMA |
|
150.24 |
Buy |
| 100-DMA |
|
152.53 |
Buy |
| 200-DMA |
|
151.18 |
Buy |
| STOCH(9,6) |
|
93.662 |
Sell |
| MACD(12,26,9) |
|
0.683 |
Sell |
|
|
|
 |