 |
|
|
Daily Market Lookup
- The U.S. dollar on Friday was on track for a weekly loss, after economic data pointed to a moderation in price pressures and prompted traders to scale back expectations for near-term Federal Reserve rate hikes. Losses were capped by hawkish comments from a central bank speaker and a tense situation in the Middle East. The biggest escalation between Washington and Iran initially prompted safe-haven flows at the start of the week, but for currency market participants, the focus was on key inflation data. The headline U.S. consumer price index (CPI) and producer price index (PPI) readings moderated on a monthly basis in June, while gasoline station retail sales fell. University of Michigan data, meanwhile, showed July consumer sentiment hitting its highest level since February, and a fall in year-ahead inflation expectations. The deluge of data indicated some breathing room for the Federal Reserve in terms of not immediately hiking interest rates, weighing on the dollar. Higher rate environments tend to strengthen the greenback. Inflationary dynamics have rapidly shifted this week, however, as oil prices have spiked amid the fresh fighting between the U.S. and Iran. A host of Fed speakers noted that other factors such as artificial intelligence-related demand were also boosting inflation. Notably, Dallas Fed President Lorie Logan on Thursday called for "modestly higher" interest rates. Turning to other currencies, the sterling eked out fresh gains this week after incoming Prime Minister Andy Burnham’s reported selection of a centrist for chancellor of the Exchequer helped soothe financial market anxiety regarding the United Kingdom’s future fiscal trajectory. Sterling, which slipped 0.2% on the day, stood out as a primary beneficiary of the week’s thematic shifts, capitalizing on both the weaker dollar and an easing of domestic political uncertainty. Investor nerves regarding London’s budgetary and fiscal health were significantly calmed by reports that incoming Premier Andy Burnham - set to take office on Monday - is poised to appoint Home Secretary Shabana Mahmood to lead the Treasury. The prospective pick of Mahmood, viewed by the City of London as a fiscal pragmatist from the party’s right wing, successfully sidelined market fears that a more economically radical appointment might trigger unhedged public borrowing or sudden policy shifts. Adding to the shifting central bank narrative, final data from Eurostat on Friday confirmed that inflation in the eurozone slowed significantly to 2.8% in the twelve months to June, dropping from 3.2% in the prior month. The cooling consumer price metrics temporarily eased pressure on European policymakers by marking a distinct deceleration in domestic costs. However, currency traders kept the single currency relatively well-supported despite the softer print, as the broader retreat in the greenback allowed the euro to capitalize on global dollar weakness. The euro’s structural resilience is also being anchored by the upcoming European Central Bank monetary policy meeting next week. While the drop in consumer price growth to 2.8% provides breathing room for Frankfurt, continental traders remain highly alert to the volatile geopolitical landscape. Ongoing energy supply anxieties stemming from the Middle East have prevented money markets from completely dismissing a more hawkish monetary path down the road, leaving the euro trading in a firm position heading into the weekend.
- Oil prices rose sharply in early Asian trade on Monday after the U.S. and Iran traded a series of escalating strikes over the weekend, sparking fears of a wider war and more oil supply disruptions in the Middle East. Crude prices jumped after the U.S. and Iran traded a slew of strikes over the weekend, with U.S. Central Command stating it had launched more attacks against Iran on Sunday evening. The new strikes came after Iranian attacks on a U.S. base in Jordan killed at least two U.S. troops and injured many others. The American military was seen striking a broader range of targets in Iran, while Iran also ramped up its strikes on surrounding Gulf countries. The fighting still remained focused on control of the Strait of Hormuz, with CENTCOM stating that its latest strikes were aimed at a continued degradation of Iranian military capabilities used to attack shipping in Hormuz. The renewed fighting presents the worst U.S.-Iran hostilities since just before their April ceasefire, with peace talks between the two sides now appearing to have entirely collapsed. Shipping through Hormuz remained largely disrupted and back at a fraction of pre-war levels, keeping markets on edge over more oil supply disruptions and pricing in a greater risk premium into the commodity.
- Gold prices slipped below the key $4,000-an-ounce level on Monday as escalating U.S.-Iran hostilities drove oil prices higher, reinforcing concerns that inflation could keep the Federal Reserve on a restrictive policy path Gold remained under pressure after sliding more than 2% last week as investors assessed whether renewed conflict in the Middle East would keep inflationary pressures elevated despite recent signs of cooling U.S. price growth. Brent crude climbed above $90 a barrel after the United States and Iran intensified military operations over the weekend. The latest escalation included an attack on a key oil facility in Kuwait and strikes targeting vessels attempting to transit the Strait of Hormuz, fuelling fresh concerns over global energy supplies. Tehran said the ceasefire between the United States and Iran had effectively collapsed, raising the risk of prolonged disruptions through one of the world’s most important oil shipping routes. The conflict, now in its fifth month, has lifted prices across energy and industrial commodities, while uncertainty surrounding U.S. President Donald Trump’s strategy toward Iran has left investors focused on the potential economic fallout. Recent U.S. inflation and labour-market data have pointed to a softer economic backdrop, but investors remain focused on whether rising energy costs could complicate the Federal Reserve’s inflation fight. Higher oil prices have renewed concerns that inflation could remain above the Federal Reserve’s target, potentially forcing policymakers to keep monetary policy restrictive for longer. Higher interest rates typically support Treasury yields and the U.S. dollar, increasing the opportunity cost of holding non-yielding assets such as gold.
|
|
| Intraday RESISTANCE LEVELS |
| 20th July 2026 |
R1 |
R2 |
R3 |
| GOLD-XAU |
4028-4056-4085 |
4100-4132-4144 |
4160-4188-4200 |
| Silver-XAG |
57.00-57.50 |
57.70-58.00 |
58.40-59.00-59.90 |
| Crude Oil |
84.05-84.90-85.50 |
86.20-87.00 |
87.50-88.00 |
| EURO/USD |
1.1465-1.1485 |
1.1510-1.1550-1.1588 |
1.1610-1.1650 |
| GBP/USD |
1.3490-1.3520 |
1.3540-1.3600 1.3640 |
1.3670-1.3700-1.3730 |
| USD/JPY |
162.50-162.90 |
163.50-164.00 |
164.60-165.00 |
| Intraday SUPPORTS LEVELS |
| 20th July 2026 |
S1 |
S2 |
S3 |
| GOLD-XAU |
4017-3990-3974 |
3958-3942 |
3920-3900 |
| Silver-XAG |
56.40-55.60-55.00 |
54.00-53.30-52.50 |
51.90-51.50-50.90 |
| Crude Oil |
83.00-82.55-81.78 |
81.00-80.10-79.60 |
79.00-78.00-77.60 |
| EURO/USD |
1.1440-1.1405-1.1385 |
1.1370-1.1355-1.1323 |
1.1390-1.1360-1.1310 |
| GBP/USD |
1.3440-1.3390-1.3350 |
1.3315-1.3290-1.3270 |
1.3300-1.3270-1.3200 |
| USD/JPY |
161.90-161.40-161.00-160.70 |
160.00-159.40 |
158.70-158.00 |
|
|
| Intra-Day Strategy (20th July 2026) |
| GOLD-XAU |
Sell on Strength |
| Silver-XAG |
Buy on Dips |
|
| Crude Oil |
Neutral to Sell |
| EUR/USD |
Neutral to Sell |
|
| GBP/USD |
Neutral to Buy |
| USD/JPY |
Neutral to Sell |
|
|
|
|
Gold – XAU
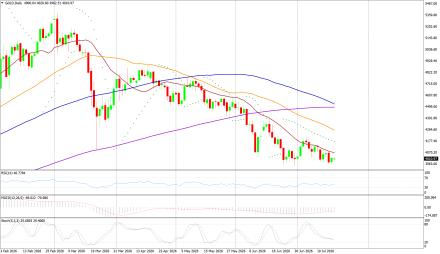
Gold on Friday interaday high of US$4023.72/oz and low of $3959.55/oz. God is up by 1.013% at US$4017.81/oz.
Technicals in Focus:
On the daily charts, gold trades higher than 20DMA (2197). If it drops below this level, it could lead to 2,100. The MACD is currently above the zero line and the histograms are showing an increasing trend, indicating that there may be upward movement in the coming sessions. The RSI is currently at 83.04, which is in the overbought region, suggesting there may be selling pressure in the next 2 to 3 sessions. The Stochastic Oscillator is also in the overbought territory but has given a positive crossover, indicating a bullish stance for intraday trades, but rebound in expected in all the overbought indicators.
Trading Strategy: Sell on Strength
Sell below 4056-4400 keeping stop loss closing above 4400, targeting 3990-3974-3958 and 3942-3920-3900. Buy in between 4000-3900 with risk below 3866 targeting 4017-4028-4056-4085 and 4100-4144-4160-4188-4200.
|
|
| Intraday Support Levels |
| S1 |
|
|
4017-3990-3974 |
| S2 |
|
|
3958-3942 |
| S3 |
|
|
3920-3900 |
| Intraday Resistance Levels |
| R1 |
|
|
4028-4056-4085 |
| R2 |
|
|
4100-4132-4144 |
| R3 |
|
|
4160-4188-4200 |
| Technical Indicators
|
| Name |
|
Value |
Action |
| 14DRSI |
|
|
|
| 20-DMA |
|
|
|
| 50-DMA |
|
|
|
| 100-DMA |
|
|
|
| 200-DMA |
|
|
|
| STOCH(5,3) |
|
|
|
| MACD(12,26,9) |
|
|
|
|
|
|
|
Silver - XAG
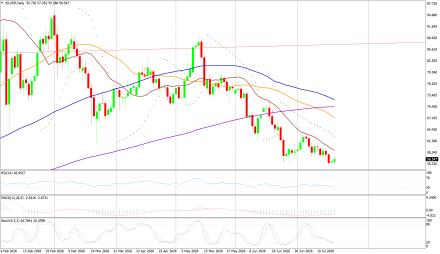
Silver on Friday its intraday high of US$56.18/oz and low of US$54.75/oz settle up by 0.548% at US$55.93/oz.
Technicals in Focus:
On daily charts, silver is sustaining above 20MA (25.05), breakage above will lead to 23.73. MACD is below the zero line and histograms are increasing trend, bringing a bullish stance in the upcoming sessions. RSI is in the oversold region, indicating a sell signal for now. The Stochastic Oscillator is in the overbought region and gives a positive crossover to show an upside move for the intraday trade.
Trading Strategy: Buy on Dips
Buy in between 56.40-51.00 targeting 57.00-57.70 and 58.40-59.00-59.90-61.00-61.48 with stop loss should be placed on the breakage below 53.00.
Sell in between 57.00-63.45 with a stop loss above 64.00 targeting 56.40-55.60-55.00-54.10 and 53.30-52.50-51.90-51.50.
|
|
| Intraday Support Levels |
| S1 |
|
|
56.40-55.60-55.00 |
| S2 |
|
|
54.00-53.30-52.50 |
| S3 |
|
|
51.90-51.50-50.90 |
| Intraday Resistance Levels |
| R1 |
|
|
57.00-57.50 |
| R2 |
|
|
57.70-58.00 |
| R3 |
|
|
58.40-59.00-59.90 |
| TECHNICAL INDICATORS |
| Name |
|
Value |
Action |
| 14DRSI |
|
46.1562 |
Buy |
| 20-DMA |
|
92.99 |
Sell |
| 50-DMA |
|
75.81 |
Sell |
| 100-DMA |
|
62.03 |
Sell |
| 200-DMA |
|
49.29 |
Sell |
| STOCH(5,3) |
|
21.094 |
Buy |
| MACD(12,26,9) |
|
5.262 |
Buy |
|
|
|
|
Oil - WTI
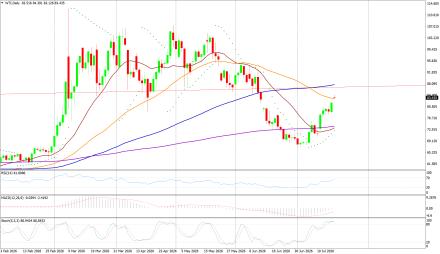
Crude Oil on Friday high of US$81.96/bbl, an intraday low of US$77.86/bbl, and settled up by 3.876% to close at US$81.72/bbl.
Technicals in Focus:
On daily charts, oil is sustaining above its 100DMA i.e. 75.37, a support level, and breakage above will call for 77.48. MACD is above the zero line and histograms are in increasing mode will bring a bullish stance in the upcoming sessions. The Stochastic Oscillator is in the overbought region, giving a negative crossover to confirm a bearish stance; while the RSI is in the neutral region, more upsides can be expected to reach the overbought region, which is highly probable.
Trading Strategy: Neutral to Sell
Sell in between 80.10-85.10 with stop loss at 86.00 targeting 79.00-78.00-77.60-76.50 and 75.70-75.00-74.20
Buy above 9.000-72.90 with risk daily closing below 54.00, targeting 59.00-60.10-61.30-62.10-62.80 and 63.50-63.90-64.50-65.30.
|
|
| Intraday Support Levels |
| S1 |
|
|
83.00-82.55-81.78 |
| S2 |
|
|
81.00-80.10-79.60 |
| S3 |
|
|
79.00-78.00-77.60 |
| Intraday Resistance Levels |
| R1 |
|
|
84.05-84.90-85.50 |
| R2 |
|
|
86.20-87.00 |
| R3 |
|
|
87.50-88.00 |
| TECHNICAL INDICATORS |
| Name |
|
Value |
Action |
| 14DRSI |
|
29.346 |
Sell |
| 20-DMA |
|
67.35 |
Sell |
| 50-DMA |
|
69.06 |
Sell |
| 100-DMA |
|
70.28 |
Sell |
| 200-DMA |
|
71.85 |
Sell |
| STOCH(5,3) |
|
16.166 |
Sell |
| MACD(12,26,9) |
|
-1.306 |
Buy |
|
|
|
|
EUR/USD
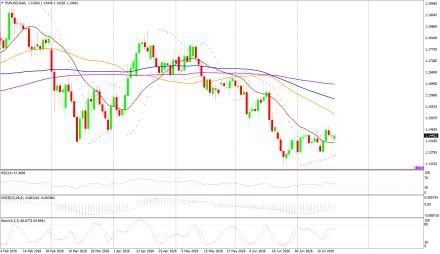
EUR/USD on Friday made an intraday low of US$1.1423/EUR, a high of US$1.1451/EUR, and settled down by 0.013% to close at US$1.1437/EUR.
Technicals in Focus:
On daily charts, prices are sustaining above 100DMA (1.1661), which becomes immediate support, a break below will target 1.1695. MACD is above the zero line and histograms are increasing mode, bringing a bullish view. Stochastic is in oversold territory, giving negative crossovers to the bullish outlook for intraday. 14D RSI is currently in a neutral region and giving no directions to consider right now.
Trading Strategy: Neutral to Sell
Sell below 1.1465-1.1650, targeting 1.1405-1.1370-1.1355 and 1.1323-1.1390-1.1360-1.1310 with stop-loss at daily closing above 1.1520.
Buy above 1.1440-1.1250 with risk below 1.1250 targeting 1.1440-1.1465-1.1485-1.1590 and 1.1610-1.1650.
|
|
| Intraday Support Levels |
| S1 |
|
|
1.1440-1.1405-1.1385 |
| S2 |
|
|
1.1370-1.1355-1.1323 |
| S3 |
|
|
1.1390-1.1360-1.1310 |
| Intraday Resistance Levels |
| R1 |
|
|
1.1465-1.1485 |
| R2 |
|
|
1.1510-1.1550-1.1588 |
| R3 |
|
|
1.1610-1.1650 |
| TECHNICAL INDICATORS |
| Name |
|
Value |
Action |
| 14DRSI |
|
48.897 |
Buy |
| 20-DMA |
|
1.1695 |
Sell |
| 50-DMA |
|
1.1656 |
Buy |
| 100-DMA |
|
1.1661 |
Buy |
| 200-DMA |
|
1.1585 |
Buy |
| STOCH(5,3) |
|
55.688 |
Buy |
| MACD(12,26,9) |
|
-0.0013 |
Buy |
|
|
|
|
GBP/USD
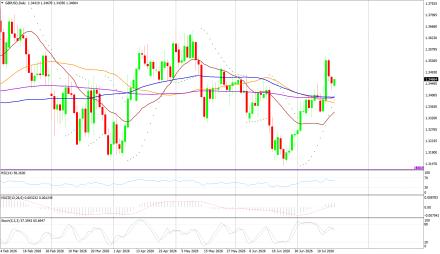
GBP/USD on Friday made a intraday low of US$1.3425/GBP, a high of US$1.3479/GBP, and settled the day down by 0.443% to close at US$1.3451/GBP.
Technicals in Focus:
On daily charts, prices are sustaining above 50DMA (1.2674) is becoming a support level. 14-D RSI is currently in a neutral region and direction is difficult to predict on an RSI basis. The Stochastic Oscillator is in oversold territory and gives a positive crossover to confirm a bullish stance. MACD is above the zero line, but histograms are increasing leading to movement.
Trading Strategy: Neutral to Buy
Based on the charts and explanations above; buy between 1.3440-1.3079 with a target of 1.3490-1.3520-1.3540-1.3570 and 1.3600-1.3640-1.3690 with a stop loss closing below 1.3150.
Sell in between 1.3390-1.3820 with targets at 1.3350-1.3300-1.3210-1.3190-1.3150 and 1.3135-1.3120-1.3100-1.3079 with a stop loss of 1.3900.
|
|
| Intraday Support Levels |
| S1 |
|
|
1.3440-1.3390-1.3350 |
| S2 |
|
|
1.3315-1.3290-1.3270 |
| S3 |
|
|
1.3300-1.3270-1.3200 |
| Intraday Resistance Levels |
| R1 |
|
|
1.3490-1.3520 |
| R2 |
|
|
1.3540-1.3600 1.3640 |
| R3 |
|
|
1.3670-1.3700-1.3730 |
| TECHNICAL INDICATORS |
| Name |
|
Value |
Action |
| 14DRSI |
|
46.905 |
Buy |
| 20-DMA |
|
1.2932 |
Buy |
| 50-DMA |
|
1.2736 |
Buy |
| 100-DMA |
|
1.2629 |
Buy |
| 200-DMA |
|
1.2811 |
Buy |
| STOCH(5,3) |
|
9.458 |
Buy |
| MACD(12,26,9) |
|
-0.003 |
Sell |
|
|
|
|
USD/JPY
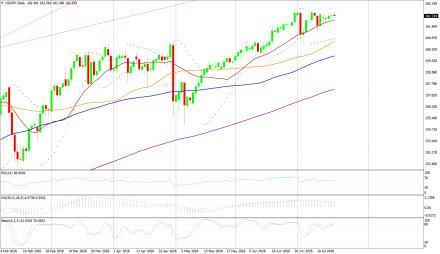
USD/JPY on Friday made an intra‐day low of JPY162.12/USD an intraday high of 162.51/USD, and settled the day up by 0.0166% at JPY162.39/USD.
Technicals in Focus:
In daily charts, JPY is sustaining above 100DMA (152.35), major support on the daily chart. 14-D RSI is currently in the overbought region and chances of downward are expected based on RSI. MACD is above the zero line but histograms are decreasing mode which might lead to downward movement. The Stochastic Oscillator is in overbought territory and signaling to sell as it has given a negative crossover to confirm a bearish stance.
Trading Strategy: Neutral to Sell
Sell below 162.50-165.10 with risk above 163.10 targeting 161.90-161.00-160.70-159.40-158.70 and 158.10-157.00-156.60.
Long positions above 161.90-152.00 with targets of 162.60-163.00-163.50 and 164.00-164.60-165.00 with stops below 152.00.
|
|
| Intraday Support Levels |
| S1 |
|
|
161.90-161.40-161.00-160.70 |
| S2 |
|
|
160.00-159.40 |
| S3 |
|
|
158.70-158.00 |
| INTRADAY RESISTANCE LEVELS |
| R1 |
|
|
162.50-162.90 |
| R2 |
|
|
163.50-164.00 |
| R3 |
|
|
164.60-165.00 |
| TECHNICAL INDICATORS |
| Name |
|
Value |
Action |
| 14DRSI |
|
41.14 |
Buy |
| 20-DMA |
|
148.91 |
Buy |
| 50-DMA |
|
150.24 |
Buy |
| 100-DMA |
|
152.53 |
Buy |
| 200-DMA |
|
151.18 |
Buy |
| STOCH(9,6) |
|
93.662 |
Sell |
| MACD(12,26,9) |
|
0.683 |
Sell |
|
|
|
 |