 |
|
|
Daily Market Lookup
- The U.S. dollar on Tuesday hit its highest level in over a week, helped by elevated Treasury yields and safe-haven demand sparked by continued fighting in the Middle East. Meanwhile, the Japanese yen once again plumbed its weakest level against the greenback since 1986. The dollar index had been under pressure last week, after economic data showed a moderation in the headline U.S. consumer price index and producer price index. Separately, gasoline station retail sales fell on a monthly basis, while University of Michigan data showed July consumer sentiment hitting its highest level since February and a fall in year-ahead inflation expectations. The indicators suggested some breathing room for the Federal Reserve in terms of not immediately tightening policy. However, the June moderation in price pressures was largely due to a slide in oil prices after the U.S. and Iran inked their interim peace deal. The escalation in tensions between the two since has led to oil prices spiking once again, bringing inflationary fears back on the table. Several Fed speakers, including chair Kevin Warsh to Congress, last week said the fight against inflation was far from over, with Dallas Fed President Lorie Logan calling for "modestly higher" interest rates. At the same event, President Donald Trump said Iran "desperately" wanted to meet, but "until they’re ready to meet in a meaningful way, we have no interest." The U.S. leader reiterated that Iran could not have a nuclear weapon, adding "any site where they’re even thinking about nuclear - we’ll be hitting it very, very powerfully." Turning to other major currencies, the sterling slipped - down 0.4% to $1.3379 - while benchmark British gilt yields rose for the second straight day of Andy Burnham’s term. The seventh new prime minister of the United Kingdom in a decade, Burnham on Monday reaffirmed his commitment to follow his predecessor Keir Starmer’s fiscal rules. He is also in the process of completing his new cabinet, with his appointment of former defense secretary John Healey as finance minister sparking a rally in London-listed defense stocks Elsewhere, the Japanese yen weakened and hit as low as 163.19 against the dollar, a four-decade trough. The currency has remained well above 160 for over a month, a level that has triggered billions of dollars in intervention from Tokyo earlier this year. The euro was slightly lower by 0.1% to $1.1401, consolidating in a tight range as markets positioned for Thursday’s European Central Bank (ECB) rate decision. While policymakers in Frankfurt are widely expected to leave key interest rates unchanged, energy-driven inflation risks are expected to keep president Christine Lagarde from signaling any imminent policy easing. The ECB in June became the first G7 reserve bank to raise borrowing costs in order to combat the inflationary shock caused by the Middle East conflict.
- Gold prices extended gains on Wednesday, climbing above the $4,100-an-ounce level as traders monitored escalating tensions in the Middle East, while rising energy prices continued to shape expectations for the Federal Reserve’s interest-rate outlook. Gold built on the previous session’s nearly 2% rally as traders monitored renewed threats to global energy supplies that risk keeping inflation elevated and complicating the Federal Reserve’s policy outlook. The next FOMC meeting is scheduled for July 28-29, with the policy statement and Fed Chair Kevin Warsh’s press conference expected on Wednesday, July 29. U.S. President Donald Trump downplayed the prospect of immediate talks with Iran as the two sides exchanged fresh strikes near the Strait of Hormuz, while Yemen’s Houthi movement renewed threats against shipping in the Red Sea. Oil prices edged higher after extending strong gains throughout July as hostilities in the nearly five-month conflict continued, while a fresh wave of attacks along Russia’s Black Sea coast, through which much of Kazakhstan’s crude exports flow, added to concerns over global energy supplies. The prospect of persistently higher energy prices has left investors weighing inflation risks against softer U.S. economic data, with elevated borrowing costs continuing to act as a headwind for non-yielding bullion. Tony Sycamore, market analyst at IG, said gold’s rebound despite a stronger U.S. dollar and rising Treasury yields suggests investors are beginning to re-establish the metal’s traditional safe-haven role as geopolitical tensions intensify. He added that IG remains cautiously bullish on gold while prices hold above the late-June low, which continues to serve as the key technical reassessment level. Silver also extended gains after jumping more than 4% in the previous session as traders continued to monitor developments in the Middle East alongside the Federal Reserve’s policy outlook. While you're enjoying summer, the market keeps moving. The good news? ProPicks AI never stops working—analyzing thousands of stocks using 100+ financial metrics to surface winning opportunities for you.
- Gold prices slipped below the key $4,000-an-ounce level on Monday as escalating U.S.-Iran hostilities Oil prices extended gains on Wednesday as fears of further supply disruptions intensified after U.S. forces struck Iranian military targets for the 11th straight night, while oil tankers made U-turns in the Red Sea after warnings by Iran-backed Houthi militia. The gains came after oil settled at a five-week high on Tuesday in the wake of U.S. forces striking targets in southern and western Iran, while Iran attacked U.S. facilities in Bahrain, Kuwait and Jordan. The U.S. military said it began its latest strikes on Iran late on Tuesday in the United States, or early Wednesday in Iran. The U.S. attacks came a short while after the Kuwaiti army said its air defences were intercepting Iranian drones on Wednesday. The constant trading of strikes have raised fears of further disruptions to global energy supplies after Yemen’s Iran-aligned Houthis opened a new front in the Iran war by threatening to target vessels carrying Saudi oil in the Bab el-Mandeb Strait and announcing a naval blockade of Saudi Arabia. The Bab el-Mandeb waterway at the southern entrance to the Red Sea has become an increasingly important route for Saudi crude exports as traffic through the Strait of Hormuz has fallen sharply since a ceasefire between the United States and Iran collapsed earlier this month. Three oil tankers loaded with Saudi crude for China and India made U-turns in the Red Sea on Tuesday, heading towards the Suez Canal rather than braving the Yemeni coast following a warning from Yemen’s Iran-aligned Houthi militia. The Caspian Pipeline Consortium has stopped receiving oil from Kazakhstan after suspending loadings on Monday due to attacks on oil tankers at its Black Sea terminal blamed on Ukrainian drones. Ukraine has not commented on the attacks. Meanwhile, data from the American Petroleum Institute showed that U.S. crude and distillate inventories rose last week, while gasoline stockpiles fell, market sources said. The inventory data comes ahead of official figures from the U.S. Energy Information Administration on Wednesday.
|
|
| Intraday RESISTANCE LEVELS |
| 22nd July 2026 |
R1 |
R2 |
R3 |
| GOLD-XAU |
4132-4144 |
4160-4188-4200 |
4225-4253 |
| Silver-XAG |
59.90-60.50-61.40 |
62.00-63.25 |
64.00-65.10 |
| Crude Oil |
84.90-85.50 |
86.20-87.00 |
87.50-88.00 |
| EURO/USD |
1.1440-1.1465-1.1485 |
1.1510-1.1550-1.1588 |
1.1610-1.1650 |
| GBP/USD |
1.3440-1.3490-1.3520 |
1.3540-1.3600 1.3640 |
1.3670-1.3700-1.3730 |
| USD/JPY |
163.50-164.00 |
164.60-165.00 |
166.00-166.70 |
| Intraday SUPPORTS LEVELS |
| 22nd July 2026 |
S1 |
S2 |
S3 |
| GOLD-XAU |
4100-4085-4056 |
4028-4017-3990 |
3974-3958-3942 |
| Silver-XAG |
59.00-58.40-58.00 |
57.70-57.50-57.00 |
56.40-55.60-55.00 |
| Crude Oil |
84.05-83.00-82.55-81.78 |
81.00-80.10-79.60 |
79.00-78.00-77.60 |
| EURO/USD |
1.1400-1.1385 |
1.1370-1.1355-1.1323 |
1.1390-1.1360-1.1310 |
| GBP/USD |
1.3380-1.3350 |
1.3315-1.3290-1.3270 |
1.3300-1.3270-1.3200 |
| USD/JPY |
162.90-162.50-161.9 |
161.40-161.00-160.7 |
160.00-159.40 |
|
|
| Intra-Day Strategy (22nd July 2026) |
| GOLD-XAU |
Sell on Strength |
| Silver-XAG |
Buy on Dips |
|
| Crude Oil |
Neutral to Sell |
| EUR/USD |
Neutral to Sell |
|
| GBP/USD |
Neutral to Buy |
| USD/JPY |
Neutral to Sell |
|
|
|
|
Gold – XAU
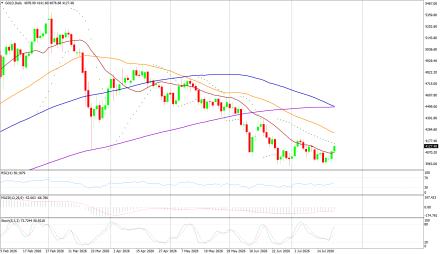
Gold on Tuesday interaday high of US$4086.88/oz and low of $3999.66/oz. God is up by 1.70% at US$4077.36/oz.
Technicals in Focus:
On the daily charts, gold trades higher than 20DMA (2197). If it drops below this level, it could lead to 2,100. The MACD is currently above the zero line and the histograms are showing an increasing trend, indicating that there may be upward movement in the coming sessions. The RSI is currently at 83.04, which is in the overbought region, suggesting there may be selling pressure in the next 2 to 3 sessions. The Stochastic Oscillator is also in the overbought territory but has given a positive crossover, indicating a bullish stance for intraday trades, but rebound in expected in all the overbought indicators.
Trading Strategy: Sell on Strength
Sell below 4132-4400 keeping stop loss closing above 4400, targeting 3990-3974-3958 and 3942-3920-3900. Buy in between 4100-3900 with risk below 3866 targeting 4132-4144-4160-4188 and 4200-4225-4253. |
|
| Intraday Support Levels |
| S1 |
|
|
4100-4085-4056 |
| S2 |
|
|
4028-4017-3990 |
| S3 |
|
|
3974-3958-3942 |
| Intraday Resistance Levels |
| R1 |
|
|
4132-4144 |
| R2 |
|
|
4160-4188-4200 |
| R3 |
|
|
4225-4253 |
| Technical Indicators
|
| Name |
|
Value |
Action |
| 14DRSI |
|
52.916 |
Buy |
| 20-DMA |
|
4800.67 |
Buy |
| 50-DMA |
|
4497.76 |
Buy |
| 100-DMA |
|
4239.36 |
Buy |
| 200-DMA |
|
3800.35 |
Buy |
| STOCH(5,3) |
|
26.933 |
Sell |
| MACD(12,26,9) |
|
150.924 |
Buy |
|
|
|
|
Silver - XAG
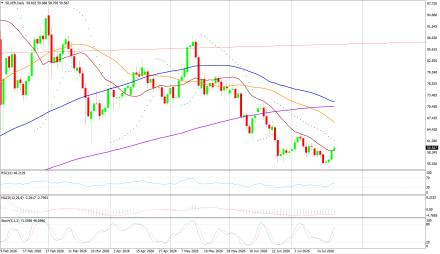
Silver on Tuesday its intraday high of US$59.22/oz and low of US$56.09/oz settle up by 4.16% at US$58.77/oz.
Technicals in Focus:
On daily charts, silver is sustaining above 20MA (25.05), breakage above will lead to 23.73. MACD is below the zero line and histograms are increasing trend, bringing a bullish stance in the upcoming sessions. RSI is in the oversold region, indicating a sell signal for now. The Stochastic Oscillator is in the overbought region and gives a positive crossover to show an upside move for the intraday trade.
Trading Strategy: Buy on Dips
Buy in between 59.00-54.00 targeting 59.90-60.50-61.00-61.48 and 62.00-63.25-64.00-65.10 with stop loss should be placed on the breakage below 53.00.
Sell in between 60.00-64.45 with a stop loss above 65.00 targeting 59.00-58.40-58.00-57.70 and 56.40-55.60-55.00-54.10.
|
|
| Intraday Support Levels |
| S1 |
|
|
59.00-58.40-58.00 |
| S2 |
|
|
57.70-57.50-57.00 |
| S3 |
|
|
56.40-55.60-55.00 |
| Intraday Resistance Levels |
| R1 |
|
|
59.90-60.50-61.40 |
| R2 |
|
|
62.00-63.25 |
| R3 |
|
|
64.00-65.10 |
| TECHNICAL INDICATORS |
| Name |
|
Value |
Action |
| 14DRSI |
|
46.1562 |
Buy |
| 20-DMA |
|
92.99 |
Sell |
| 50-DMA |
|
75.81 |
Sell |
| 100-DMA |
|
62.03 |
Sell |
| 200-DMA |
|
49.29 |
Sell |
| STOCH(5,3) |
|
21.094 |
Buy |
| MACD(12,26,9) |
|
5.262 |
Buy |
|
|
|
|
Oil - WTI
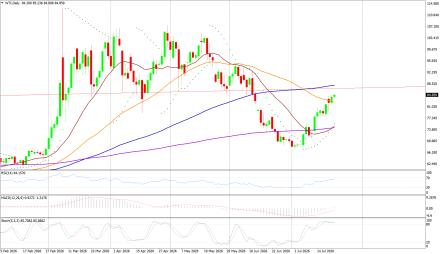
Crude Oil on Friday high of US$84.69/bbl, an intraday low of US$81.17/bbl, and settled up by 2.36% to close at US$84.19/bbl.
Technicals in Focus:
On daily charts, oil is sustaining above its 100DMA i.e. 75.37, a support level, and breakage above will call for 77.48. MACD is above the zero line and histograms are in increasing mode will bring a bullish stance in the upcoming sessions. The Stochastic Oscillator is in the overbought region, giving a negative crossover to confirm a bearish stance; while the RSI is in the neutral region, more upsides can be expected to reach the overbought region, which is highly probable.
Trading Strategy: Neutral to Sell
Sell in between 84.10-88.10 with stop loss at 89.00 targeting 79.00-78.00-77.60-76.50 and 75.70-75.00-74.20
Buy above 84.05-77.60 with risk daily closing below 78.00, targeting 85.00-85.50-86.20 and 87.50-88.00-89.00.
|
|
| Intraday Support Levels |
| S1 |
|
|
84.05-83.00-82.55-81.78 |
| S2 |
|
|
81.00-80.10-79.60 |
| S3 |
|
|
79.00-78.00-77.60 |
| Intraday Resistance Levels |
| R1 |
|
|
84.90-85.50 |
| R2 |
|
|
86.20-87.00 |
| R3 |
|
|
87.50-88.00 |
| TECHNICAL INDICATORS |
| Name |
|
Value |
Action |
| 14DRSI |
|
29.346 |
Sell |
| 20-DMA |
|
67.35 |
Sell |
| 50-DMA |
|
69.06 |
Sell |
| 100-DMA |
|
70.28 |
Sell |
| 200-DMA |
|
71.85 |
Sell |
| STOCH(5,3) |
|
16.166 |
Sell |
| MACD(12,26,9) |
|
-1.306 |
Buy |
|
|
|
|
EUR/USD
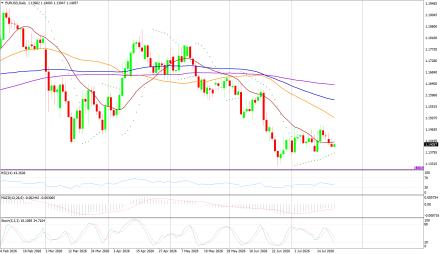
EUR/USD on Tuesday made an intraday low of US$1.1396/EUR, a high of US$1.1428/EUR, and settled down by 0.013% to close at US$1.1397/EUR.
Technicals in Focus:
On daily charts, prices are sustaining above 100DMA (1.1661), which becomes immediate support, a break below will target 1.1695. MACD is above the zero line and histograms are increasing mode, bringing a bullish view. Stochastic is in oversold territory, giving negative crossovers to the bullish outlook for intraday. 14D RSI is currently in a neutral region and giving no directions to consider right now.
Trading Strategy: Neutral to Sell
Sell below 1.1440-1.1650, targeting 1.1405-1.1370-1.1355 and 1.1323-1.1390-1.1360-1.1310 with stop-loss at daily closing above 1.1520.
Buy above 1.1400-1.1250 with risk below 1.1250 targeting 1.1440-1.1465-1.1485-1.1590 and 1.1610-1.1650.
|
|
| Intraday Support Levels |
| S1 |
|
|
1.1400-1.1385 |
| S2 |
|
|
1.1370-1.1355-1.1323 |
| S3 |
|
|
1.1390-1.1360-1.1310 |
| Intraday Resistance Levels |
| R1 |
|
|
1.1440-1.1465-1.1485 |
| R2 |
|
|
1.1510-1.1550-1.1588 |
| R3 |
|
|
1.1610-1.1650 |
| TECHNICAL INDICATORS |
| Name |
|
Value |
Action |
| 14DRSI |
|
48.897 |
Buy |
| 20-DMA |
|
1.1695 |
Sell |
| 50-DMA |
|
1.1656 |
Buy |
| 100-DMA |
|
1.1661 |
Buy |
| 200-DMA |
|
1.1585 |
Buy |
| STOCH(5,3) |
|
55.688 |
Buy |
| MACD(12,26,9) |
|
-0.0013 |
|
|
|
|
|
GBP/USD
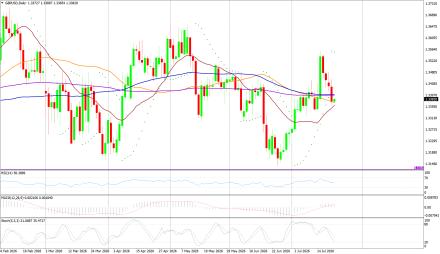
GBP/USD on Tuesday made a intraday low of US$1.3359/GBP, a high of US$1.3454/GBP, and settled the day down by 0.398% to close at US$1.3373/GBP.
Technicals in Focus:
On daily charts, prices are sustaining above 50DMA (1.2674) is becoming a support level. 14-D RSI is currently in a neutral region and direction is difficult to predict on an RSI basis. The Stochastic Oscillator is in oversold territory and gives a positive crossover to confirm a bullish stance. MACD is above the zero line, but histograms are increasing leading to movement.
Trading Strategy: Neutral to Buy
Based on the charts and explanations above; buy between 1.3370-1.3079 with a target of 1.3440-1.3490-1.3520-1.3540-1.3570 and 1.3600-1.3640-1.3690 with a stop loss closing below 1.3150.
Sell in between 1.3440-1.3820 with targets at 1.3380-1.3350-1.3300-1.3210-1.3190 and 1.3150-1.3135-1.3120-1.3100 with a stop loss of 1.3900.
|
|
| Intraday Support Levels |
| S1 |
|
|
1.3380-1.3350 |
| S2 |
|
|
1.3315-1.3290-1.3270 |
| S3 |
|
|
1.3300-1.3270-1.3200 |
| Intraday Resistance Levels |
| R1 |
|
|
1.3440-1.3490-1.3520 |
| R2 |
|
|
1.3540-1.3600 1.3640 |
| R3 |
|
|
1.3670-1.3700-1.3730 |
| TECHNICAL INDICATORS |
| Name |
|
Value |
Action |
| 14DRSI |
|
46.905 |
Buy |
| 20-DMA |
|
1.2932 |
Buy |
| 50-DMA |
|
1.2736 |
Buy |
| 100-DMA |
|
1.2629 |
Buy |
| 200-DMA |
|
1.2811 |
Buy |
| STOCH(5,3) |
|
9.458 |
Buy |
| MACD(12,26,9) |
|
-0.003 |
Sell |
|
|
|
|
USD/JPY
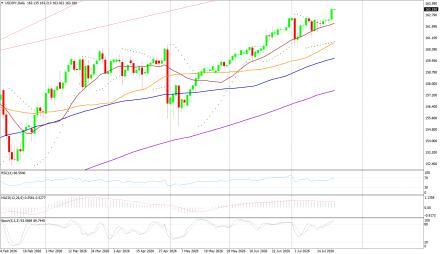
USD/JPY on Tuesday made an intra‐day low of JPY162.40/USD an intraday high of 162.23/USD, and settled the day up by 0.432% at JPY163.17/USD.
Technicals in Focus:
In daily charts, JPY is sustaining above 100DMA (152.35), major support on the daily chart. 14-D RSI is currently in the overbought region and chances of downward are expected based on RSI. MACD is above the zero line but histograms are decreasing mode which might lead to downward movement. The Stochastic Oscillator is in overbought territory and signaling to sell as it has given a negative crossover to confirm a bearish stance.
Trading Strategy: Neutral to Sell
Sell below 163.50-166.90 with risk above 167.00 targeting 162.90-162.50-161.90-161.00-160.70 and 159.40-158.70-158.10-157.00.
Long positions above 162.90-152.00 with targets of 163.00-163.50 and 164.00-164.60-165.00 with stops below 152.00.
|
|
| Intraday Support Levels |
| S1 |
|
|
162.90-162.50-161.9 |
| S2 |
|
|
161.40-161.00-160.7 |
| S3 |
|
|
160.00-159.40 |
| INTRADAY RESISTANCE LEVELS |
| R1 |
|
|
163.50-164.00 |
| R2 |
|
|
164.60-165.00 |
| R3 |
|
|
166.00-166.70 |
| TECHNICAL INDICATORS |
| Name |
|
Value |
Action |
| 14DRSI |
|
41.14 |
Buy |
| 20-DMA |
|
148.91 |
Buy |
| 50-DMA |
|
150.24 |
Buy |
| 100-DMA |
|
152.53 |
Buy |
| 200-DMA |
|
151.18 |
Buy |
| STOCH(9,6) |
|
93.662 |
Sell |
| MACD(12,26,9) |
|
0.683 |
Sell |
|
|
|
 |