 |
|
|
Daily Market Lookup
- The U.S. dollar on Wednesday eased slightly, taking a breather after hitting its highest level in over a week in the previous session. Still, losses were capped as oil prices continued to rise amid intensifying tensions in the Middle East. Meanwhile, the Japanese yen rebounded modestly from its weakest level in four decades as investors weighed the prospects of official intervention by Tokyo, while the sterling halted a two-day slide as positive UK inflation data offset fiscal worries under new leader Andy Burnham. The dollar index had been under pressure last week, after economic data showed a moderation in the headline U.S. consumer price index and producer price index. Separately, gasoline station retail sales fell on a monthly basis, while University of Michigan data showed July consumer sentiment hitting its highest level since February and a fall in year-ahead inflation expectations. The indicators suggested some breathing room for the Federal Reserve in terms of not immediately tightening policy. However, the June moderation in price pressures was largely due to a slide in oil prices after the U.S. and Iran inked their interim peace deal The escalation in tensions between the two since has led to oil prices spiking once again, bringing inflationary fears back on the table. The U.S. and Iran have now engaged in tit-for-tat strikes for eleven consecutive days, leading to a significant drop in vessel traffic through the Strait of Hormuz. New threats to another vital shipping corridor, the Bab el-Mandeb Strait, from Iran-backed Houthis in Yemen have exacerbated supply disruption concerns. Against this backdrop, oil prices have surged, with Brent crude futures, the global benchmark, on Wednesday briefly topping $95 a barrel for the first time since June 11. The statement drew an immediate response from Tehran. Iran’s Tasnim News Agency, citing a military source, said the country would target regional infrastructure and energy facilities with American interests if any bridges or power plants were struck. Separately, Secretary of State Marco Rubio at the ASEAN summit in Philippines said the U.S. remained "open to diplomacy" but Iran did not "seem to be serious" about negotiations. Government data earlier showed UK consumer prices moderated to an increase of 2.6% Y/Y in June from 2.8% Y/Y in May. The sterling steadied even as benchmark British gilt yields remained elevated for the third straight day of Andy Burnham’s term. The seventh new prime minister of the United Kingdom in a decade, Burnham on Monday reaffirmed his commitment to follow his predecessor Keir Starmer’s fiscal rules. He is also in the process of completing his new cabinet, and his appointments are being closely watched by traders in the UK. The euro added 0.1% to $1.1410, with currency market participants keeping positions tight ahead of Thursday’s European Central Bank (ECB) interest rate decision While Frankfurt is widely expected to leave key borrowing costs unchanged at 2.25%, President Christine Lagarde’s remarks will be scrutinized for any signs that rising energy prices could delay future rate cuts.
- Gold prices held firm on Thursday, trading above the $4,130-an-ounce level as investors continued to buy into recent weakness despite escalating Middle East tensions pushing oil prices higher and reinforcing expectations that the Federal Reserve could keep interest rates elevated. Gold consolidated recent gains after rallying about 3% over the previous two sessions, with investors weighing renewed geopolitical risks against the prospect that higher energy prices could keep inflation elevated and complicate the Federal Reserve’s policy outlook. The U.S. and Iran showed little sign of returning to negotiations as hostilities intensified, while attacks on tankers transiting the Red Sea were reported for the first time since the conflict began in late February. Yemen’s Iran-backed Houthi movement claimed responsibility, raising fresh concerns over shipping through a key route for Saudi Arabian crude exports. The renewed disruption helped keep oil prices near multiweek highs, prompting markets to reassess the inflation outlook ahead of next week’s Federal Reserve meeting. Higher borrowing costs typically weigh on non-yielding bullion by increasing its opportunity cost. Investors remain divided over whether the Federal Reserve will deliver another interest-rate hike at next week’s meeting, with limited guidance from Chair Kevin Warsh adding to uncertainty over the policy outlook. ANZ analysts said investors have continued rebuilding gold positions despite the prospect of higher interest rates, suggesting recent weakness has attracted buyers rather than triggering fresh selling. The bank noted that non-commercial net long positions have climbed to their highest level since January, while renewed inflows into gold-backed exchange-traded funds indicate some investors are using bullion to hedge against increasingly stretched equity valuations. ANZ added that gold’s resilience has come even as rising energy prices point to a more restrictive monetary policy backdrop, with dip-buying helping offset the usual pressure that higher inflation expectations and elevated interest rates exert on bullion. Gold has held above the psychologically important $4,000 level this week after tumbling sharply from its January record high, with traders watching whether the metal can build enough momentum to challenge resistance near $4,200.
- Oil prices rose more than 1.5% to their highest in more than six weeks on Thursday, with the United States launching a new round of strikes on Iran and Yemen’s Houthis targeting oil tankers in the Red Sea. The U.S. military said it carried out a 12th consecutive night of attacks on Iran hours after U.S. President Donald Trump’s vowed to destroy an Iranian bridge or power plant every time Iran shoots at a ship in the Strait of Hormuz, raising the stakes in the war with Iran. Iran’s Revolutionary Guards said that an oil tanker had caught fire after an explosion while attempting to pass through what they described as a mined route south of the Strait of Hormuz, and that the two other tankers had turned back. The Guards said the strait was under their control and "completely closed" while U.S. actions continued in the region, warning that no tanker would be allowed to enter or leave without coordination with Iran. As well as the renewed conflict over control of that key waterway, the Iran-aligned Houthis have opened a new front in the war by threatening to target vessels carrying Saudi oil in the Bab el-Mandeb Strait and announced a naval blockade of Saudi Arabia The Houthis said they had carried out a military operation targeting two Saudi oil tankers, and maritime security reports said one of the vessels named by the group, the Saudi-flagged tanker Encelia, had been hit in the Red Sea. The Houthis said they had forced around 10 ships to retreat and return after warning vessels against sailing to Saudi ports. Reuters could not immediately verify this account. The Houthis’ naval blockade on Saudi Arabia in the Red Sea threatens to disrupt global energy supplies beyond the Gulf, while Iran’s Revolutionary Guards’ spokesperson also warned shipping companies that the Strait of Hormuz southern route is mined in a post on X. On the U.S. supply side, crude stocks rose by 2 million barrels last week, the Energy Information Administration said, as refinery runs eased and crude exports dropped while imports rose. Analysts’ in a Reuters poll had estimated a 1.1 million-barrel draw.
|
|
| Intraday RESISTANCE LEVELS |
| 23rd July 2026 |
R1 |
R2 |
R3 |
| GOLD-XAU |
4132-4144 |
4160-4188-4200 |
4225-4253 |
| Silver-XAG |
59.90-60.50-61.40 |
62.00-63.25 |
64.00-65.10 |
| Crude Oil |
87.50-88.10-89.70 |
90.50-91.10 |
91.80-92.50-93.00 |
| EURO/USD |
1.1440-1.1465-1.1485 |
1.1510-1.1550-1.1588 |
1.1610-1.1650 |
| GBP/USD |
1.3440-1.3490-1.3520 |
1.3540-1.3600 1.3640 |
1.3670-1.3700-1.3730 |
| USD/JPY |
163.50-164.00 |
164.60-165.00 |
166.00-166.70 |
| Intraday SUPPORTS LEVELS |
| 23rd July 2026 |
S1 |
S2 |
S3 |
| GOLD-XAU |
4100-4085-4056 |
4028-4017-3990 |
3974-3958-3942 |
| Silver-XAG |
59.00-58.40-58.00 |
57.70-57.50-57.00 |
56.40-55.60-55.00 |
| Crude Oil |
87.00-86.20-85.50 |
84.90-84.05-83.00 |
82.55-81.78-81.00 |
| EURO/USD |
1.1400-1.1385 |
1.1370-1.1355-1.1323 |
1.1390-1.1360-1.1310 |
| GBP/USD |
1.3380-1.3350 |
1.3315-1.3290-1.3270 |
1.3300-1.3270-1.3200 |
| USD/JPY |
162.90-162.50-161.9 |
161.40-161.00-160.7 |
160.00-159.40 |
|
|
| Intra-Day Strategy (23rd July 2026) |
| GOLD-XAU |
Sell on Strength |
| Silver-XAG |
Buy on Dips |
|
| Crude Oil |
Neutral to Sell |
| EUR/USD |
Neutral to Sell |
|
| GBP/USD |
Neutral to Buy |
| USD/JPY |
Neutral to Sell |
|
|
|
|
Gold – XAU
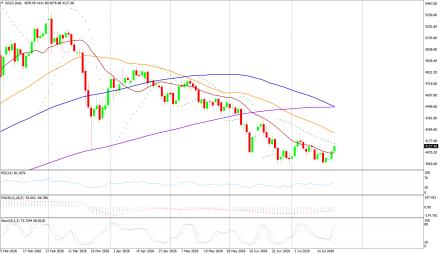
Gold on Wednesday interaday high of US$4165.91/oz and low of $4076.68/oz. God is up by 1.245% at US$4129.79/oz.
Technicals in Focus:
On the daily charts, gold trades higher than 20DMA (2197). If it drops below this level, it could lead to 2,100. The MACD is currently above the zero line and the histograms are showing an increasing trend, indicating that there may be upward movement in the coming sessions. The RSI is currently at 83.04, which is in the overbought region, suggesting there may be selling pressure in the next 2 to 3 sessions. The Stochastic Oscillator is also in the overbought territory but has given a positive crossover, indicating a bullish stance for intraday trades, but rebound in expected in all the overbought indicators.
Trading Strategy: Sell on Strength
Sell below 4132-4400 keeping stop loss closing above 4400, targeting 3990-3974-3958 and 3942-3920-3900. Buy in between 4100-3900 with risk below 3866 targeting 4132-4144-4160-4188 and 4200-4225-4253. |
|
| Intraday Support Levels |
| S1 |
|
|
4100-4085-4056 |
| S2 |
|
|
4028-4017-3990 |
| S3 |
|
|
3974-3958-3942 |
| Intraday Resistance Levels |
| R1 |
|
|
4132-4144 |
| R2 |
|
|
4160-4188-4200 |
| R3 |
|
|
4225-4253 |
| Technical Indicators
|
| Name |
|
Value |
Action |
| 14DRSI |
|
52.916 |
Buy |
| 20-DMA |
|
4800.67 |
Buy |
| 50-DMA |
|
4497.76 |
Buy |
| 100-DMA |
|
4239.36 |
Buy |
| 200-DMA |
|
3800.35 |
Buy |
| STOCH(5,3) |
|
26.933 |
Sell |
| MACD(12,26,9) |
|
150.924 |
Buy |
|
|
|
|
Silver - XAG
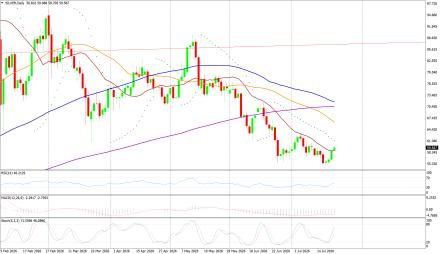
Silver on Wednesday its intraday high of US$60.91/oz and low of US$58.70/oz settle up by 1.45% at US$59.69/oz.
Technicals in Focus:
On daily charts, silver is sustaining above 20MA (25.05), breakage above will lead to 23.73. MACD is below the zero line and histograms are increasing trend, bringing a bullish stance in the upcoming sessions. RSI is in the oversold region, indicating a sell signal for now. The Stochastic Oscillator is in the overbought region and gives a positive crossover to show an upside move for the intraday trade.
Trading Strategy: Buy on Dips
Buy in between 59.00-54.00 targeting 59.90-60.50-61.00-61.48 and 62.00-63.25-64.00-65.10 with stop loss should be placed on the breakage below 53.00.
Sell in between 60.00-64.45 with a stop loss above 65.00 targeting 59.00-58.40-58.00-57.70 and 56.40-55.60-55.00-54.10.
|
|
| Intraday Support Levels |
| S1 |
|
|
59.00-58.40-58.00 |
| S2 |
|
|
57.70-57.50-57.00 |
| S3 |
|
|
56.40-55.60-55.00 |
| Intraday Resistance Levels |
| R1 |
|
|
59.90-60.50-61.40 |
| R2 |
|
|
62.00-63.25 |
| R3 |
|
|
64.00-65.10 |
| TECHNICAL INDICATORS |
| Name |
|
Value |
Action |
| 14DRSI |
|
46.1562 |
Buy |
| 20-DMA |
|
92.99 |
Sell |
| 50-DMA |
|
75.81 |
Sell |
| 100-DMA |
|
62.03 |
Sell |
| 200-DMA |
|
49.29 |
Sell |
| STOCH(5,3) |
|
21.094 |
Buy |
| MACD(12,26,9) |
|
5.262 |
Buy |
|
|
|
|
Oil - WTI
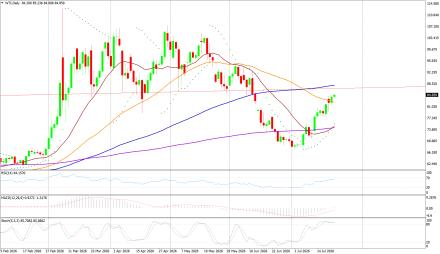
Crude Oil on Wednesday high of US$87.81/bbl, an intraday low of US$84.00/bbl, and settled up by 1.951% to close at US$85.84/bbl.
Technicals in Focus:
On daily charts, oil is sustaining above its 100DMA i.e. 75.37, a support level, and breakage above will call for 77.48. MACD is above the zero line and histograms are in increasing mode will bring a bullish stance in the upcoming sessions. The Stochastic Oscillator is in the overbought region, giving a negative crossover to confirm a bearish stance; while the RSI is in the neutral region, more upsides can be expected to reach the overbought region, which is highly probable.
Trading Strategy: Neutral to Sell
Sell in between 87.50-93.10 with stop loss at 94.00 targeting 87.00-86.20-85.50-84.90 and 84.05-83.00-81.78-81.00.
Buy above 87.05-77.60 with risk daily closing below 77.00, targeting 87.50-88.10-89.00-89.70-90.50 and 91.10-91.80-92.50-93.00.
|
|
| Intraday Support Levels |
| S1 |
|
|
87.00-86.20-85.50 |
| S2 |
|
|
84.90-84.05-83.00 |
| S3 |
|
|
82.55-81.78-81.00 |
| Intraday Resistance Levels |
| R1 |
|
|
87.50-88.10-89.70 |
| R2 |
|
|
90.50-91.10 |
| R3 |
|
|
91.80-92.50-93.00 |
| TECHNICAL INDICATORS |
| Name |
|
Value |
Action |
| 14DRSI |
|
29.346 |
Sell |
| 20-DMA |
|
67.35 |
Sell |
| 50-DMA |
|
69.06 |
Sell |
| 100-DMA |
|
70.28 |
Sell |
| 200-DMA |
|
71.85 |
Sell |
| STOCH(5,3) |
|
16.166 |
Sell |
| MACD(12,26,9) |
|
-1.306 |
Buy |
|
|
|
|
EUR/USD
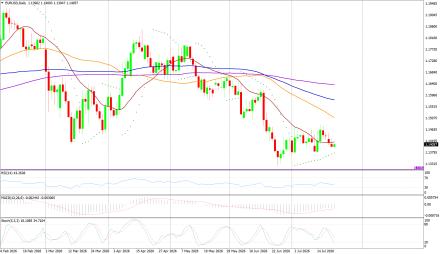
EUR/USD on Wednesday made an intraday low of US$1.1394/EUR, a high of US$1.1428/EUR, and settled up by 0.129% to close at US$1.1411/EUR.
Technicals in Focus:
On daily charts, prices are sustaining above 100DMA (1.1661), which becomes immediate support, a break below will target 1.1695. MACD is above the zero line and histograms are increasing mode, bringing a bullish view. Stochastic is in oversold territory, giving negative crossovers to the bullish outlook for intraday. 14D RSI is currently in a neutral region and giving no directions to consider right now.
Trading Strategy: Neutral to Sell
Sell below 1.1440-1.1650, targeting 1.1405-1.1370-1.1355 and 1.1323-1.1390-1.1360-1.1310 with stop-loss at daily closing above 1.1520.
Buy above 1.1400-1.1250 with risk below 1.1250 targeting 1.1440-1.1465-1.1485-1.1590 and 1.1610-1.1650.
|
|
| Intraday Support Levels |
| S1 |
|
|
1.1400-1.1385 |
| S2 |
|
|
1.1370-1.1355-1.1323 |
| S3 |
|
|
1.1390-1.1360-1.1310 |
| Intraday Resistance Levels |
| R1 |
|
|
1.1440-1.1465-1.1485 |
| R2 |
|
|
1.1510-1.1550-1.1588 |
| R3 |
|
|
1.1610-1.1650 |
| TECHNICAL INDICATORS |
| Name |
|
Value |
Action |
| 14DRSI |
|
48.897 |
Buy |
| 20-DMA |
|
1.1695 |
Sell |
| 50-DMA |
|
1.1656 |
Buy |
| 100-DMA |
|
1.1661 |
Buy |
| 200-DMA |
|
1.1585 |
Buy |
| STOCH(5,3) |
|
55.688 |
Buy |
| MACD(12,26,9) |
|
-0.0013 |
|
|
|
|
|
GBP/USD
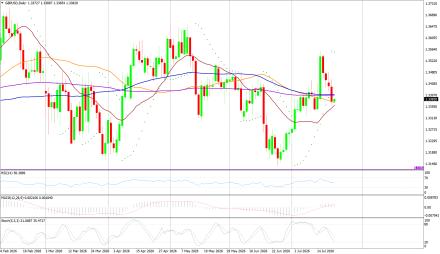
GBP/USD on Wednesday made a intraday low of US$1.3354/GBP, a high of US$1.3394/GBP, and settled the day up by 0.0067% to close at US$1.3373/GBP.
Technicals in Focus:
On daily charts, prices are sustaining above 50DMA (1.2674) is becoming a support level. 14-D RSI is currently in a neutral region and direction is difficult to predict on an RSI basis. The Stochastic Oscillator is in oversold territory and gives a positive crossover to confirm a bullish stance. MACD is above the zero line, but histograms are increasing leading to movement.
Trading Strategy: Neutral to Buy
Based on the charts and explanations above; buy between 1.3370-1.3079 with a target of 1.3440-1.3490-1.3520-1.3540-1.3570 and 1.3600-1.3640-1.3690 with a stop loss closing below 1.3150.
Sell in between 1.3440-1.3820 with targets at 1.3380-1.3350-1.3300-1.3210-1.3190 and 1.3150-1.3135-1.3120-1.3100 with a stop loss of 1.3900.
|
|
| Intraday Support Levels |
| S1 |
|
|
1.3380-1.3350 |
| S2 |
|
|
1.3315-1.3290-1.3270 |
| S3 |
|
|
1.3300-1.3270-1.3200 |
| Intraday Resistance Levels |
| R1 |
|
|
1.3440-1.3490-1.3520 |
| R2 |
|
|
1.3540-1.3600 1.3640 |
| R3 |
|
|
1.3670-1.3700-1.3730 |
| TECHNICAL INDICATORS |
| Name |
|
Value |
Action |
| 14DRSI |
|
46.905 |
Buy |
| 20-DMA |
|
1.2932 |
Buy |
| 50-DMA |
|
1.2736 |
Buy |
| 100-DMA |
|
1.2629 |
Buy |
| 200-DMA |
|
1.2811 |
Buy |
| STOCH(5,3) |
|
9.458 |
Buy |
| MACD(12,26,9) |
|
-0.003 |
Sell |
|
|
|
|
USD/JPY
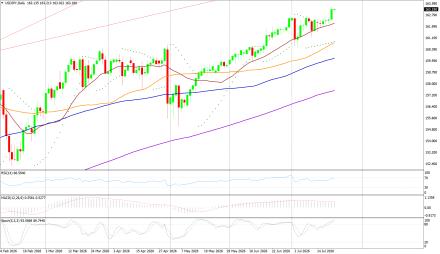
USD/JPY on Wednesday made an intra‐day low of JPY162.67/USD an intraday high of 163.21/USD, and settled the day down by 0.0055% at JPY163.12/USD.
Technicals in Focus:
In daily charts, JPY is sustaining above 100DMA (152.35), major support on the daily chart. 14-D RSI is currently in the overbought region and chances of downward are expected based on RSI. MACD is above the zero line but histograms are decreasing mode which might lead to downward movement. The Stochastic Oscillator is in overbought territory and signaling to sell as it has given a negative crossover to confirm a bearish stance.
Trading Strategy: Neutral to Sell
Sell below 163.50-166.90 with risk above 167.00 targeting 162.90-162.50-161.90-161.00-160.70 and 159.40-158.70-158.10-157.00.
Long positions above 162.90-152.00 with targets of 163.00-163.50 and 164.00-164.60-165.00 with stops below 152.00.
|
|
| Intraday Support Levels |
| S1 |
|
|
162.90-162.50-161.9 |
| S2 |
|
|
161.40-161.00-160.7 |
| S3 |
|
|
160.00-159.40 |
| INTRADAY RESISTANCE LEVELS |
| R1 |
|
|
163.50-164.00 |
| R2 |
|
|
164.60-165.00 |
| R3 |
|
|
166.00-166.70 |
| TECHNICAL INDICATORS |
| Name |
|
Value |
Action |
| 14DRSI |
|
41.14 |
Buy |
| 20-DMA |
|
148.91 |
Buy |
| 50-DMA |
|
150.24 |
Buy |
| 100-DMA |
|
152.53 |
Buy |
| 200-DMA |
|
151.18 |
Buy |
| STOCH(9,6) |
|
93.662 |
Sell |
| MACD(12,26,9) |
|
0.683 |
Sell |
|
|
|
 |