 |
|
|
Daily Market Lookup
- The U.S. dollar strengthened broadly on Thursday, climbing to a fresh 40-year high against the Japanese yen and advancing against the euro as surging oil prices and the European Central Bank’s decision to leave interest rates unchanged reinforced demand for the greenback. The move came as Brent crude extended its rally for a fifth consecutive session, topping $100 a barrel for the first time since late May after Yemen’s Houthis said they had struck two Saudi oil tankers. The attack heightened concerns over global oil supplies, adding to disruptions around the Strait of Hormuz and stoking inflation fears. The dollar has gained in recent days as the resurgence in price pressures has prompted traders to reassess the likelihood that the Federal Reserve could resume raising interest rates. The U.S. economy is also viewed as better positioned than Europe and Japan to withstand higher energy costs, further supporting the currency. The ECB held its three key rates on the deposit facility, the main refinancing operations, and the marginal lending facility at 2.25%, 2.40%, and 2.65% respectively. The action was widely expected as oil prices had tumbled since the ECB’s June decision to hike rates, easing price pressures. However, an escalation in tensions between the U.S. and Iran this month has once again boosted oil, upending inflationary dynamics The central bank also said it would follow a "data-dependent and meeting-by-meeting approach" to setting monetary policy, while refraining from committing to any future rate actions. President Christine Lagarde later at a press conference said the decision was unanimous. Turning away from the euro and looking at the Middle East, Brent crude futures, the global oil benchmark, topped $100 a barrel on Thursday for the first time since May. The resurgence in crude prices has brought inflationary jitters back on the table, reflected most clearly in a surge in U.S. Treasury yields as traders have dumped government bonds. The benchmark 10-year yield was last up 4.7 basis points to 4.704%. The conflict is potentially becoming wider after Iran-backed Houthis in Yemen took responsibility for strikes on two Saudi Arabian tankers in the Red Sea, the first since the militia announced a blockade on Saudi vessels this week. The attacks threaten to further disrupt global oil supplies out of the region, with Kpler estimating 1.9 million barrels a day of Saudi west coast refining capacity exposed to potential Houthi missile hits. The shipping tracker also said confirmed vessel crossings through the Strait of Hormuz had dropped by 75%, leaving more oil accumulating in the Gulf. Ships have become increasingly cautious in transiting the vital waterway amid continued tit-for-tat strikes between the U.S. and Iran. U.S. Central Command on Wednesday completed a twelfth consecutive night of bombardment against Iran, while its naval blockade had redirected nine commercial vessels and disabled one to prevent ships from entering or exiting Iranian ports. Tehran has retaliated by striking U.S. military bases in neighboring countries such as Kuwait, Jordan, and Bahrain. President Donald Trump on Thursday morning criticized the Houthis. He said they had "acted very responsibly" over the past year but were now "starting up again" by shooting at the two Saudi ships, and promised to inflict "major military punishment" on them and Iran.
- Gold prices edged lower on Friday but remained on track to snap a two-week losing streak, as escalating tensions in the Middle East supported bullion despite growing expectations that the Federal Reserve could keep interest rates higher for longer Middle East conflict fuels inflation concerns ahead of Fed meeting. Hostilities in the Middle East intensified after Yemen’s Iran-aligned Houthis attacked two Saudi oil tankers in the Red Sea, prompting President Donald Trump to warn that Washington would hold Iran responsible for any future Houthi attacks on commercial shipping and threaten further military action against Tehran. The geopolitical backdrop remained tense after The New York Times reported that Iran had rejected a U.S.-backed ceasefire proposal, dimming hopes for a near-term de-escalation even as diplomatic efforts continued. The renewed escalation helped lift oil prices, while stronger-than-expected U.S. labor market data added to concerns that the Federal Reserve could maintain a restrictive policy stance. Initial jobless claims unexpectedly fell to 187,000. Markets continue to price roughly a 34% probability of a quarter-point rate increase at next week’s Federal Reserve meeting after stronger-than-expected labor market data and higher energy prices reinforced inflation concerns Nomura analysts said they expect the Fed to leave interest rates unchanged, with Chair Kevin Warsh unlikely to provide meaningful forward guidance given the absence of updated economic projections or a dot plot at the July meeting. Sycamore said the latest retreat had not materially altered gold’s broader technical outlook, with bullion still showing signs of forming a base above the late-June low of $3,942. A sustained move above the early-July high of $4,202 would strengthen the bullish case and pave the way for a rebound toward the 200-day moving average near $4,495.
- Brent oil prices hovered above $100 per barrel on Friday while heading for their fourth week of gains, driven by concerns about disrupted energy flows in the Red Sea and fears of further escalation in the U.S.-Israeli war on Iran. The number of tankers crossing through the Strait of Hormuz fell to just one on Thursday, the lowest since May 7, according to ship-tracking data from Kpler, an analytics firm The Bab el-Mandeb shipping route controls access from the Red Sea to the Indian Ocean and is the second-most-important oil channel after the Strait of Hormuz. U.S. President Donald Trump vowed to "hold Iran responsible" for any further attacks. The Iran-aligned Houthis had declared on Monday that they were imposing a naval blockade on Saudi Arabia, which had been diverting its oil via pipeline to get around Iran’s closure of the Strait of Hormuz. Iran had been pressing the Houthis to close the Bab el-Mandeb gateway to the Red Sea if the U.S. continued to attack Iranian power infrastructure, after an interim truce between the two countries collapsed two weeks ago. Also on Thursday, Kazakhstan’s energy ministry said oil companies temporarily cut back production after suspected Ukrainian drone attacks forced the country’s main Black Sea export terminal to close. The Caspian Pipeline Consortium stopped receiving oil from Kazakhstan after suspending loadings because of attacks on tankers at the terminal, industry sources said on Tuesday. The route handles about 2% of the world’s daily crude supply. Kazakhstan’s energy ministry did not specify the scale of the production reductions, but one source said the country’s biggest field had cut output by more than half.
|
|
| Intraday RESISTANCE LEVELS |
| 24th July 2026 |
R1 |
R2 |
R3 |
| GOLD-XAU |
4056-4085-4100-4132 |
4144-4160-4188 |
4200-4225-4253 |
| Silver-XAG |
57.70-58.00-58.40 |
59.00-59.90-60.50 |
61.40-62.00-63.25 |
| Crude Oil |
90.50-91.10 |
91.80-92.50-93.00 |
93.60-94.10-94.84 |
| EURO/USD |
1.1400-1.1440-1.1465 |
1.1485-1.1510-1.1550 |
1.1588-1.1610-1.1650 |
| GBP/USD |
1.3350-1.3380-1.3410 |
1.3440-1.3490-1.3520 |
1.3540-1.3600 1.3640 |
| USD/JPY |
163.50-164.00 |
164.60-165.00 |
166.00-166.70 |
| Intraday SUPPORTS LEVELS |
| 24th July 2026 |
S1 |
S2 |
S3 |
| GOLD-XAU |
4017-3990 |
3974-3958-3942 |
3920-3900-3886 |
| Silver-XAG |
57.00-56.40-55.60 |
55.00-54.60-54.30 |
54.00-53.30 |
| Crude Oil |
89.70-88.10-87.50 |
87.00-86.20-85.50 |
84.90-84.05-83.00 |
| EURO/USD |
1.1370 |
1.1370-1.1355-1.1323 |
1.1390-1.1360-1.1310 |
| GBP/USD |
1.3315-1.3290-1.3270 |
1.3300-1.3270-1.3200 |
1.3160-1.3100 |
| USD/JPY |
162.90-162.50-161.9 |
161.40-161.00-160.7 |
160.00-159.40 |
|
|
| Intra-Day Strategy (24th July 2026) |
| GOLD-XAU |
Sell on Strength |
| Silver-XAG |
Buy on Dips |
|
| Crude Oil |
Neutral to Sell |
| EUR/USD |
Neutral to Sell |
|
| GBP/USD |
Neutral to Buy |
| USD/JPY |
Neutral to Sell |
|
|
|
|
Gold – XAU
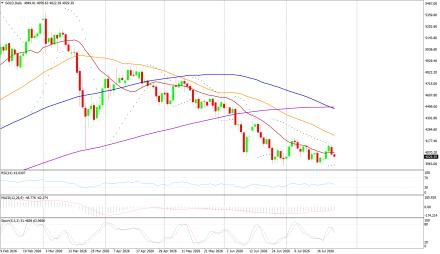
Gold on Thursday interaday high of US$4140.95/oz and low of $4040.09/oz. God is down by 1.652% at US$4049.33/oz.
Technicals in Focus:
On the daily charts, gold trades higher than 20DMA (2197). If it drops below this level, it could lead to 2,100. The MACD is currently above the zero line and the histograms are showing an increasing trend, indicating that there may be upward movement in the coming sessions. The RSI is currently at 83.04, which is in the overbought region, suggesting there may be selling pressure in the next 2 to 3 sessions. The Stochastic Oscillator is also in the overbought territory but has given a positive crossover, indicating a bullish stance for intraday trades, but rebound in expected in all the overbought indicators.
Trading Strategy: Sell on Strength
Sell below 4032-4400 keeping stop loss closing above 4400, targeting 4017-3990-3974-3958 and 3942-3920-3900. Buy in between 4056-3900 with risk below 3866 targeting 4132-4144-4160-4188 and 4200-4225-4253. |
|
| Intraday Support Levels |
| S1 |
|
|
4017-3990 |
| S2 |
|
|
3974-3958-3942 |
| S3 |
|
|
3920-3900-3886 |
| Intraday Resistance Levels |
| R1 |
|
|
4056-4085-4100-4132 |
| R2 |
|
|
4144-4160-4188 |
| R3 |
|
|
4200-4225-4253 |
| Technical Indicators
|
| Name |
|
Value |
Action |
| 14DRSI |
|
52.916 |
Buy |
| 20-DMA |
|
4800.67 |
Buy |
| 50-DMA |
|
4497.76 |
Buy |
| 100-DMA |
|
4239.36 |
Buy |
| 200-DMA |
|
3800.35 |
Buy |
| STOCH(5,3) |
|
26.933 |
Sell |
| MACD(12,26,9) |
|
150.924 |
Buy |
|
|
|
|
Silver - XAG
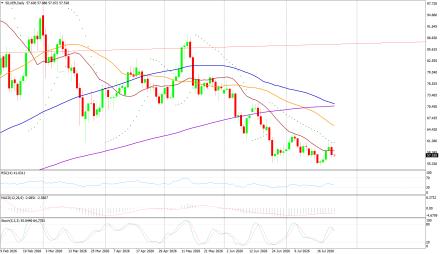
Silver on Thursday its intraday high of US$60.06/oz and low of US$57.04/oz settle down by 3.446% at US$57.62/oz.
Technicals in Focus:
On daily charts, silver is sustaining above 20MA (25.05), breakage above will lead to 23.73. MACD is below the zero line and histograms are increasing trend, bringing a bullish stance in the upcoming sessions. RSI is in the oversold region, indicating a sell signal for now. The Stochastic Oscillator is in the overbought region and gives a positive crossover to show an upside move for the intraday trade.
Trading Strategy: Buy on Dips
Buy in between 57.00-54.00 targeting 59.90-60.50-61.00-61.48 and 62.00-63.25-64.00-65.10 with stop loss should be placed on the breakage below 53.00.
Sell in between 57.70-64.45 with a stop loss above 65.00 targeting 57.00- 56.40-55.60-55.00 and 54.60-54.10-53.30.
|
|
| Intraday Support Levels |
| S1 |
|
|
57.00-56.40-55.60 |
| S2 |
|
|
55.00-54.60-54.30 |
| S3 |
|
|
54.00-53.30 |
| Intraday Resistance Levels |
| R1 |
|
|
57.70-58.00-58.40 |
| R2 |
|
|
59.00-59.90-60.50 |
| R3 |
|
|
61.40-62.00-63.25 |
| TECHNICAL INDICATORS |
| Name |
|
Value |
Action |
| 14DRSI |
|
46.1562 |
Buy |
| 20-DMA |
|
92.99 |
Sell |
| 50-DMA |
|
75.81 |
Sell |
| 100-DMA |
|
62.03 |
Sell |
| 200-DMA |
|
49.29 |
Sell |
| STOCH(5,3) |
|
21.094 |
Buy |
| MACD(12,26,9) |
|
5.262 |
Buy |
|
|
|
|
Oil - WTI
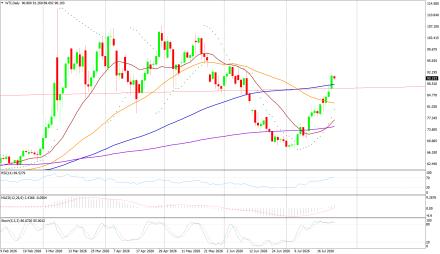
Crude Oil on Thursday high of US$92.22/bbl, an intraday low of US$86.51/bbl, and settled up by 4.811% to close at US$91.05/bbl.
Technicals in Focus:
On daily charts, oil is sustaining above its 100DMA i.e. 75.37, a support level, and breakage above will call for 77.48. MACD is above the zero line and histograms are in increasing mode will bring a bullish stance in the upcoming sessions. The Stochastic Oscillator is in the overbought region, giving a negative crossover to confirm a bearish stance; while the RSI is in the neutral region, more upsides can be expected to reach the overbought region, which is highly probable.
Trading Strategy: Neutral to Sell
Sell in between 90.50-94.10 with stop loss at 95.00 targeting 89.70-88.10-87.00-86.20 and 85.50-84.90-84.05-83.00.
Buy above 87.05-77.60 with risk daily closing below 77.00, targeting 90.50 and 91.10-91.80-92.50-93.00.
|
|
| Intraday Support Levels |
| S1 |
|
|
89.70-88.10-87.50 |
| S2 |
|
|
87.00-86.20-85.50 |
| S3 |
|
|
84.90-84.05-83.00 |
| Intraday Resistance Levels |
| R1 |
|
|
90.50-91.10 |
| R2 |
|
|
91.80-92.50-93.00 |
| R3 |
|
|
93.60-94.10-94.84 |
| TECHNICAL INDICATORS |
| Name |
|
Value |
Action |
| 14DRSI |
|
29.346 |
Sell |
| 20-DMA |
|
67.35 |
Sell |
| 50-DMA |
|
69.06 |
Sell |
| 100-DMA |
|
70.28 |
Sell |
| 200-DMA |
|
71.85 |
Sell |
| STOCH(5,3) |
|
16.166 |
Sell |
| MACD(12,26,9) |
|
-1.306 |
Buy |
|
|
|
|
EUR/USD
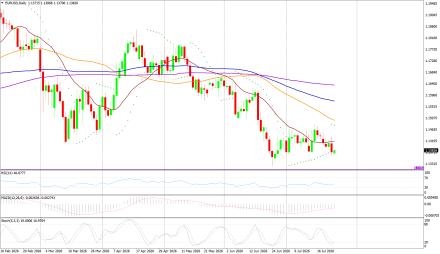
EUR/USD on Thursday made an intraday low of US$1.1363/EUR, a high of US$1.1435/EUR, and settled down by 0.290% to close at US$1.1376/EUR.
Technicals in Focus:
On daily charts, prices are sustaining above 100DMA (1.1661), which becomes immediate support, a break below will target 1.1695. MACD is above the zero line and histograms are increasing mode, bringing a bullish view. Stochastic is in oversold territory, giving negative crossovers to the bullish outlook for intraday. 14D RSI is currently in a neutral region and giving no directions to consider right now.
Trading Strategy: Neutral to Sell
Sell below 1.1400-1.1650, targeting 1.1405-1.1370-1.1355 and 1.1323-1.1390-1.1360-1.1310 with stop-loss at daily closing above 1.1520.
Buy above 1.1370-1.1250 with risk below 1.1250 targeting 1.1440-1.1465-1.1485-1.1590 and 1.1610-1.1650.
|
|
| Intraday Support Levels |
| S1 |
|
|
1.1370 |
| S2 |
|
|
1.1370-1.1355-1.1323 |
| S3 |
|
|
1.1390-1.1360-1.1310 |
| Intraday Resistance Levels |
| R1 |
|
|
1.1400-1.1440-1.1465 |
| R2 |
|
|
1.1485-1.1510-1.1550 |
| R3 |
|
|
1.1588-1.1610-1.1650 |
| TECHNICAL INDICATORS |
| Name |
|
Value |
Action |
| 14DRSI |
|
48.897 |
Buy |
| 20-DMA |
|
1.1695 |
Sell |
| 50-DMA |
|
1.1656 |
Buy |
| 100-DMA |
|
1.1661 |
Buy |
| 200-DMA |
|
1.1585 |
Buy |
| STOCH(5,3) |
|
55.688 |
Buy |
| MACD(12,26,9) |
|
-0.0013 |
|
|
|
|
|
GBP/USD
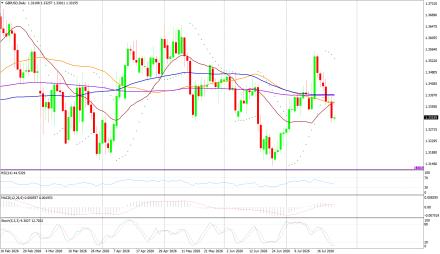
GBP/USD on Thursday made a intraday low of US$1.3298/GBP, a high of US$1.3392/GBP, and settled the day down by 0.447% to close at US$1.3312/GBP.
Technicals in Focus:
On daily charts, prices are sustaining above 50DMA (1.2674) is becoming a support level. 14-D RSI is currently in a neutral region and direction is difficult to predict on an RSI basis. The Stochastic Oscillator is in oversold territory and gives a positive crossover to confirm a bullish stance. MACD is above the zero line, but histograms are increasing leading to movement.
Trading Strategy: Neutral to Buy
Based on the charts and explanations above; buy between 1.3310-1.3079 with a target of 1.1.3440-1.3490-1.3520-1.3540-1.3570 and 1.3600-1.3640-1.3690 with a stop loss closing below 1.3150.
Sell in between 1.3350-1.3820 with targets at 1.3300-1.3270-1.3190 and 1.3150-1.3135-1.3120-1.3100 with a stop loss of 1.3900.
|
|
| Intraday Support Levels |
| S1 |
|
|
1.3315-1.3290-1.3270 |
| S2 |
|
|
1.3300-1.3270-1.3200 |
| S3 |
|
|
1.3160-1.3100 |
| Intraday Resistance Levels |
| R1 |
|
|
1.3350-1.3380-1.3410 |
| R2 |
|
|
1.3440-1.3490-1.3520 |
| R3 |
|
|
1.3540-1.3600 1.3640 |
| TECHNICAL INDICATORS |
| Name |
|
Value |
Action |
| 14DRSI |
|
46.905 |
Buy |
| 20-DMA |
|
1.2932 |
Buy |
| 50-DMA |
|
1.2736 |
Buy |
| 100-DMA |
|
1.2629 |
Buy |
| 200-DMA |
|
1.2811 |
Buy |
| STOCH(5,3) |
|
9.458 |
Buy |
| MACD(12,26,9) |
|
-0.003 |
Sell |
|
|
|
|
USD/JPY
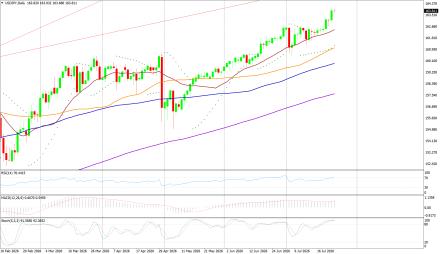
USD/JPY on Wednesday made an intra‐day low of JPY162.67/USD an intraday high of 163.21/USD, and settled the day down by 0.0055% at JPY163.12/USD.
Technicals in Focus:
In daily charts, JPY is sustaining above 100DMA (152.35), major support on the daily chart. 14-D RSI is currently in the overbought region and chances of downward are expected based on RSI. MACD is above the zero line but histograms are decreasing mode which might lead to downward movement. The Stochastic Oscillator is in overbought territory and signaling to sell as it has given a negative crossover to confirm a bearish stance.
Trading Strategy: Neutral to Sell
Sell below 163.50-166.90 with risk above 167.00 targeting 162.90-162.50-161.90-161.00-160.70 and 159.40-158.70-158.10-157.00.
Long positions above 162.90-152.00 with targets of 163.00-163.50 and 164.00-164.60-165.00 with stops below 152.00.
|
|
| Intraday Support Levels |
| S1 |
|
|
162.90-162.50-161.9 |
| S2 |
|
|
161.40-161.00-160.7 |
| S3 |
|
|
160.00-159.40 |
| INTRADAY RESISTANCE LEVELS |
| R1 |
|
|
163.50-164.00 |
| R2 |
|
|
164.60-165.00 |
| R3 |
|
|
166.00-166.70 |
| TECHNICAL INDICATORS |
| Name |
|
Value |
Action |
| 14DRSI |
|
41.14 |
Buy |
| 20-DMA |
|
148.91 |
Buy |
| 50-DMA |
|
150.24 |
Buy |
| 100-DMA |
|
150.24 152.53 |
Buy |
| 200-DMA |
|
151.18 |
Buy |
| STOCH(9,6) |
|
93.662 |
Sell |
| MACD(12,26,9) |
|
0.683 |
Sell |
|
|
|
 |