 |
|
|
Daily Market Lookup
- The U.S. dollar turned marginally higher on Monday, but moves were largely rangebound as currency market participants geared up for a crucial week filled with monetary policy developments. A slump in oil prices to start the week helped ease inflationary concerns and dented safe-haven demand. The dollar on Friday had posted its best week in over a month, as a widening conflict in the Middle East added to expectations of interest rate hikes to combat oil-driven inflationary pressures The Federal Reserve on Wednesday is mostly expected to hold interest rates steady, with the CME FedWatch tool showing a probability of about 62% for that outcome. However, the outlook for monetary policy has largely been in flux this month amid the dynamic situation in the Middle East. Oil prices surged about 20% over two weeks as the U.S. and Iran exchanged tit-for-tat strikes over control of the Strait of the Hormuz. Investors will also be keen to hear from new Fed Chair Kevin Warsh, after receiving largely hawkish commentary from him since the last central bank rate decision in June. Warsh has stressed that the Federal Open Market Committee is committed to delivering price stability. He has also unveiled a sweeping review of Fed operations by appointing five task forces to tackle items such as communications and inflation frameworks. This week’s economic calendar will also provide cues on monetary policy, as traders will receive second-quarter U.S. GDP figures and the June personal consumption expenditures (PCE) price index - the Fed’s preferred inflation gauge On Friday, sliding oil prices put pressure on the dollar. The decline came following a pause in tit-for-tat strikes between the U.S. and Iran. The New York Times on Friday reported that President Donald Trump had halted plans to sharply escalate U.S. military operations in Iran after meeting with his top advisers and senior members of the administration, citing U.S. officials. The decision was driven by dwindling Pentagon stockpiles of air defenses. The U.S. had hit Iran with strikes for 13 straight days, while Tehran had retaliated by targeting American military bases in neighboring countries. The fighting began after Iran attacked commercial ships in and around the Strait of Hormuz, leading to a collapse in an interim peace deal inked between the two sides in June. Supply disruption concerns were exacerbated after Iran-backed Houthis targeted Saudi tankers in another vital waterway, the Bab el-Mandeb Strait.
The U.S. Ambassador to the United Nations, Mike Waltz, on Sunday told Fox News that talks with Iran were "ongoing" and were "happening at every level." Turning to other major currencies, the euro was flat at $1.1367. It had earlier risen as falling energy input costs brought immediate relief to eurozone growth models, helping traders look past last week’s neutral policy stance from the European Central Bank Elsewhere, Indonesia’s rupiah weakened 0.8% after Bank Indonesia Governor Perry Warjiyo unexpectedly resigned for personal reasons Senior Deputy Governor Destry Damayanti was named interim governor to ensure operational continuity, but analysts warned the sudden leadership void could leave the rupiah vulnerable despite broader dollar weakness.
- Gold prices fell modestly on Tuesday as the U.S. dollar strengthened to near one-month highs, while investors awaited the Federal Reserve's policy decision and Chair Kevin Warsh's comments for clues on the outlook for interest rates. The US Dollar Index traded largely unchanged on Tuesday and hovered near a one-month high, making dollar-priced bullion more expensive for overseas buyers. Markets broadly expect the Fed to leave interest rates unchanged when its two-day meeting concludes on Wednesday. However, traders have increased bets that policymakers could resume tightening later this year, with markets pricing roughly a 40% chance of a rate hike this week and an 80% probability of a September increase, according to the CME FedWatch tool. Higher interest rates tend to reduce the appeal of non-yielding bullion. Investors also trimmed exposure ahead of key U.S. economic data, including second-quarter GDP and the Fed's preferred inflation gauge -- both due later in the week. Analysts said gold remains trapped in a broad range as investors await clearer guidance from the central bank Meanwhile, U.S. President Donald Trump said on Monday that Washington was having "good talks" with Iran and there was a chance of reaching a deal, while warning U.S. military strikes could resume if negotiations failed. The U.S. and Iran maintained a pause in hostilities after halting strikes over the weekend, easing fears of supply disruptions and offering some relief to inflation expectations.
- Oil prices fell 1% on Tuesday as market participants continued to weigh a pause in U.S. strikes on Iran, which has raised hope of a diplomatic solution to their conflict and the normalisation of Middle East energy flows Brent crude futures were down $0.54, or 0.6%, at $87.82 by 0046 GMT. U.S. West Texas Intermediate crude was at $81.95 a barrel, down $0.66, or 0.8%. Both contracts fell 1% earlier in the session to their lowest level in more than a week. U.S. President Donald Trump said on Monday the United States was having "good talks" with Iran and that there was a chance of a resolution. However, he said U.S. strikes would resume if negotiations failed while Iran issued similar comments about retaliation. Afrah al-Zouba, the foreign minister-designate of Yemen’s internationally recognised Saudi-backed government, said Yemen-based Houthi fighters aimed to replicate Iran’s control of shipping through the Strait of Hormuz at Bab el-Mandeb Barclays analysts said in a note on Monday "flows through the strait remain subdued". They said, in the week ended July 24, crude oil and refined product net exports through the strait averaged 2.9 million barrels a day compared with 5.9 million in the previous week. Elsewhere, U.S. crude oil stockpiles likely fell last week alongside gasoline, while distillate stocks likely rose, a preliminary Reuters poll showed on Monday.
|
|
| Intraday RESISTANCE LEVELS |
| 28th July 2026 |
R1 |
R2 |
R3 |
| GOLD-XAU |
4056-4085-4100-4132 |
4144-4160-4188 |
4200-4225-4253 |
| Silver-XAG |
57.70-58.00-58.40 |
59.00-59.90-60.50 |
61.40-62.00-63.25 |
| Crude Oil |
90.50-91.10 |
91.80-92.50-93.00 |
93.60-94.10-94.84 |
| EURO/USD |
1.1370-1.1400-1.1440-1.1465 |
1.1485-1.1510-1.1550 |
1.1588-1.1610-1.1650 |
| GBP/USD |
1.3290-1.3315-1.3350-1.3380-1.3410 |
1.3440-1.3490-1.3520 |
1.3540-1.3600 1.3640 |
| USD/JPY |
163.70-164.00 |
164.60-165.00 |
166.00-166.70 |
| Intraday SUPPORTS LEVELS |
| 28th July 2026 |
S1 |
S2 |
S3 |
| GOLD-XAU |
4017-3990 |
3974-3958-3942 |
3920-3900-3886 |
| Silver-XAG |
57.00-56.40-55.60 |
55.00-54.60-54.30 |
54.00-53.30 |
| Crude Oil |
89.70-88.10-87.50 |
87.00-86.20-85.50 |
84.90-84.05-83.00 |
| EURO/USD |
1.1355-1.1323 |
1.1390-1.1360-1.1310 |
1.1250-1.1200 |
| GBP/USD |
1.3270 |
1.3300-1.3270-1.3200 |
1.3160-1.3100 |
| USD/JPY |
162.90-162.50-161.9 |
161.40-161.00-160.7 |
160.00-159.40 |
|
|
| Intra-Day Strategy (28th July 2026) |
| GOLD-XAU |
Sell on Strength |
| Silver-XAG |
Buy on Dips |
|
| Crude Oil |
Neutral to Sell |
| EUR/USD |
Neutral to Sell |
|
| GBP/USD |
Neutral to Buy |
| USD/JPY |
Neutral to Sell |
|
|
|
|
Gold – XAU
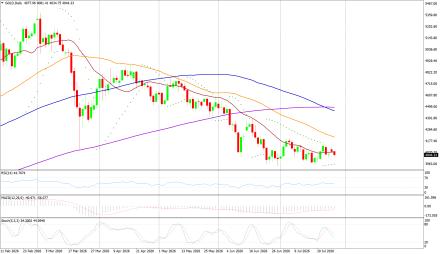
Gold on Monday interaday high of US$4116.40/oz and low of $4065.28/oz. God is down by 0.482% at US$4076.21/oz.
Technicals in Focus:
On the daily charts, gold trades higher than 20DMA (2197). If it drops below this level, it could lead to 2,100. The MACD is currently above the zero line and the histograms are showing an increasing trend, indicating that there may be upward movement in the coming sessions. The RSI is currently at 83.04, which is in the overbought region, suggesting there may be selling pressure in the next 2 to 3 sessions. The Stochastic Oscillator is also in the overbought territory but has given a positive crossover, indicating a bullish stance for intraday trades, but rebound in expected in all the overbought indicators.
Trading Strategy: Sell on Strength
Sell below 4032-4400 keeping stop loss closing above 4400, targeting 4017-3990-3974-3958 and 3942-3920-3900. Buy in between 4056-3900 with risk below 3866 targeting 4132-4144-4160-4188 and 4200-4225-4253. |
|
| Intraday Support Levels |
| S1 |
|
|
4017-3990 |
| S2 |
|
|
3974-3958-3942 |
| S3 |
|
|
3920-3900-3886 |
| Intraday Resistance Levels |
| R1 |
|
|
4056-4085-4100-4132 |
| R2 |
|
|
4144-4160-4188 |
| R3 |
|
|
4200-4225-4253 |
| Technical Indicators
|
| Name |
|
Value |
Action |
| 14DRSI |
|
52.916 |
Buy |
| 20-DMA |
|
4800.67 |
Buy |
| 50-DMA |
|
4497.76 |
Buy |
| 100-DMA |
|
4239.36 |
Buy |
| 200-DMA |
|
3800.35 |
Buy |
| STOCH(5,3) |
|
26.933 |
Sell |
| MACD(12,26,9) |
|
150.924 |
Buy |
|
|
|
|
Silver - XAG
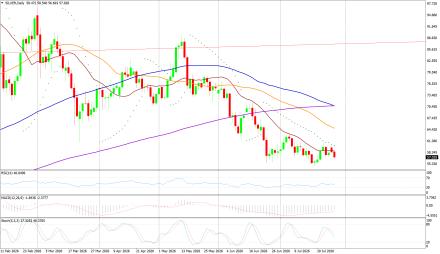
Silver on Monday its intraday high of US$60.06/oz and low of US$58.15/oz settle down by 1.99% at US$58.37/oz.
Technicals in Focus:
On daily charts, silver is sustaining above 20MA (25.05), breakage above will lead to 23.73. MACD is below the zero line and histograms are increasing trend, bringing a bullish stance in the upcoming sessions. RSI is in the oversold region, indicating a sell signal for now. The Stochastic Oscillator is in the overbought region and gives a positive crossover to show an upside move for the intraday trade.
Trading Strategy: Buy on Dips
Buy in between 57.00-54.00 targeting 59.90-60.50-61.00-61.48 and 62.00-63.25-64.00-65.10 with stop loss should be placed on the breakage below 53.00.
Sell in between 57.70-64.45 with a stop loss above 65.00 targeting 57.00- 56.40-55.60-55.00 and 54.60-54.10-53.30.
|
|
| Intraday Support Levels |
| S1 |
|
|
57.00-56.40-55.60 |
| S2 |
|
|
55.00-54.60-54.30 |
| S3 |
|
|
54.00-53.30 |
| Intraday Resistance Levels |
| R1 |
|
|
57.70-58.00-58.40 |
| R2 |
|
|
59.00-59.90-60.50 |
| R3 |
|
|
61.40-62.00-63.25 |
| TECHNICAL INDICATORS |
| Name |
|
Value |
Action |
| 14DRSI |
|
46.1562 |
Buy |
| 20-DMA |
|
92.99 |
Sell |
| 50-DMA |
|
75.81 |
Sell |
| 100-DMA |
|
62.03 |
Sell |
| 200-DMA |
|
49.29 |
Sell |
| STOCH(5,3) |
|
21.094 |
Buy |
| MACD(12,26,9) |
|
5.262 |
Buy |
|
|
|
|
Oil - WTI
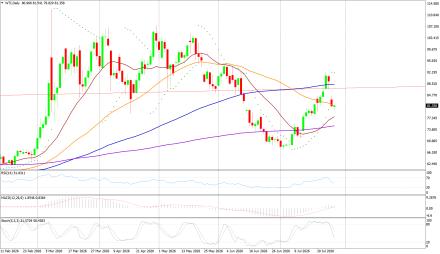
Crude Oil on Thursday high of US$84.55/bbl, an intraday low of US$80.91/bbl, and settled down by 2.545% to close at US$81.14/bbl.
Technicals in Focus:
On daily charts, oil is sustaining above its 100DMA i.e. 75.37, a support level, and breakage above will call for 77.48. MACD is above the zero line and histograms are in increasing mode will bring a bullish stance in the upcoming sessions. The Stochastic Oscillator is in the overbought region, giving a negative crossover to confirm a bearish stance; while the RSI is in the neutral region, more upsides can be expected to reach the overbought region, which is highly probable.
Trading Strategy: Neutral to Sell
Sell in between 90.50-94.10 with stop loss at 95.00 targeting 89.70-88.10-87.00-86.20 and 85.50-84.90-84.05-83.00.
Buy above 87.05-77.60 with risk daily closing below 77.00, targeting 90.50 and 91.10-91.80-92.50-93.00.
|
|
| Intraday Support Levels |
| S1 |
|
|
89.70-88.10-87.50 |
| S2 |
|
|
87.00-86.20-85.50 |
| S3 |
|
|
84.90-84.05-83.00 |
| Intraday Resistance Levels |
| R1 |
|
|
90.50-91.10 |
| R2 |
|
|
91.80-92.50-93.00 |
| R3 |
|
|
93.60-94.10-94.84 |
| TECHNICAL INDICATORS |
| Name |
|
Value |
Action |
| 14DRSI |
|
29.346 |
Sell |
| 20-DMA |
|
67.35 |
Sell |
| 50-DMA |
|
69.06 |
Sell |
| 100-DMA |
|
70.28 |
Sell |
| 200-DMA |
|
71.85 |
Sell |
| STOCH(5,3) |
|
16.166 |
Sell |
| MACD(12,26,9) |
|
-1.306 |
Buy |
|
|
|
|
EUR/USD
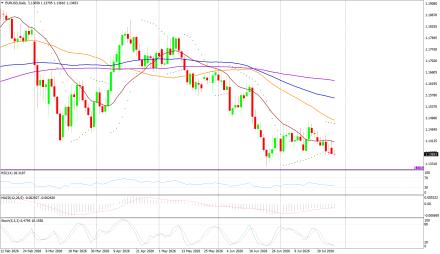
EUR/USD on Monday made an intraday low of US$1.1366/EUR, a high of US$1.1417/EUR, and settled down by 0.187% to close at US$1.1366/EUR.
Technicals in Focus:
On daily charts, prices are sustaining above 100DMA (1.1661), which becomes immediate support, a break below will target 1.1695. MACD is above the zero line and histograms are increasing mode, bringing a bullish view. Stochastic is in oversold territory, giving negative crossovers to the bullish outlook for intraday. 14D RSI is currently in a neutral region and giving no directions to consider right now.
Trading Strategy: Neutral to Sell
Sell below 1.1370-1.1650, targeting 1.1405-1.1370-1.1355 and 1.1323-1.1390-1.1360-1.1310 with stop-loss at daily closing above 1.1520.
Buy above 1.1355-1.1250 with risk below 1.1250 targeting 1.1440-1.1465-1.1485-1.1590 and 1.1610-1.1650.
|
|
| Intraday Support Levels |
| S1 |
|
|
1.1355-1.1323 |
| S2 |
|
|
1.1390-1.1360-1.1310 |
| S3 |
|
|
1.1250-1.1200 |
| Intraday Resistance Levels |
| R1 |
|
|
1.1370-1.1400-1.1440-1.1465 |
| R2 |
|
|
1.1485-1.1510-1.1550 |
| R3 |
|
|
1.1588-1.1610-1.1650 |
| TECHNICAL INDICATORS |
| Name |
|
Value |
Action |
| 14DRSI |
|
48.897 |
Buy |
| 20-DMA |
|
1.1695 |
Sell |
| 50-DMA |
|
1.1656 |
Buy |
| 100-DMA |
|
1.1661 |
Buy |
| 200-DMA |
|
1.1585 |
Buy |
| STOCH(5,3) |
|
55.688 |
Buy |
| MACD(12,26,9) |
|
-0.0013 |
|
|
|
|
|
GBP/USD
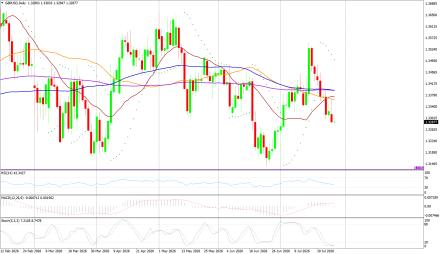
GBP/USD on Monday made a intraday low of US$1.3283/GBP, a high of US$1.3392/GBP, and settled the day down by 0.201% to close at US$1.3286/GBP.
Technicals in Focus:
On daily charts, prices are sustaining above 50DMA (1.2674) is becoming a support level. 14-D RSI is currently in a neutral region and direction is difficult to predict on an RSI basis. The Stochastic Oscillator is in oversold territory and gives a positive crossover to confirm a bullish stance. MACD is above the zero line, but histograms are increasing leading to movement.
Trading Strategy: Neutral to Buy
Based on the charts and explanations above; buy between 1.3270-1.3079 with a target of 1.1.3440-1.3490-1.3520-1.3540-1.3570 and 1.3600-1.3640-1.3690 with a stop loss closing below 1.3150.
Sell in between 1.3290-1.3820 with targets at 1.3300-1.3270-1.3190 and 1.3150-1.3135-1.3120-1.3100 with a stop loss of 1.3900.
|
|
| Intraday Support Levels |
| S1 |
|
|
1.3270 |
| S2 |
|
|
1.3300-1.3270-1.3200 |
| S3 |
|
|
1.3160-1.3100 |
| Intraday Resistance Levels |
| R1 |
|
|
1.3290-1.3315-1.3350-1.3380-1.3410 |
| R2 |
|
|
1.3440-1.3490-1.3520 |
| R3 |
|
|
1.3540-1.3600 1.3640 |
| TECHNICAL INDICATORS |
| Name |
|
Value |
Action |
| 14DRSI |
|
46.905 |
Buy |
| 20-DMA |
|
1.2932 |
Buy |
| 50-DMA |
|
1.2736 |
Buy |
| 100-DMA |
|
1.2629 |
Buy |
| 200-DMA |
|
1.2811 |
Buy |
| STOCH(5,3) |
|
9.458 |
Buy |
| MACD(12,26,9) |
|
-0.003 |
Sell |
|
|
|
|
USD/JPY
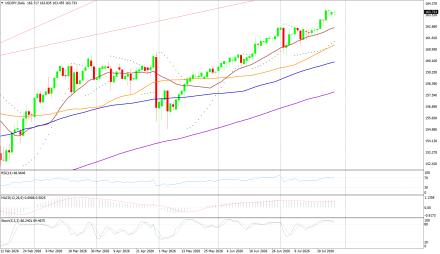
USD/JPY on Monday made an intra‐day low of JPY161.27/USD an intraday high of 163.78/USD, and settled the day up by 0.113% at JPY163.72/USD.
Technicals in Focus:
In daily charts, JPY is sustaining above 100DMA (152.35), major support on the daily chart. 14-D RSI is currently in the overbought region and chances of downward are expected based on RSI. MACD is above the zero line but histograms are decreasing mode which might lead to downward movement. The Stochastic Oscillator is in overbought territory and signaling to sell as it has given a negative crossover to confirm a bearish stance.
Trading Strategy: Neutral to Sell
Sell below 163.90-166.90 with risk above 167.00 targeting 162.90-162.50-161.90-161.00-160.70 and 159.40-158.70-158.10-157.00.
Long positions above 162.90-152.00 with targets of 163.00-163.50 and 164.00-164.60-165.00 with stops below 152.00.
|
|
| Intraday Support Levels |
| S1 |
|
|
162.90-162.50-161.9 |
| S2 |
|
|
161.40-161.00-160.7 |
| S3 |
|
|
160.00-159.40 |
| INTRADAY RESISTANCE LEVELS |
| R1 |
|
|
163.70-164.00 |
| R2 |
|
|
164.60-165.00 |
| R3 |
|
|
166.00-166.70 |
| TECHNICAL INDICATORS |
| Name |
|
Value |
Action |
| 14DRSI |
|
41.14 |
Buy |
| 20-DMA |
|
148.91 |
Buy |
| 50-DMA |
|
150.24 |
Buy |
| 100-DMA |
|
152.53 |
Buy |
| 200-DMA |
|
151.18 |
Buy |
| STOCH(9,6) |
|
93.662 |
Sell |
| MACD(12,26,9) |
|
0.683 |
Sell |
|
|
|
 |