 |
|
|
Daily Market Lookup
- The U.S. dollar on Wednesday posted its worst day in about four weeks, after the Federal Reserve held interest rates steady, allaying fears that the central bank would surprise the market with policy tightening. The Federal Open Market Committee (FOMC) kept the federal funds rate unchanged at 3.50%-3.75% for a fifth straight meeting. While the central bank’s action had been mostly expected, the odds of a rate-hike had been higher than recent historical trends due to rapidly shifting inflationary dynamics sparked by volatile oil prices. Reflecting the uncertainty over the monetary policy outlook, Cleveland Fed President Beth Hammack, Minneapolis Fed President Neel Kashkari, and Dallas Fed President Lorie Logan voted to raise the federal funds rate by 25 basis points. At the post-decision press conference on Wednesday, Warsh said the FOMC had a "good family fight" and an "active, robust" discussion centered on four areas: persistent inflation, recent economic shocks, price pressures arising from those shocks, and monetary policy tools. He also said the dissents by the three regional Fed presidents did not "capture the full essence of the discussion." Warsh noted that the effect of soft June inflation data on the rate decision was "not much." Notably, rising U.S. Treasury yields have effectively played the role of a rate hike, as an increase in yields usually makes borrowing more expensive for consumers and businesses. The benchmark U.S. 10-year yield has jumped more than 14 basis points since the Fed’s June meeting. Warsh on Wednesday noted that increases in nominal and real yields across the Treasury curve since the last meeting had been "among the most significant in the last two decades, ranking around the top decile or so." The Fed chief said the Treasury market seemed to be reflecting factors such as solid U.S. economic output, strong capital expenditures and productivity, and "solid" and "steady" labor markets Turning away from the Fed and to the Middle East, oil prices snapped a weekly slide and soared on Wednesday, as a pause in fighting between the U.S. and Iran broke after the Islamic Revolutionary Guard Corps (IRGC) "attempted" a "surprise attack" on U.S. forces based in the Middle East, according to the U.S. military. President Donald Trump later told Fox News that the U.S. military had "just minutes" to shoot down the incoming missiles from the surprise attack, and said that Washington would respond by "hitting them hard." Separately, the U.S. military said it and Saudi Arabia’s armed forces had conducted "precision strikes" in Iraq against Iran-backed proxies that had been directed by the IRGC to attack U.S. forces and Saudi energy infrastructure. Looking at other major currencies, the slide in the dollar on Wednesday helped the euro and the sterling, with the former gaining 0.7% to $1.1462 and the latter adding 0.6% to $1.3361. Traders in the United Kingdom will be turning their focus to the Bank of England’s rate decision on Thursday.
- Gold prices gained nearly 1% on Wednesday, as an easing in the dollar after the Federal Reserve held interest rates steady managed to offset a surge in oil prices after the U.S. said it repelled a "surprise" Iranian missile attack. The Federal Open Market Committee (FOMC) kept the federal funds rate unchanged at 3.50%-3.75% for a fifth straight meeting. While the central bank’s action had been mostly expected, the odds of a rate-hike had been higher than recent historical trends due to rapidly shifting inflationary dynamics sparked by volatile oil prices. Reflecting the uncertainty over the monetary policy outlook, Cleveland Fed President Beth Hammack, Minneapolis Fed President Neel Kashkari, and Dallas Fed President Lorie Logan voted to raise the federal funds rate by 25 basis points. At the post-decision press conference on Wednesday, Warsh said the FOMC had a "good family fight" and an "active, robust" discussion centered on four areas: persistent inflation, recent economic shocks, price pressures arising from those shocks, and monetary policy tools. He also said the dissents by the three regional Fed presidents did not "capture the full essence of the discussion." Warsh noted that the effect of soft June inflation data on the rate decision was "not much." Notably, rising U.S. Treasury yields have effectively played the role of a rate hike, as an increase in yields usually makes borrowing more expensive for consumers and businesses. Turning away from the Fed and to the Middle East, oil prices snapped a weekly slide and soared on Wednesday, as a pause in fighting between the U.S. and Iran broke after the Islamic Revolutionary Guard Corps (IRGC) "attempted" a "surprise attack" on U.S. forces based in the Middle East, according to the U.S. military. President Donald Trump later told Fox News that the U.S. military had "just minutes" to shoot down the incoming missiles from the surprise attack, and said that Washington would respond by "hitting them hard." The attacks ended a four-day pause in direct military exchanges between Washington and Tehran and raised the risk of renewed escalation after a brief diplomatic opening. Separately, the U.S. military said it and Saudi Arabia’s armed forces had conducted "precision strikes" in Iraq against Iran-backed proxies that had been directed by the IRGC to attack U.S. forces and Saudi energy infrastructure.
- Oil prices erased some of their previous gains on Thursday, despite escalating attacks in the Gulf as investor focus shifted to supply flows through the key chokepoints in the region. Prices surged as U.S. President Donald Trump threatened on Wednesday to hit Iran "very hard" after an Iranian missile attack on Tuesday on a U.S. base in Jordan. On Wednesday, the U.S. and Saudi Arabia attacked Iran-backed paramilitary forces in Iraq, the first time that Saudi had publicly joined U.S. air strikes, in retaliation for drone attacks on Saudi oil targets launched from Iraq. The U.S. also carried out two hours of attacks on Iran on Wednesday, the U.S. Central Command said. That ended a lull in U.S. strikes on Iran that began over the weekend. Ye said the market is following a pattern: geopolitical headlines are triggering rapid price spikes, but those gains are often short-lived as actual supply flows and parallel diplomatic efforts tend to determine how long those upward price moves persist. Prices are being capped as crude supply is still moving from the key Gulf region despite the near shutdown of the Strait of Hormuz. Iran closed the waterway, through which around a fifth of global oil and gas flows previously passed, after the U.S.-Israeli war began on February 28. Rystad Energy estimates about 13 million barrels per day of oil from the Gulf is still reaching markets. Even after the Iran-aligned Houthis in Yemen imposed a naval blockade on Saudi Arabia in the Red Sea on July 20, disrupting shipping in the Bab el-Mandeb strait, some cargoes, particularly on Chinese-connected tankers, have flowed to markets.
|
|
| Intraday RESISTANCE LEVELS |
| 30th July 2026 |
R1 |
R2 |
R3 |
| GOLD-XAU |
4056-4085-4100-4132 |
4144-4160-4188 |
4200-4225-4253 |
| Silver-XAG |
57.70-58.00-58.40 |
59.00-59.90-60.50 |
61.40-62.00-63.25 |
| Crude Oil |
83.00 |
84.05-84.90-85.50 |
86.20-87.00-88.10 |
| EURO/USD |
1.1465 |
1.1485-1.1510-1.1550 |
1.1588-1.1610-1.1650 |
| GBP/USD |
1.3350-1.3380-1.3410 |
1.3440-1.3490-1.3520 |
1.3540-1.3600 1.3640 |
| USD/JPY |
163.70-164.00 |
164.60-165.00 |
166.00-166.70 |
| Intraday SUPPORTS LEVELS |
| 30th July 2026 |
S1 |
S2 |
S3 |
| GOLD-XAU |
4017-3990 |
3974-3958-3942 |
3920-3900-3886 |
| Silver-XAG |
57.00-56.40-55.60 |
55.00-54.60-54.30 |
54.00-53.30 |
| Crude Oil |
82.15-81.40 |
80.85-80.10-79.30 |
78.70-78.25-77.50 |
| EURO/USD |
1.1440-1.1400-1.1370 |
1.1355-1.1323-1.1390 |
1.1360-1.1310-1.1250 |
| GBP/USD |
1.3315-1.3290-1.3270 |
1.3200-1.3160-1.3100 |
1.3060 |
| USD/JPY |
162.90-162.50-161.9 |
161.40-161.00-160.7 |
160.00-159.40 |
|
|
| Intra-Day Strategy (30th July 2026) |
| GOLD-XAU |
Sell on Strength |
| Silver-XAG |
Buy on Dips |
|
| Crude Oil |
Neutral to Sell |
| EUR/USD |
Neutral to Sell |
|
| GBP/USD |
Neutral to Buy |
| USD/JPY |
Neutral to Sell |
|
|
|
|
Gold – XAU
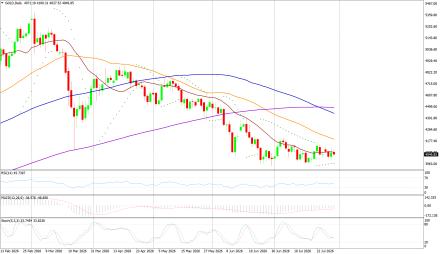
Gold on Wednesday interaday high of US$4116.30/oz and low of $4065.28/oz. God is down by 0.482% at US$4067.00/oz.
Technicals in Focus:
On the daily charts, gold trades higher than 20DMA (2197). If it drops below this level, it could lead to 2,100. The MACD is currently above the zero line and the histograms are showing an increasing trend, indicating that there may be upward movement in the coming sessions. The RSI is currently at 83.04, which is in the overbought region, suggesting there may be selling pressure in the next 2 to 3 sessions. The Stochastic Oscillator is also in the overbought territory but has given a positive crossover, indicating a bullish stance for intraday trades, but rebound in expected in all the overbought indicators.
Trading Strategy: Sell on Strength
Sell below 4032-4400 keeping stop loss closing above 4400, targeting 4017-3990-3974-3958 and 3942-3920-3900. Buy in between 4056-3900 with risk below 3866 targeting 4132-4144-4160-4188 and 4200-4225-4253. |
|
| Intraday Support Levels |
| S1 |
|
|
4017-3990 |
| S2 |
|
|
3974-3958-3942 |
| S3 |
|
|
3920-3900-3886 |
| Intraday Resistance Levels |
| R1 |
|
|
4056-4085-4100-4132 |
| R2 |
|
|
4144-4160-4188 |
| R3 |
|
|
4200-4225-4253 |
| Technical Indicators
|
| Name |
|
Value |
Action |
| 14DRSI |
|
52.916 |
Buy |
| 20-DMA |
|
4800.67 |
Buy |
| 50-DMA |
|
4497.76 |
Buy |
| 100-DMA |
|
4239.36 |
Buy |
| 200-DMA |
|
3800.35 |
Buy |
| STOCH(5,3) |
|
26.933 |
Sell |
| MACD(12,26,9) |
|
150.924 |
Buy |
|
|
|
|
Silver - XAG
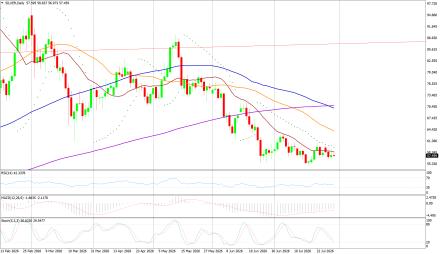
Silver on Wednesday its intraday high of US$58.54/oz and low of US$56.62/oz settle up by 0.825 at US$57.09/oz.
Technicals in Focus:
On daily charts, silver is sustaining above 20MA (25.05), breakage above will lead to 23.73. MACD is below the zero line and histograms are increasing trend, bringing a bullish stance in the upcoming sessions. RSI is in the oversold region, indicating a sell signal for now. The Stochastic Oscillator is in the overbought region and gives a positive crossover to show an upside move for the intraday trade.
Trading Strategy: Buy on Dips
Buy in between 57.00-54.00 targeting 59.90-60.50-61.00-61.48 and 62.00-63.25-64.00-65.10 with stop loss should be placed on the breakage below 53.00.
Sell in between 57.70-64.45 with a stop loss above 65.00 targeting 57.00- 56.40-55.60-55.00 and 54.60-54.10-53.30.
|
|
| Intraday Support Levels |
| S1 |
|
|
57.00-56.40-55.60 |
| S2 |
|
|
55.00-54.60-54.30 |
| S3 |
|
|
54.00-53.30 |
| Intraday Resistance Levels |
| R1 |
|
|
57.70-58.00-58.40 |
| R2 |
|
|
59.00-59.90-60.50 |
| R3 |
|
|
61.40-62.00-63.25 |
| TECHNICAL INDICATORS |
| Name |
|
Value |
Action |
| 14DRSI |
|
46.1562 |
Buy |
| 20-DMA |
|
92.99 |
Sell |
| 50-DMA |
|
75.81 |
Sell |
| 100-DMA |
|
62.03 |
Sell |
| 200-DMA |
|
49.29 |
Sell |
| STOCH(5,3) |
|
21.094 |
Buy |
| MACD(12,26,9) |
|
5.262 |
Buy |
|
|
|
|
Oil - WTI
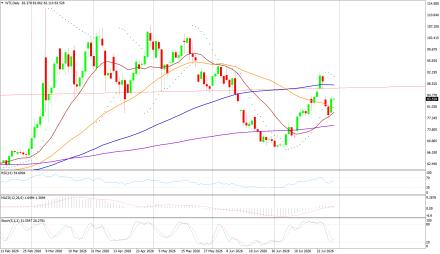
Crude Oil on Wednesday high of US$84.27/bbl, an intraday low of US$78.90/bbl, and settled up by 5.66% to close at US$83.53/bbl.
Technicals in Focus:
On daily charts, oil is sustaining above its 100DMA i.e. 75.37, a support level, and breakage above will call for 77.48. MACD is above the zero line and histograms are in increasing mode will bring a bullish stance in the upcoming sessions. The Stochastic Oscillator is in the overbought region, giving a negative crossover to confirm a bearish stance; while the RSI is in the neutral region, more upsides can be expected to reach the overbought region, which is highly probable.
Trading Strategy: Neutral to Sell
Sell in between 83.00-90.50 with stop loss at 91.00 targeting 81.00-82.15-83.00-84.05 and 84.90-85.50-86.20-87.00.
Buy above 82.05-74.60 with risk daily closing below 74.00, targeting 80.80-80.10-79.30-78.70 and 78.25-77.50-76.00-75.40.
|
|
| Intraday Support Levels |
| S1 |
|
|
82.15-81.40 |
| S2 |
|
|
80.85-80.10-79.30 |
| S3 |
|
|
78.70-78.25-77.50 |
| Intraday Resistance Levels |
| R1 |
|
|
83.00 |
| R2 |
|
|
84.05-84.90-85.50 |
| R3 |
|
|
86.20-87.00-88.10 |
| TECHNICAL INDICATORS |
| Name |
|
Value |
Action |
| 14DRSI |
|
29.346 |
Sell |
| 20-DMA |
|
67.35 |
Sell |
| 50-DMA |
|
69.06 |
Sell |
| 100-DMA |
|
70.28 |
Sell |
| 200-DMA |
|
71.85 |
Sell |
| STOCH(5,3) |
|
16.166 |
Sell |
| MACD(12,26,9) |
|
-1.306 |
Buy |
|
|
|
|
EUR/USD
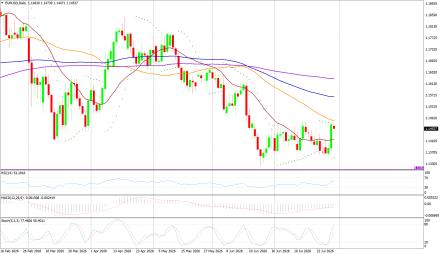
EUR/USD on Wednesday made an intraday low of US$1.1373/EUR, a high of US$1.1470/EUR, and settled up by 0.729% to close at US$1.1467/EUR.
Technicals in Focus:
On daily charts, prices are sustaining above 100DMA (1.1661), which becomes immediate support, a break below will target 1.1695. MACD is above the zero line and histograms are increasing mode, bringing a bullish view. Stochastic is in oversold territory, giving negative crossovers to the bullish outlook for intraday. 14D RSI is currently in a neutral region and giving no directions to consider right now.
Trading Strategy: Neutral to Sell
Sell below 1.1440-1.1650, targeting 1.14051.1370-1.1355 and 1.1323-1.1390-1.1360-1.1310 with stop-loss at daily closing above 1.1520.
Buy above 1.1390-1.1250 with risk below 1.1250 targeting 1.1440-1.1465-1.1485-1.1590 and 1.1610-1.1650.
|
|
| Intraday Support Levels |
| S1 |
|
|
1.1440-1.1400-1.1370 |
| S2 |
|
|
1.1355-1.1323-1.1390 |
| S3 |
|
|
1.1360-1.1310-1.1250 |
| Intraday Resistance Levels |
| R1 |
|
|
1.1465 |
| R2 |
|
|
1.1485-1.1510-1.1550 |
| R3 |
|
|
1.1588-1.1610-1.1650 |
| TECHNICAL INDICATORS |
| Name |
|
Value |
Action |
| 14DRSI |
|
48.897 |
Buy |
| 20-DMA |
|
1.1695 |
Sell |
| 50-DMA |
|
1.1656 |
Buy |
| 100-DMA |
|
1.1661 |
Buy |
| 200-DMA |
|
1.1585 |
Buy |
| STOCH(5,3) |
|
55.688 |
Buy |
| MACD(12,26,9) |
|
-0.0013 |
|
|
|
|
|
GBP/USD
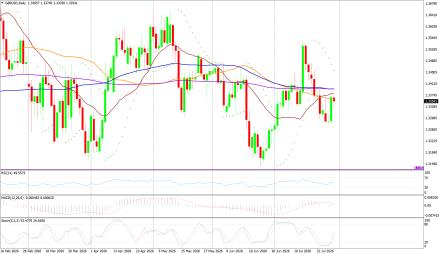
GBP/USD on Tuesday made a intraday low of US$1.3278/GBP, a high of US$1.3386/GBP, and settled the day down by 0.201% to close at US$1.3367/GBP.
Technicals in Focus:
On daily charts, prices are sustaining above 50DMA (1.2674) is becoming a support level. 14-D RSI is currently in a neutral region and direction is difficult to predict on an RSI basis. The Stochastic Oscillator is in oversold territory and gives a positive crossover to confirm a bullish stance. MACD is above the zero line, but histograms are increasing leading to movement.
Trading Strategy: Neutral to Buy
Based on the charts and explanations above; buy between 1.3315-1.3079 with a target of 1.3350-1.3410-1.3440-1.3490-1.3520-1.3540-1.3570 and 1.3600-1.3640-1.3690 with a stop loss closing below 1.3150.
Sell in between 1.3350-1.3820 with targets at 1.3300-1.3270-1.3190 and 1.3150-1.3135-1.3120-1.3100 with a stop loss of 1.3900.
|
|
| Intraday Support Levels |
| S1 |
|
|
1.3315-1.3290-1.3270 |
| S2 |
|
|
1.3200-1.3160-1.3100 |
| S3 |
|
|
1.3060 |
| Intraday Resistance Levels |
| R1 |
|
|
1.3350-1.3380-1.3410 |
| R2 |
|
|
1.3440-1.3490-1.3520 |
| R3 |
|
|
1.3540-1.3600 1.3640 |
| TECHNICAL INDICATORS |
| Name |
|
Value |
Action |
| 14DRSI |
|
46.905 |
Buy |
| 20-DMA |
|
1.2932 |
Buy |
| 50-DMA |
|
1.2736 |
Buy |
| 100-DMA |
|
1.2629 |
Buy |
| 200-DMA |
|
1.2811 |
Buy |
| STOCH(5,3) |
|
9.458 |
Buy |
| MACD(12,26,9) |
|
-0.003 |
Sell |
|
|
|
|
USD/JPY
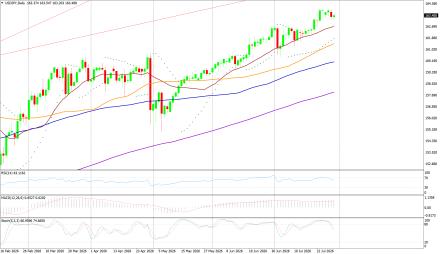
USD/JPY on Wednesday made an intra‐day low of JPY163.22/USD an intraday high of 163.90/USD, and settled the day down by 0.214% at JPY163.28/USD.
Technicals in Focus:
In daily charts, JPY is sustaining above 100DMA (152.35), major support on the daily chart. 14-D RSI is currently in the overbought region and chances of downward are expected based on RSI. MACD is above the zero line but histograms are decreasing mode which might lead to downward movement. The Stochastic Oscillator is in overbought territory and signaling to sell as it has given a negative crossover to confirm a bearish stance.
Trading Strategy: Neutral to Sell
Sell below 163.90-166.90 with risk above 167.00 targeting 162.90-162.50-161.90-161.00-160.70 and 159.40-158.70-158.10-157.00.
Long positions above 162.90-152.00 with targets of 163.00-163.50 and 164.00-164.60-165.00 with stops below 152.00.
|
|
| Intraday Support Levels |
| S1 |
|
|
162.90-162.50-161.9 |
| S2 |
|
|
161.40-161.00-160.7 |
| S3 |
|
|
160.00-159.40 |
| INTRADAY RESISTANCE LEVELS |
| R1 |
|
|
163.70-164.00 |
| R2 |
|
|
164.60-165.00 |
| R3 |
|
|
166.00-166.70 |
| TECHNICAL INDICATORS |
| Name |
|
Value |
Action |
| 14DRSI |
|
41.14 |
Buy |
| 20-DMA |
|
148.91 |
Buy |
| 50-DMA |
|
150.24 |
Buy |
| 100-DMA |
|
152.53 |
Buy |
| 200-DMA |
|
151.18 |
Buy |
| STOCH(9,6) |
|
93.662 |
Sell |
| MACD(12,26,9) |
|
0.683 |
Sell |
|
|
|
 |