 |
|
|
Daily Market Lookup
- The U.S. dollar was little changed on Tuesday, as the big story in foreign exchange markets continued to be the yen. The Japanese currency weakened against the greenback, but was still well above the four-decade low it had hit before last week’s landmark intervention. U.S. Treasury Secretary Scott Bessent earlier this week confirmed that Washington had stepped in and conducted the first joint buying of yen with Japan since 2011. This was also the first time the U.S. specifically stepped in to strengthen the yen since 1998. Bessent on Tuesday told CNBC that the U.S. had helped because any weakness in the yen could destabilize markets across Asia Before the latest intervention, the yen had slid to a forty-year trough against the dollar at 164. A sliding yen puts pressure on Japan’s import-heavy economy. Japan’s status as the singe largest foreign holder of U.S. Treasury bonds also makes fluctuations in the yen notable. To mitigate potential market disruptions, both countries’ finance ministries have signaled plans to utilize the Federal Reserve’s Foreign and International Monetary Authorities (FIMA) Repo Facility during subsequent market operations. At home, the U.S. dollar index, which tracks the greenback against a basket of six major peers, was essentially flat at 99.88. After posting a sizable decline last week driven by a combination of a clouded Federal Reserve rate outlook and the yen intervention, the dollar index has largely tread water. Monetary policy watchers are keeping an eye on U.S. labor market data this week for further cues on rates. On Tuesday, the Bureau of Labor Statistics reported 7.359 million job openings in June versus an estimate of 7.454 million. May openings were revised lower to 7.537 million from 7.594 million. Openings had surged to 7.585 million in April, the highest since May 2024. While the reading came in cooler than anticipated, the overall report suggested that the U.S. labor market remained strong. Hires in June were unchanged, and so were total separations. Within separations, quits and layoffs and discharges were flat as well. The data also supports the Fed’s recent switch to focusing more on its inflation mandate as its maximum employment mandate appears to be well in hand. Volatility in oil prices due to the ongoing conflict in the Middle East has upended inflationary dynamics and caused division among Fed policymakers as to the appropriate path of monetary policy. Economic data on the labor market this week will culminate in Friday’s July nonfarm payrolls report. Turning to the Middle East, oil prices extended their slide to a second straight day on Tuesday, keeping a check on inflationary pressures. Bessent told CNBC that he believed that Washington and Tehran were nearing an agreement, noting that "there is a chance we may have a deal today or tomorrow" to open the Strait of Hormuz and "move towards a more normalized position in this conflict." Elsewhere, Qatar said a push to forge a diplomatic resolution to the Iran war is ongoing, with the efforts focused on de-escalation and the reopening of the Strait of Hormuz, according to media reports. The Gulf country, which has served as a regional mediator between Iran and the U.S., reportedly added that language on a possible deal has been drafted and is being circulated among negotiators. While there is currently no agreement to hold direct talks, a short-term resolution is the focus for Qatar, the reports said.
- Gold prices ticked up on Tuesday, as oil slumped for a second straight session after the U.S. touted an imminent reopening of the critical Strait of Hormuz. Precious metal market participants also gauged labor market data for further cues on monetary policy. Gold has recently remained in a trading range of between around $4,000/oz and $4,100/oz, with a lack of a breakout on either side amid contrasting signals from a clouded outlook on interest rates and volatile geopolitical developments in the Middle East. The focus remained on any progress in diplomatic talks between Washington and Tehran. U.S. Treasury Secretary Scott Bessent told CNBC that he believed an agreement was being neared, noting that "there is a chance we may have a deal today or tomorrow" to open the Strait of Hormuz and "move towards a more normalized position in this conflict." Meanwhile, Qatar said a push to forge a diplomatic resolution to the Iran war is ongoing, with the efforts focused on de-escalation and the reopening of the strait, according to media reports. The Gulf country, which has served as a regional mediator between the U.S. and Iran, reportedly added that language on a possible deal has been drafted and is being circulated among negotiators. While there is currently no agreement to hold direct talks, a short-term resolution is the focus for Qatar, the reports said. Earlier in the week, President Donald Trump asserted that revived talks with Iran would soon start, although Iranian foreign ministry spokesperson Esmaeil Baqaei denied that any such dialogue was taking place. Trump responded by calling Iranian leadership "unbelievably duplicitous." Tehran did confirm that talks with Oman were ongoing over the status of the Strait of Hormuz. But traffic through the vital waterway was scant, while military tensions in the Gulf remained heightened. Away from the Middle East, the U.S. economic calendar was in focus. On Tuesday, the Bureau of Labor Statistics reported 7.359 million job openings in June versus an estimate of 7.454 million. May openings were revised lower to 7.537 million from 7.594 million. Openings had surged to 7.585 million in April, the highest since May 2024. While the reading came in cooler than anticipated, the overall report suggested that the U.S. labor market remained strong. Hires in June were unchanged, and so were total separations. Within separations, quits and layoffs and discharges were flat as well. The data also supports the Fed’s recent switch to focusing more on its inflation mandate as its maximum employment mandate appears to be well in hand. Volatility in oil prices due to the ongoing conflict in the Middle East has upended inflationary dynamics and caused division among Fed policymakers as to the appropriate path of monetary policy. Economic data on the labor market this week will culminate in Friday’s July nonfarm payrolls report
|
|
| Intraday RESISTANCE LEVELS |
| 5th August 2026 |
R1 |
R2 |
R3 |
| GOLD-XAU |
4144-4160-4188 |
4200-4225-4253 |
4270-4282 |
| Silver-XAG |
60.90-61.40-62.00 |
62.60-63.25-64.00 |
64.60-65.00 |
| Crude Oil |
81.40-82.15-83.00 |
84.05-84.90-85.50 |
86.20-87.00-87.90 |
| EURO/USD |
1.1540-1.1568 |
1.1588-1.1610-1.1630 |
1.1655-1.1690 |
| GBP/USD |
1.3490-1.3520 |
1.3540-1.3600 1.3640 |
1.3660-1.3690 |
| USD/JPY |
157.90-158.40-158.9 |
159.40-160.00-160.7 |
161.00-161.40-161.9 |
| Intraday SUPPORTS LEVELS |
| 5th August 2026 |
S1 |
S2 |
S3 |
| GOLD-XAU |
4132-4100-4085 |
4056-4017-3990 |
3974-3958-3942 |
| Silver-XAG |
60.50-59.90-59.00 |
58.00-57.70-57.00 |
56.40-55.60-55.00 |
| Crude Oil |
80.85-80.10-79.30 |
78.70-78.25-77.50 |
77.00-76.50 |
| EURO/USD |
1.1510-1.1485-1.1465 |
1.1440-1.1400-1.1370 |
1.1355-1.1323-1.1390 |
| GBP/USD |
1.3450-1.3410-1.3350-1.3315 |
1.3290-1.3270-1.3200 |
1.3160-1.3100-1.3060 |
| USD/JPY |
157.10-156.50-156.00 |
155.20-154.50 |
154.00-153.00 |
|
|
| Intra-Day Strategy (5th August 2026) |
| GOLD-XAU |
Sell on Strength |
| Silver-XAG |
Buy on Dips |
|
| Crude Oil |
Neutral to Sell |
| EUR/USD |
Neutral to Sell |
|
| GBP/USD |
Neutral to Buy |
| USD/JPY |
Neutral to Sell |
|
|
|
|
Gold – XAU
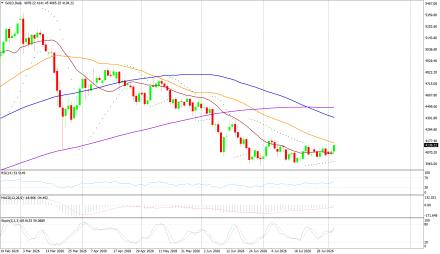
Gold on Tuesday interaday high of US$4106.28/oz and low of $4042.36/oz. God is up by 0.580% at US$4076.83/oz.
Technicals in Focus:
On the daily charts, gold trades higher than 20DMA (2197). If it drops below this level, it could lead to 2,100. The MACD is currently above the zero line and the histograms are showing an increasing trend, indicating that there may be upward movement in the coming sessions. The RSI is currently at 83.04, which is in the overbought region, suggesting there may be selling pressure in the next 2 to 3 sessions. The Stochastic Oscillator is also in the overbought territory but has given a positive crossover, indicating a bullish stance for intraday trades, but rebound in expected in all the overbought indicators.
Trading Strategy: Sell on Strength
Sell below 4144-4400 keeping stop loss closing above 4400, targeting 4132-4100-4085-4056 and 4017-3990-3974-3958. Buy in between 4132-3900 with risk below 3866 targeting 4144-4160-4188 and 4200-4225-4253. |
|
| Intraday Support Levels |
| S1 |
|
|
4132-4100-4085 |
| S2 |
|
|
4056-4017-3990 |
| S3 |
|
|
3974-3958-3942 |
| Intraday Resistance Levels |
| R1 |
|
|
4144-4160-4188 |
| R2 |
|
|
4200-4225-4253 |
| R3 |
|
|
4270-4282 |
| Technical Indicators
|
| Name |
|
Value |
Action |
| 14DRSI |
|
52.916 |
Buy |
| 20-DMA |
|
4800.67 |
Buy |
| 50-DMA |
|
4497.76 |
Buy |
| 100-DMA |
|
4239.36 |
Buy |
| 200-DMA |
|
3800.35 |
Buy |
| STOCH(5,3) |
|
26.933 |
Sell |
| MACD(12,26,9) |
|
150.924 |
Buy |
|
|
|
|
Silver - XAG
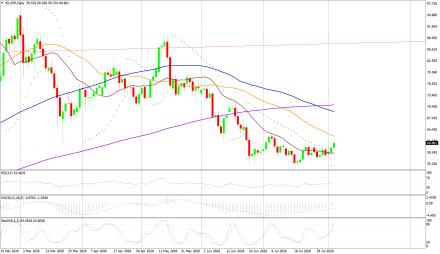
Silver on Tuesday its intraday high of US$60.03/oz and low of US$557.97/oz settle up by 2.286% at US$59.50/oz.
Technicals in Focus:
On daily charts, silver is sustaining above 20MA (25.05), breakage above will lead to 23.73. MACD is below the zero line and histograms are increasing trend, bringing a bullish stance in the upcoming sessions. RSI is in the oversold region, indicating a sell signal for now. The Stochastic Oscillator is in the overbought region and gives a positive crossover to show an upside move for the intraday trade.
Trading Strategy: Buy on Dips
Buy in between 60.50-54.00 targeting 59.00-59.90-60.50-61.00 and 61.48-62.00-63.25-64.00-65.10 with stop loss should be placed on the breakage below 53.00.
Sell in between 60.90-64.45 with a stop loss above 65.00 targeting 57.00- 56.40-55.60-55.00 and 54.60-54.10-53.30. |
|
| Intraday Support Levels |
| S1 |
|
|
60.50-59.90-59.00 |
| S2 |
|
|
58.00-57.70-57.00 |
| S3 |
|
|
56.40-55.60-55.00 |
| Intraday Resistance Levels |
| R1 |
|
|
60.90-61.40-62.00 |
| R2 |
|
|
62.60-63.25-64.00 |
| R3 |
|
|
64.60-65.00 |
| TECHNICAL INDICATORS |
| Name |
|
Value |
Action |
| 14DRSI |
|
46.1562 |
Buy |
| 20-DMA |
|
92.99 |
Sell |
| 50-DMA |
|
75.81 |
Sell |
| 100-DMA |
|
62.03 |
Sell |
| 200-DMA |
|
49.29 |
Sell |
| STOCH(5,3) |
|
21.094 |
Buy |
| MACD(12,26,9) |
|
5.262 |
Buy |
|
|
|
|
Oil - WTI
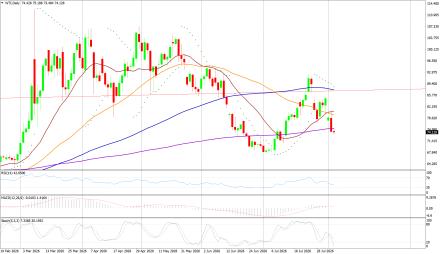
Crude Oil on Tuesday high of US$80.87/bbl, an intraday low of US$74.29/bbl, and settled down by 5.39% to close at US$74.30/bbl.
Technicals in Focus:
On daily charts, oil is sustaining above its 100DMA i.e. 75.37, a support level, and breakage above will call for 77.48. MACD is above the zero line and histograms are in increasing mode will bring a bullish stance in the upcoming sessions. The Stochastic Oscillator is in the overbought region, giving a negative crossover to confirm a bearish stance; while the RSI is in the neutral region, more upsides can be expected to reach the overbought region, which is highly probable.
Trading Strategy: Neutral to Sell
Sell in between 81.00-90.50 with stop loss at 91.00 targeting 81.00-82.15-83.00-84.05 and 84.90-85.50-86.20-87.00.
Buy above 80.05-74.60 with risk daily closing below 74.00, targeting 80.80-80.10-79.30-78.70 and 78.25-77.50-76.00-75.40. |
|
| Intraday Support Levels |
| S1 |
|
|
80.85-80.10-79.30 |
| S2 |
|
|
78.70-78.25-77.50 |
| S3 |
|
|
77.00-76.50 |
| Intraday Resistance Levels |
| R1 |
|
|
81.40-82.15-83.00 |
| R2 |
|
|
84.05-84.90-85.50 |
| R3 |
|
|
86.20-87.00-87.90 |
| TECHNICAL INDICATORS |
| Name |
|
Value |
Action |
| 14DRSI |
|
29.346 |
Sell |
| 20-DMA |
|
67.35 |
Sell |
| 50-DMA |
|
69.06 |
Sell |
| 100-DMA |
|
70.28 |
Sell |
| 200-DMA |
|
71.85 |
Sell |
| STOCH(5,3) |
|
16.166 |
Sell |
| MACD(12,26,9) |
|
-1.306 |
Buy |
|
|
|
|
EUR/USD
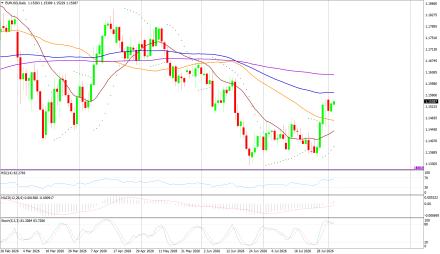
EUR/USD on Tuesday made an intraday low of US$1.1501/EUR, a high of US$1.1533/EUR, and settled up by 0.227% to close at US$1.1531/EUR.
Technicals in Focus:
On daily charts, prices are sustaining above 100DMA (1.1661), which becomes immediate support, a break below will target 1.1695. MACD is above the zero line and histograms are increasing mode, bringing a bullish view. Stochastic is in oversold territory, giving negative crossovers to the bullish outlook for intraday. 14D RSI is currently in a neutral region and giving no directions to consider right now.
Trading Strategy: Neutral to Sell
Sell below 1.1540-1.1650, targeting 1.1485-1.1465-1.1440-1.1405 and 1.1370-1.1355-1.1323-1.1390 with stop-loss at daily closing above 1.1520.
Buy above 1.1495-1.1250 with risk below 1.1250 targeting 1.1530-1.1565-1.1590 and 1.1610-1.1650. |
|
| Intraday Support Levels |
| S1 |
|
|
1.1510-1.1485-1.1465 |
| S2 |
|
|
1.1440-1.1400-1.1370 |
| S3 |
|
|
1.1355-1.1323-1.1390 |
| Intraday Resistance Levels |
| R1 |
|
|
1.1540-1.1568 |
| R2 |
|
|
1.1588-1.1610-1.1630 |
| R3 |
|
|
1.1655-1.1690 |
| TECHNICAL INDICATORS |
| Name |
|
Value |
Action |
| 14DRSI |
|
48.897 |
Buy |
| 20-DMA |
|
1.1695 |
Sell |
| 50-DMA |
|
1.1656 |
Buy |
| 100-DMA |
|
1.1661 |
Buy |
| 200-DMA |
|
1.1585 |
Buy |
| STOCH(5,3) |
|
55.688 |
Buy |
| MACD(12,26,9) |
|
-0.0013 |
|
|
|
|
|
GBP/USD
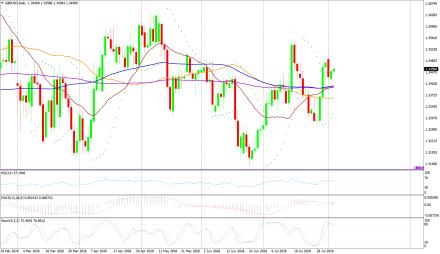
GBP/USD on Tuesday made a intraday low of US$1.3418/GBP, a high of US$1.3455/GBP, and settled the day up by 0.186% to close at US$1.3450/GBP
Technicals in Focus:
On daily charts, prices are sustaining above 50DMA (1.2674) is becoming a support level. 14-D RSI is currently in a neutral region and direction is difficult to predict on an RSI basis. The Stochastic Oscillator is in oversold territory and gives a positive crossover to confirm a bullish stance. MACD is above the zero line, but histograms are increasing leading to movement.
Trading Strategy: Neutral to Buy
Based on the charts and explanations above; buy between 1.3450-1.3079 with a target of 1.3350-1.3410-1.3440-1.3490-1.3520-1.3540-1.3570 and 1.3600-1.3640-1.3690 with a stop loss closing below 1.3150.
Sell in between 1.3490-1.3820 with targets at 1.3300-1.3270-1.3190 and 1.3150-1.3135-1.3120-1.3100 with a stop loss of 1.3900. |
|
| Intraday Support Levels |
| S1 |
|
|
1.3450-1.3410-1.3350-1.3315 |
| S2 |
|
|
1.3290-1.3270-1.3200 |
| S3 |
|
|
1.3160-1.3100-1.3060 |
| Intraday Resistance Levels |
| R1 |
|
|
1.3490-1.3520 |
| R2 |
|
|
1.3540-1.3600 1.3640 |
| R3 |
|
|
1.3660-1.3690 |
| TECHNICAL INDICATORS |
| Name |
|
Value |
Action |
| 14DRSI |
|
46.905 |
Buy |
| 20-DMA |
|
1.2932 |
Buy |
| 50-DMA |
|
1.2736 |
Buy |
| 100-DMA |
|
1.2629 |
Buy |
| 200-DMA |
|
1.2811 |
Buy |
| STOCH(5,3) |
|
9.458 |
Buy |
| MACD(12,26,9) |
|
-0.003 |
Sell |
|
|
|
|
USD/JPY
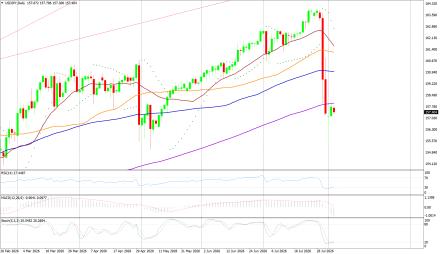
USD/JPY on Tuesday made an intra‐day low of JPY157.12/USD an intraday high of 157.95/USD, and settled the day up by 0.372% at JPY157.73/USD.
Technicals in Focus:
In daily charts, JPY is sustaining above 100DMA (152.35), major support on the daily chart. 14-D RSI is currently in the overbought region and chances of downward are expected based on RSI. MACD is above the zero line but histograms are decreasing mode which might lead to downward movement. The Stochastic Oscillator is in overbought territory and signaling to sell as it has given a negative crossover to confirm a bearish stance.
Trading Strategy: Neutral to Sell
Sell below 157.90-161.90 with risk above 162.00 targeting 157.00-156.50-156.00-155.20 and 154.50-154.00-153.00..
Long positions above 160.40-152.00 with targets of 161.00-161.40-162.40-163.00-163.50 and 164.00-164.60-165.00 with stops below 152.00. |
|
| Intraday Support Levels |
| S1 |
|
|
157.10-156.50-156.00 |
| S2 |
|
|
155.20-154.50 |
| S3 |
|
|
154.00-153.00 |
| INTRADAY RESISTANCE LEVELS |
| R1 |
|
|
157.90-158.40-158.9 |
| R2 |
|
|
159.40-160.00-160.7 |
| R3 |
|
|
161.00-161.40-161.9 |
| TECHNICAL INDICATORS |
| Name |
|
Value |
Action |
| 14DRSI |
|
41.14 |
Buy |
| 20-DMA |
|
148.91 |
Buy |
| 50-DMA |
|
150.24 |
Buy |
| 100-DMA |
|
152.53 |
Buy |
| 200-DMA |
|
151.18 |
Buy |
| STOCH(9,6) |
|
93.662 |
Sell |
| MACD(12,26,9) |
|
0.683 |
Sell |
|
|
|
 |