 |
|
|
Daily Market Lookup
- The U.S. dollar eased on Wednesday, hitting a seven-week low, amid hopes of progress towards a peace deal between Washington and Tehran. Meanwhile, the yen seesawed, but remained well above the four-decade low it had hit before last week’s landmark intervention. U.S. Treasury Secretary Scott Bessent earlier this week confirmed that Washington had stepped in and conducted the first joint buying of yen with Japan since 2011. This was also the first time the U.S. specifically stepped in to strengthen the yen since 1998. Bessent on Tuesday told CNBC that the U.S. had helped because any weakness in the yen could destabilize markets across Asia. Before the latest intervention, the yen had slid to a forty-year trough against the dollar at 164. A sliding yen puts pressure on Japan’s import-heavy economy. To support the yen, authorities generally sell U.S. Treasury bonds - of which Japan is the single largest foreign holder - to raise the cash needed to buy their own currency. On Wednesday, minutes of the BoJ’s latest interest rate meeting showed that policymakers expected Japan’s economic growth to likely decelerate and inflation to increase due to the oil shock from the Middle East conflict. At home, the economic calendar was in focus. U.S. private jobs increased by 44k in July, according to ADP. This was lower than the estimated figure of 68k and a moderation from the 95k jobs added in June. The report echoed a similar trend in U.S. job openings data for June published on Tuesday, and comes ahead of Friday’s July nonfarm payrolls Though the labor market indicators have been soft this week, the overall picture remains resilient, supporting the Federal Reserve’s recent switch to focusing more on its inflation mandate. Volatility in oil prices due to the ongoing conflict in the Middle East has upended inflationary dynamics and caused division among Fed policymakers as to the appropriate path of monetary policy. Separately, an update from the Institute for Supply Management (ISM) showed economic activity in the U.S. services sector ticked up to 54.1 in July from June’s 54 reading and against a forecast of 54.5. The prices index, which measures the rate of change in prices that U.S. services companies pay for materials and inputs, accelerated from June and remained above 70 for a fourth time in five months Looking at the Middle East, several U.S. officials, including President Donald Trump, asserted that a deal to reopen the vital waterway was close. Iran’s foreign ministry said talks between Tehran and Oman over the strait were ongoing. Spokesperson Esmaeil Baqaei said a joint statement was in a final review and drafting stage provided "some third parties" did not "obstruct work," adding that the closing of the vital waterway was due to the "military aggression" of the U.S. Citing persistent global uncertainties and elevated food inflation, the RBI upgraded its 2027 GDP growth forecast to 6.7%, while noting that falling global crude prices were helping contain external pressures.
- Gold prices extended their rally for a fourth straight session on Thursday, climbing to a seven-week high as optimism over a potential agreement to reopen the Strait of Hormuz weighed on oil prices, the U.S. dollar and Treasury yields. Gold found fresh support after reports suggested a diplomatic breakthrough in the Middle East could be nearing, raising expectations that disruptions to global energy supplies may ease and reducing inflation concerns. Reuters reported that a proposed agreement between Iran and Oman to help end the five-month conflict between Tehran and Washington would hand Iran control over vessels entering the Gulf through the Strait of Hormuz. Oil prices slipped on the prospect of the deal. Lower energy prices have prompted investors to dial back expectations for further Federal Reserve tightening. Markets now see roughly a 55% probability of a September rate hike, down from 67% just two days ago. At the same time, benchmark Treasury yields eased and the US Dollar Index remained under pressure, making dollar-priced bullion more attractive to overseas buyers. Despite the recent rally, investors remain focused on upcoming U.S. labor market data for further clues on the Federal Reserve’s policy path. The ADP National Employment Report showed private-sector hiring slowed in July, while attention now shifts to Friday’s closely watched nonfarm payrolls report. ANZ analysts said gold’s rally gathered momentum as hopes of reopening the Strait of Hormuz reduced inflationary pressures and made additional Fed rate hikes appear less likely. They added that prices accelerated after bullion broke above a key technical resistance level, although Fed Governor Lisa Cook cautioned policymakers remain prepared to raise interest rates if inflation fails to slow because they cannot afford to wait until inflation reaches the Fed’s 2% target While you're enjoying summer, the market keeps moving.
- Oil prices edged lower on Thursday, extending sharp losses from earlier this week as investors weighed signs of progress toward restoring shipping through the Strait of Hormuz against lingering geopolitical risks and a surprise build in U.S. crude inventories. Both contracts ended little changed on Wednesday, but remained on track for weekly losses of more than 10%. Market sentiment improved after Iran said it had reached an agreement with Oman on the coordinates of a proposed shipping route through the Strait of Hormuz, a vital waterway that handles roughly a fifth of global oil and LNG trade. However, traders remained cautious as the agreement does not amount to a full reopening of the strait, with negotiations over cargo fees, inspections and broader security arrangements still unresolved. U.S. President Donald Trump said at a rally in Las Vegas on Wednesday that Washington was holding talks with Tehran and that he would "see what happens" in the ongoing negotiations. However, Iran has publicly denied that peace talks with Washington were underway. Still, the prospect of increased tanker movements through Hormuz eased some fears of prolonged supply disruptions that had driven oil prices sharply higher in recent weeks. Analysts said the geopolitical risk premium has not disappeared, given repeated setbacks in negotiations and uncertainty over whether any agreement can be fully implemented. Further limiting gains, U.S. government data showed crude oil inventories unexpectedly rose by about 2.5 million barrels last week, compared with market expectations for a 1.5 million barrels drawdown, suggesting softer near-term demand. Stockpiles at the Cushing, Oklahoma delivery hub also increased, adding pressure to prices. Meanwhile, security concerns elsewhere in the region remained elevated. Houthi attacks on shipping in the Red Sea, continued fighting affecting Russian and Ukrainian maritime trade, and disruptions to Kazakhstan's main export route highlighted that risks to global energy supplies remain despite optimism surrounding Hormuz.
|
|
| Intraday RESISTANCE LEVELS |
| 6th August 2026 |
R1 |
R2 |
R3 |
| GOLD-XAU |
4270-4282-4305 |
4324-4340-4355 |
4370-4382-4395 |
| Silver-XAG |
62.10-62.30 |
62.60-63.25-64.00 |
64.60-65.00 |
| Crude Oil |
74.50-75.40-76.00 |
76.50-77.00-78.25 |
78.70-79.30-80.10- |
| EURO/USD |
1.1540-1.1568 |
1.1588-1.1610-1.1630 |
1.1655-1.1690 |
| GBP/USD |
1.3490-1.3520 |
1.3540-1.3600 1.3640 |
1.3660-1.3690 |
| USD/JPY |
157.90-158.40-158.9 |
159.40-160.00-160.7 |
161.00-161.40-161.9 |
| Intraday SUPPORTS LEVELS |
| 6th August 2026 |
S1 |
S2 |
S3 |
| GOLD-XAU |
4253-4225-4200 |
4188-4160-4144 |
4132-4100-4085 |
| Silver-XAG |
61.40-60.90-60.5 |
59.90-59.00-58.00 |
57.70-57.00-56.40 |
| Crude Oil |
73.90-73.40-72.90 |
72.00-71.40-70.70 |
-70.00 |
| EURO/USD |
1.1510-1.1485-1.1465 |
1.1440-1.1400-1.1370 |
1.1355-1.1323-1.1390 |
| GBP/USD |
1.3450-1.3410-1.3350-1.3315 |
1.3290-1.3270-1.3200 |
1.3160-1.3100-1.3060 |
| USD/JPY |
157.10-156.50-156.00 |
155.20-154.50 |
154.00-153.00 |
|
|
| Intra-Day Strategy (6th August 2026) |
| GOLD-XAU |
Sell on Strength |
| Silver-XAG |
Buy on Dips |
|
| Crude Oil |
Neutral to Sell |
| EUR/USD |
Neutral to Sell |
|
| GBP/USD |
Neutral to Buy |
| USD/JPY |
Neutral to Sell |
|
|
|
|
Gold – XAU
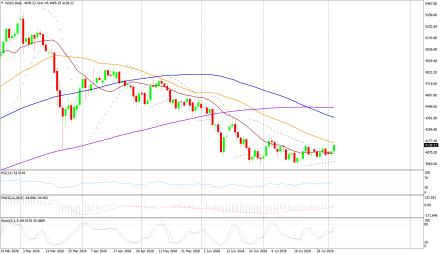
Gold on Wednesday interaday high of US$4106.28/oz and low of $4042.36/oz. God is up by 0.580% at US$4076.83/oz.
Technicals in Focus:
On the daily charts, gold trades higher than 20DMA (2197). If it drops below this level, it could lead to 2,100. The MACD is currently above the zero line and the histograms are showing an increasing trend, indicating that there may be upward movement in the coming sessions. The RSI is currently at 83.04, which is in the overbought region, suggesting there may be selling pressure in the next 2 to 3 sessions. The Stochastic Oscillator is also in the overbought territory but has given a positive crossover, indicating a bullish stance for intraday trades, but rebound in expected in all the overbought indicators.
Trading Strategy: Sell on Strength
Sell below 4270-4400 keeping stop loss closing above 4400, targeting 4253-4225-4200-4188-4160 and 4132-4100-4085-4056. Buy in between 4250-3900 with risk below 3866 targeting 4270-4282-4305-4324-4340 and 4335-4355-4370-4395. |
|
| Intraday Support Levels |
| S1 |
|
|
4253-4225-4200 |
| S2 |
|
|
4188-4160-4144 |
| S3 |
|
|
4132-4100-4085 |
| Intraday Resistance Levels |
| R1 |
|
|
4270-4282-4305 |
| R2 |
|
|
4324-4340-4355 |
| R3 |
|
|
4370-4382-4395 |
| Technical Indicators
|
| Name |
|
Value |
Action |
| 14DRSI |
|
52.916 |
Buy |
| 20-DMA |
|
4800.67 |
Buy |
| 50-DMA |
|
4497.76 |
Buy |
| 100-DMA |
|
4239.36 |
Buy |
| 200-DMA |
|
3800.35 |
Buy |
| STOCH(5,3) |
|
26.933 |
Sell |
| MACD(12,26,9) |
|
150.924 |
Buy |
|
|
|
|
Silver - XAG
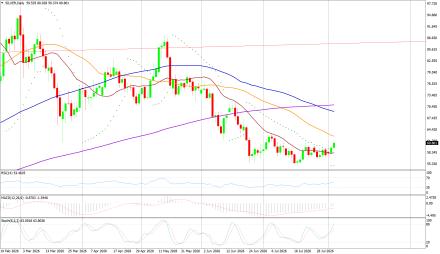
Silver on Wednesday its intraday high of US$62.75/oz and low of US$559.37/oz settle up by 4.19% at US$62.03/oz.
Technicals in Focus:
On daily charts, silver is sustaining above 20MA (25.05), breakage above will lead to 23.73. MACD is below the zero line and histograms are increasing trend, bringing a bullish stance in the upcoming sessions. RSI is in the oversold region, indicating a sell signal for now. The Stochastic Oscillator is in the overbought region and gives a positive crossover to show an upside move for the intraday trade.
Trading Strategy: Buy on Dips
Buy in between 60.50-54.00 targeting 59.00-59.90-60.50-61.00 and 61.48-62.00-63.25-64.00-65.10 with stop loss should be placed on the breakage below 53.00.
Sell in between 60.90-64.45 with a stop loss above 65.00 targeting 57.00- 56.40-55.60-55.00 and 54.60-54.10-53.30. |
|
| Intraday Support Levels |
| S1 |
|
|
61.40-60.90-60.5 |
| S2 |
|
|
59.90-59.00-58.00 |
| S3 |
|
|
57.70-57.00-56.40 |
| Intraday Resistance Levels |
| R1 |
|
|
62.10-62.30 |
| R2 |
|
|
62.60-63.25-64.00 |
| R3 |
|
|
64.60-65.00 |
| TECHNICAL INDICATORS |
| Name |
|
Value |
Action |
| 14DRSI |
|
46.1562 |
Buy |
| 20-DMA |
|
92.99 |
Sell |
| 50-DMA |
|
75.81 |
Sell |
| 100-DMA |
|
62.03 |
Sell |
| 200-DMA |
|
49.29 |
Sell |
| STOCH(5,3) |
|
21.094 |
Buy |
| MACD(12,26,9) |
|
5.262 |
Buy |
|
|
|
|
Oil - WTI
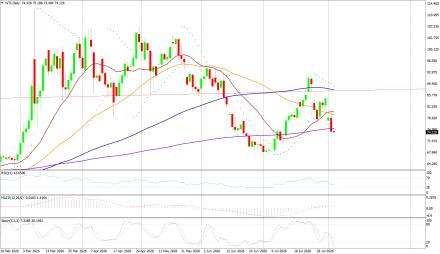
Crude Oil on Wednesday high of US$75.77/bbl, an intraday low of US$73.48/bbl, and settled down by 0.209% to close at US$74.27/bbl.
Technicals in Focus:
On daily charts, oil is sustaining above its 100DMA i.e. 75.37, a support level, and breakage above will call for 77.48. MACD is above the zero line and histograms are in increasing mode will bring a bullish stance in the upcoming sessions. The Stochastic Oscillator is in the overbought region, giving a negative crossover to confirm a bearish stance; while the RSI is in the neutral region, more upsides can be expected to reach the overbought region, which is highly probable.
Trading Strategy: Neutral to Sell
Sell in between 74.50-90.50 with stop loss at 91.00 targeting 73.90-73.40-72.90-72.00 and 71.40-70.70-70.00
Buy above 73.90-70.00 with risk daily closing below 70.00, targeting 74.50-75.40-76.00-76.50 |
|
| Intraday Support Levels |
| S1 |
|
|
73.90-73.40-72.90 |
| S2 |
|
|
72.00-71.40-70.70 |
| S3 |
|
|
-70.00 |
| Intraday Resistance Levels |
| R1 |
|
|
74.50-75.40-76.00 |
| R2 |
|
|
76.50-77.00-78.25 |
| R3 |
|
|
78.70-79.30-80.10- |
| TECHNICAL INDICATORS |
| Name |
|
Value |
Action |
| 14DRSI |
|
29.346 |
Sell |
| 20-DMA |
|
67.35 |
Sell |
| 50-DMA |
|
69.06 |
Sel |
| 100-DMA |
|
70.28 |
Sell |
| 200-DMA |
|
71.85 |
Sell |
| STOCH(5,3) |
|
16.166 |
Sell |
| MACD(12,26,9) |
|
-1.306 |
Buy |
|
|
|
|
EUR/USD
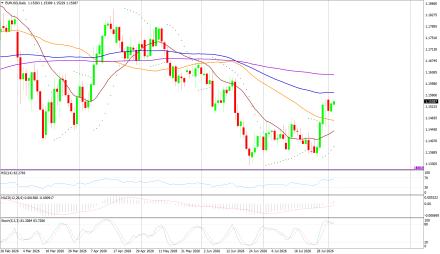
EUR/USD on Wednesday made an intraday low of US$1.1501/EUR, a high of US$1.1533/EUR, and settled up by 0.227% to close at US$1.1531/EUR.
Technicals in Focus:
On daily charts, prices are sustaining above 100DMA (1.1661), which becomes immediate support, a break below will target 1.1695. MACD is above the zero line and histograms are increasing mode, bringing a bullish view. Stochastic is in oversold territory, giving negative crossovers to the bullish outlook for intraday. 14D RSI is currently in a neutral region and giving no directions to consider right now.
Trading Strategy: Neutral to Sell
Sell below 1.1540-1.1650, targeting 1.1485-1.1465-1.1440-1.1405 and 1.1370-1.1355-1.1323-1.1390 with stop-loss at daily closing above 1.1520.
Buy above 1.1495-1.1250 with risk below 1.1250 targeting 1.1530-1.1565-1.1590 and 1.1610-1.1650. |
|
| Intraday Support Levels |
| S1 |
|
|
1.1510-1.1485-1.1465 |
| S2 |
|
|
1.1440-1.1400-1.1370 |
| S3 |
|
|
1.1355-1.1323-1.1390 |
| Intraday Resistance Levels |
| R1 |
|
|
1.1540-1.1568 |
| R2 |
|
|
1.1588-1.1610-1.1630 |
| R3 |
|
|
1.1655-1.1690 |
| TECHNICAL INDICATORS |
| Name |
|
Value |
Action |
| 14DRSI |
|
48.897 |
Buy |
| 20-DMA |
|
1.1695 |
Sell |
| 50-DMA |
|
1.1656 |
Buy |
| 100-DMA |
|
1.1661 |
Buy |
| 200-DMA |
|
1.1585 |
Buy |
| STOCH(5,3) |
|
55.688 |
Buy |
| MACD(12,26,9) |
|
-0.0013 |
|
|
|
|
|
GBP/USD
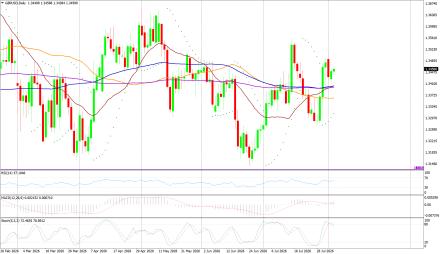
GBP/USD on Wednesday made a intraday low of US$1.3438/GBP, a high of US$1.3485/GBP, and settled the day up by 0.124% to close at US$1.3466/GBP.
Technicals in Focus:
On daily charts, prices are sustaining above 50DMA (1.2674) is becoming a support level. 14-D RSI is currently in a neutral region and direction is difficult to predict on an RSI basis. The Stochastic Oscillator is in oversold territory and gives a positive crossover to confirm a bullish stance. MACD is above the zero line, but histograms are increasing leading to movement.
Trading Strategy: Neutral to Buy
Based on the charts and explanations above; buy between 1.3450-1.3079 with a target of 1.3350-1.3410-1.3440-1.3490-1.3520-1.3540-1.3570 and 1.3600-1.3640-1.3690 with a stop loss closing below 1.3150.
Sell in between 1.3490-1.3820 with targets at 1.3300-1.3270-1.3190 and 1.3150-1.3135-1.3120-1.3100 with a stop loss of 1.3900. |
|
| Intraday Support Levels |
| S1 |
|
|
1.3450-1.3410-1.3350-1.3315 |
| S2 |
|
|
1.3290-1.3270-1.3200 |
| S3 |
|
|
1.3160-1.3100-1.3060 |
| Intraday Resistance Levels |
| R1 |
|
|
1.3490-1.3520 |
| R2 |
|
|
1.3540-1.3600 1.3640 |
| R3 |
|
|
1.3660-1.3690 |
| TECHNICAL INDICATORS |
| Name |
|
Value |
Action |
| 14DRSI |
|
46.905 |
Buy |
| 20-DMA |
|
1.2932 |
Buy |
| 50-DMA |
|
1.2736 |
Buy |
| 100-DMA |
|
1.2629 |
Buy |
| 200-DMA |
|
1.2811 |
Buy |
| STOCH(5,3) |
|
9.458 |
Buy |
| MACD(12,26,9) |
|
-0.003 |
Sell |
|
|
|
|
USD/JPY
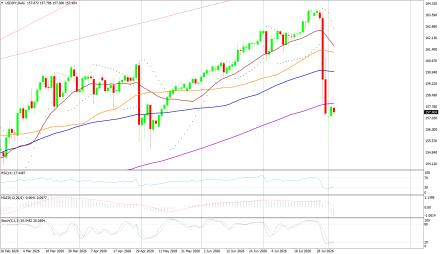
USD/JPY on Wednesday made an intra‐day low of JPY157.30/USD an intraday high of 157.86/USD, and settled the day up by 0.372% at JPY157.74/USD.
Technicals in Focus:
In daily charts, JPY is sustaining above 100DMA (152.35), major support on the daily chart. 14-D RSI is currently in the overbought region and chances of downward are expected based on RSI. MACD is above the zero line but histograms are decreasing mode which might lead to downward movement. The Stochastic Oscillator is in overbought territory and signaling to sell as it has given a negative crossover to confirm a bearish stance.
Trading Strategy: Neutral to Sell
Sell below 157.90-161.90 with risk above 162.00 targeting 157.00-156.50-156.00-155.20 and 154.50-154.00-153.00..
Long positions above 160.40-152.00 with targets of 161.00-161.40-162.40-163.00-163.50 and 164.00-164.60-165.00 with stops below 152.00. |
|
| Intraday Support Levels |
| S1 |
|
|
157.10-156.50-156.00 |
| S2 |
|
|
155.20-154.50 |
| S3 |
|
|
154.00-153.00 |
| INTRADAY RESISTANCE LEVELS |
| R1 |
|
|
157.90-158.40-158.9 |
| R2 |
|
|
159.40-160.00-160.7 |
| R3 |
|
|
161.00-161.40-161.9 |
| TECHNICAL INDICATORS |
| Name |
|
Value |
Action |
| 14DRSI |
|
41.14 |
Buy |
| 20-DMA |
|
148.91 |
Buy |
| 50-DMA |
|
150.24 |
Buy |
| 100-DMA |
|
152.53 |
Buy |
| 200-DMA |
|
151.18 |
Buy |
| STOCH(9,6) |
|
93.662 |
Sell |
| MACD(12,26,9) |
|
0.683 |
Sell |
|
|
|
 |