 |
|
|
Daily Market Lookup
- The greenback rose on Thursday and hit a one-week high, amid a boost to safe haven demand and rising Treasury yields a day ahead of key labor market data. Meanwhile, the yen weakened to 158 a dollar for the first time since last week’s landmark intervention. The dollar had slipped this week, as investors chose to pile into risk assets such as equities, helping Wall Street bounce back from a middling July and kick off August on a stellar note. Sliding oil prices on hopes for an imminent deal to reopen the critical Strait of Hormuz had supported sentiment. But crude made solid gains on Thursday, after a media report said an Iranian and Omani framework to reopen the Strait of Hormuz would prohibit passage of U.S. vessels until compensation was paid. Iran’s Fars News said the initial text of the Hormuz plan was under review by authorities, citing parliament member Alireza Salimi. According to the plan, passage of U.S., Israeli, and other hostile vessels through the vital waterway would be prohibited until compensation was paid, Fars said. The news agency separately reported that according to the plan, entry into the strait would be through the northern corridor near the Iranian coast and exit would be through the southern corridor near the Oman coast, citing an informed source in the foreign ministry. After a specified deadline, transit through both corridors would be stopped and would instead take place through a middle corridor, with Iran managing the entry and jointly managing the exit with Oman. If true, these aspects of the plan would most likely be unacceptable to Washington. President Donald Trump earlier this week said he had called off a powerful planned attack against Iran due to progress towards a deal, while warning that Washington was "ready to go" if an agreement was not reached. Both sides have engaged in a cycle of threats, attacks, and concessions since the onset of their war in late-February. The dollar on Thursday was also supported by jitters over the path of monetary policy, with traders dumping government bonds and driving up U.S. Treasury yields. Friday’s July nonfarm payrolls report will likely provide the next marker for interest rates. Labor market indicators this week have been mixed so far. U.S. job openings growth in June came in lower than expected and moderated from May. Separately, private employment growth in July arrived softer than anticipated and decelerated from June. On the other hand, the number of Americans filing for initial jobless claims remained below 200k for a third straight week, a streak not frequently seen since the late 1960s. The data suggested that the overall labor market remained resilient and supported the Federal Reserve’s recent switch to focusing more on its inflation mandate. Volatility in oil prices due to the ongoing conflict in the Middle East has upended inflationary dynamics and has caused division among Fed policymakers as to the appropriate path of monetary policy. Away from the dollar, the other big story in currency markets has been the Japanese yen. It weakened against the dollar on Thursday, with the USD/JPY pair last up 0.4% to 158.39, topping 158 for the first time since a recent landmark currency intervention. U.S. Treasury Secretary Scott Bessent earlier this week confirmed that Washington had stepped in and conducted the first joint buying of yen with Japan since 2011. This was also the first time the U.S. specifically stepped in to strengthen the yen since 1998. Bessent on Tuesday told CNBC that the U.S. had helped because any weakness in the yen could destabilize markets across Asia.Before the latest intervention, the yen had slid to a forty-year trough against the dollar at 164. A sliding yen puts pressure on Japan’s import-heavy economy. To support the yen, authorities generally sell U.S. Treasury bonds - of which Japan is the single largest foreign holder - to raise the cash needed to buy their own currency.
- Oil extended gains on Friday amid further concerns around the opening of the Strait of Hormuz as Iran, working with Oman, suggested banning vessels deemed hostile from the strait and heavily fining those which violated the proposed rules. Brent crude futures rose 80 cents, or 0.97%, to $83.29 a barrel by 0303 GMT. U.S. West Texas Intermediate futures rose 64 cents, or 0.83%, to $77.93. Oil futures settled up at over $3 a barrel on Thursday as Iran reviewed a bill to ban U.S. and Israeli vessels from the Strait of Hormuz where roughly a fifth of the world’s oil and liquefied natural gas transmitted before the war began at the end of February. Prices fell earlier in the week as a possible solution to the ongoing conflict looked more likely but benchmark Brent breached $80 on Thursday after falling below that for the first time since July 13. Both benchmarks were headed for a weekly loss of about 8%. Analysts said the events that have unfolded this week signalled that the hostilities between Iran and the U.S. are not yet over. An Iranian lawmaker said a parliamentary committee is reviewing a preliminary bill to ban U.S., Israeli and other vessels deemed hostile from the Strait of Hormuz, and fine violators of the proposed restrictions up to 20% of cargo value, according to Fars news agency. Iran is seeking fees of between 5% and 7% of the price of cargoes from ships using the strait, according to the senior Iranian official. Oman is discussing fees of around 3%, while Washington wants no fees at all. Four industry sources have said the proposed deal is not easily workable due to U.S. sanctions and restrictive insurance clauses on any payments. Meanwhile, Yemen’s Houthis said they carried out missile and drone attacks on "Saudi deployments" in Marib and Hadramout in Yemen on Thursday. U.S. President Donald Trump on Thursday told reporters that he believed the war would be over soon.
|
|
| Intraday RESISTANCE LEVELS |
| 7th August 2026 |
R1 |
R2 |
R3 |
| GOLD-XAU |
4270-4282-4305 |
4324-4340-4355 |
4370-4382-4395 |
| Silver-XAG |
62.30 |
62.60-63.25-64.00 |
64.60-65.00 |
| Crude Oil |
77.50-78.25 |
78.70-79.30-80.10 |
80.70-81.60-82.50 |
| EURO/USD |
1.1540-1.1568 |
1.1588-1.1610-1.1630 |
1.1655-1.1690 |
| GBP/USD |
1.3490-1.3520 |
1.3540-1.3600 1.3640 |
1.3660-1.3690 |
| USD/JPY |
158.40-158.9 |
159.40-160.00-160.7 |
161.00-161.40-161.9 |
| Intraday SUPPORTS LEVELS |
| 7th August 2026 |
S1 |
S2 |
S3 |
| GOLD-XAU |
4253-4225-4200 |
4188-4160-4144 |
4132-4100-4085 |
| Silver-XAG |
61.40-60.90-60.5 |
59.90-59.00-58.00 |
57.70-57.00-56.40 |
| Crude Oil |
77.00-76.00-75.40 |
74.50-73.90-73.40-72.90 |
72.00-71.40-70.70 |
| EURO/USD |
1.1510-1.1485-1.1465 |
1.1440-1.1400-1.1370 |
1.1355-1.1323-1.1390 |
| GBP/USD |
1.3450-1.3410-1.3350-1.3315 |
1.3290-1.3270-1.3200 |
1.3160-1.3100-1.3060 |
| USD/JPY |
157.90-157.10-156.50 |
156.00-155.20-154.50 |
154.00-153.00 |
|
|
| Intra-Day Strategy (7th August 2026) |
| GOLD-XAU |
Sell on Strength |
| Silver-XAG |
Buy on Dips |
|
| Crude Oil |
Neutral to Sell |
| EUR/USD |
Neutral to Sell |
|
| GBP/USD |
Neutral to Buy |
| USD/JPY |
Neutral to Sell |
|
|
|
|
Gold – XAU
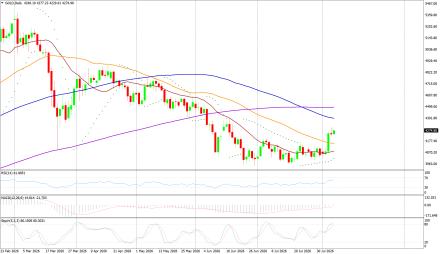
Gold on Thursday interaday high of US$4303.92/oz and low of $4223.28/oz. God is down by 0.193% at US$4239.76/oz.
Technicals in Focus:
On the daily charts, gold trades higher than 20DMA (2197). If it drops below this level, it could lead to 2,100. The MACD is currently above the zero line and the histograms are showing an increasing trend, indicating that there may be upward movement in the coming sessions. The RSI is currently at 83.04, which is in the overbought region, suggesting there may be selling pressure in the next 2 to 3 sessions. The Stochastic Oscillator is also in the overbought territory but has given a positive crossover, indicating a bullish stance for intraday trades, but rebound in expected in all the overbought indicators.
Trading Strategy: Sell on Strength
Sell below 4270-4400 keeping stop loss closing above 4400, targeting 4253-4225-4200-4188-4160 and 4132-4100-4085-4056. Buy in between 4250-3900 with risk below 3866 targeting 4270-4282-4305-4324-4340 and 4335-4355-4370-4395. |
|
| Intraday Support Levels |
| S1 |
|
|
4253-4225-4200 |
| S2 |
|
|
4188-4160-4144 |
| S3 |
|
|
4132-4100-4085 |
| Intraday Resistance Levels |
| R1 |
|
|
4270-4282-4305 |
| R2 |
|
|
4324-4340-4355 |
| R3 |
|
|
4370-4382-4395 |
| Technical Indicators
|
| Name |
|
Value |
Action |
| 14DRSI |
|
52.916 |
Buy |
| 20-DMA |
|
4800.67 |
Buy |
| 50-DMA |
|
4497.76 |
Buy |
| 100-DMA |
|
4239.36 |
Buy |
| 200-DMA |
|
3800.35 |
Buy |
| STOCH(5,3) |
|
26.933 |
Sell |
| MACD(12,26,9) |
|
150.924 |
Buy |
|
|
|
|
Silver - XAG
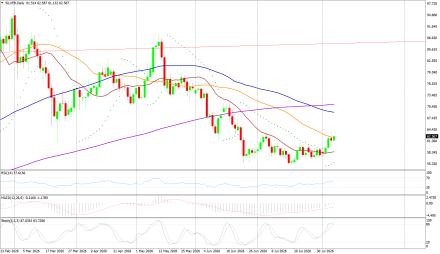
Silver on Thursday its intraday high of US$62.88/oz and low of US$60.85/oz settle up by 0.864% at US$61.48/oz.
Technicals in Focus:
On daily charts, silver is sustaining above 20MA (25.05), breakage above will lead to 23.73. MACD is below the zero line and histograms are increasing trend, bringing a bullish stance in the upcoming sessions. RSI is in the oversold region, indicating a sell signal for now. The Stochastic Oscillator is in the overbought region and gives a positive crossover to show an upside move for the intraday trade.
Trading Strategy: Buy on Dips
Buy in between 61.90-54.00 targeting 62.30-62.60-63.25-64.00-65.10 with stop loss should be placed on the breakage below 53.00.
Sell in between 62.30-64.45 with a stop loss above 65.00 targeting 61.40-60.90-60.50-59.90-59.00-57.00 and 56.40-55.60-55.00-54.10. |
|
| Intraday Support Levels |
| S1 |
|
|
61.40-60.90-60.5 |
| S2 |
|
|
59.90-59.00-58.00 |
| S3 |
|
|
57.70-57.00-56.40 |
| Intraday Resistance Levels |
| R1 |
|
|
62.30 |
| R2 |
|
|
62.60-63.25-64.00 |
| R3 |
|
|
64.60-65.00 |
| TECHNICAL INDICATORS |
| Name |
|
Value |
Action |
| 14DRSI |
|
46.1562 |
Buy |
| 20-DMA |
|
92.99 |
Sell |
| 50-DMA |
|
75.81 |
Sell |
| 100-DMA |
|
62.03 |
Sell |
| 200-DMA |
|
49.29 |
Sell |
| STOCH(5,3) |
|
21.094 |
Buy |
| MACD(12,26,9) |
|
5.262 |
Buy |
|
|
|
|
Oil - WTI
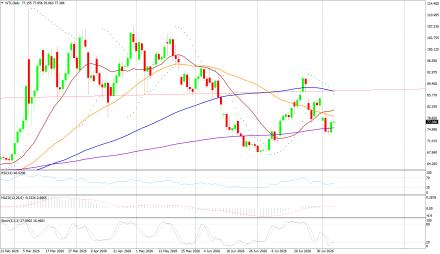
Crude Oil on Thursday high of US$77.64/bbl, an intraday low of US$73.79/bbl, and settled up by 4.98% to close at US$77.33/bbl.
Technicals in Focus:
On daily charts, oil is sustaining above its 100DMA i.e. 75.37, a support level, and breakage above will call for 77.48. MACD is above the zero line and histograms are in increasing mode will bring a bullish stance in the upcoming sessions. The Stochastic Oscillator is in the overbought region, giving a negative crossover to confirm a bearish stance; while the RSI is in the neutral region, more upsides can be expected to reach the overbought region, which is highly probable.
Trading Strategy: Neutral to Sell
Sell in between 77.50-90.50 with stop loss at 91.00 targeting 77.00-76.00-75.40-73.90-73.40 and 72.90-72.00-71.40-70.70-70.00
Buy above 77.00-70.00 with risk daily closing below 70.00, targeting 77.50-78.25-78.70-79.30 and 80.10-80.70-81.60. |
|
| Intraday Support Levels |
| S1 |
|
|
77.00-76.00-75.40 |
| S2 |
|
|
74.50-73.90-73.40-72.90 |
| S3 |
|
|
72.00-71.40-70.70 |
| Intraday Resistance Levels |
| R1 |
|
|
77.50-78.25 |
| R2 |
|
|
78.70-79.30-80.10 |
| R3 |
|
|
80.70-81.60-82.50 |
| TECHNICAL INDICATORS |
| Name |
|
Value |
Action |
| 14DRSI |
|
29.346 |
Sell |
| 20-DMA |
|
67.35 |
Sell |
| 50-DMA |
|
69.06 |
Sell |
| 100-DMA |
|
70.28 |
Sell |
| 200-DMA |
|
71.85 |
Sell |
| STOCH(5,3) |
|
16.166 |
Sell |
| MACD(12,26,9) |
|
-1.306 |
Buy |
|
|
|
|
EUR/USD
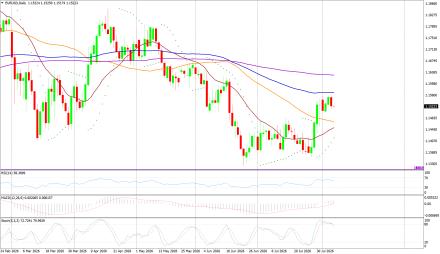
EUR/USD on Thursday made an intraday low of US$1.1514/EUR, a high of US$1.1533/EUR, and settled down by 0.251% to close at US$1.1522/EUR.
Technicals in Focus:
On daily charts, prices are sustaining above 100DMA (1.1661), which becomes immediate support, a break below will target 1.1695. MACD is above the zero line and histograms are increasing mode, bringing a bullish view. Stochastic is in oversold territory, giving negative crossovers to the bullish outlook for intraday. 14D RSI is currently in a neutral region and giving no directions to consider right now.
Trading Strategy: Neutral to Sell
Sell below 1.1540-1.1650, targeting 1.1485-1.1465-1.1440-1.1405 and 1.1370-1.1355-1.1323-1.1390 with stop-loss at daily closing above 1.1520.
Buy above 1.1495-1.1250 with risk below 1.1250 targeting 1.1530-1.1565-1.1590 and 1.1610-1.1650. |
|
| Intraday Support Levels |
| S1 |
|
|
1.1510-1.1485-1.1465 |
| S2 |
|
|
1.1440-1.1400-1.1370 |
| S3 |
|
|
1.1355-1.1323-1.1390 |
| Intraday Resistance Levels |
| R1 |
|
|
1.1540-1.1568 |
| R2 |
|
|
1.1588-1.1610-1.1630 |
| R3 |
|
|
1.1655-1.1690 |
| TECHNICAL INDICATORS |
| Name |
|
Value |
Action |
| 14DRSI |
|
48.897 |
Buy |
| 20-DMA |
|
1.1695 |
Sell |
| 50-DMA |
|
1.1656 |
Buy |
| 100-DMA |
|
1.1661 |
Buy |
| 200-DMA |
|
1.1585 |
Buy |
| STOCH(5,3) |
|
55.688 |
Buy |
| MACD(12,26,9) |
|
-0.0013 |
|
|
|
|
|
GBP/USD
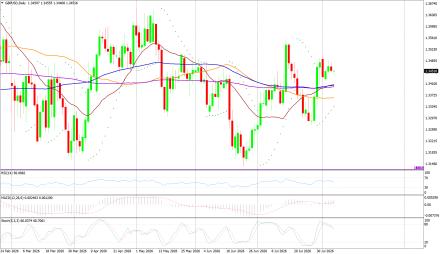
GBP/USD on Thursday made a intraday low of US$1.3447/GBP, a high of US$1.3478/GBP, and settled the day down by 0.100% to close at US$1.3452/GBP.
Technicals in Focus:
On daily charts, prices are sustaining above 50DMA (1.2674) is becoming a support level. 14-D RSI is currently in a neutral region and direction is difficult to predict on an RSI basis. The Stochastic Oscillator is in oversold territory and gives a positive crossover to confirm a bullish stance. MACD is above the zero line, but histograms are increasing leading to movement.
Trading Strategy: Neutral to Buy
Based on the charts and explanations above; buy between 1.3450-1.3079 with a target of 1.3350-1.3410-1.3440-1.3490-1.3520-1.3540-1.3570 and 1.3600-1.3640-1.3690 with a stop loss closing below 1.3150.
Sell in between 1.3490-1.3820 with targets at 1.3300-1.3270-1.3190 and 1.3150-1.3135-1.3120-1.3100 with a stop loss of 1.3900. |
|
| Intraday Support Levels |
| S1 |
|
|
1.3450-1.3410-1.3350-1.3315 |
| S2 |
|
|
1.3290-1.3270-1.3200 |
| S3 |
|
|
1.3160-1.3100-1.3060 |
| Intraday Resistance Levels |
| R1 |
|
|
1.3490-1.3520 |
| R2 |
|
|
1.3540-1.3600 1.3640 |
| R3 |
|
|
1.3660-1.3690 |
| TECHNICAL INDICATORS |
| Name |
|
Value |
Action |
| 14DRSI |
|
46.905 |
Buy |
| 20-DMA |
|
1.2932 |
Buy |
| 50-DMA |
|
1.2736 |
Buy |
| 100-DMA |
|
1.2629 |
Buy |
| 200-DMA |
|
1.2811 |
Buy |
| STOCH(5,3) |
|
9.458 |
Buy |
| MACD(12,26,9) |
|
-0.003 |
Sell |
|
|
|
|
USD/JPY
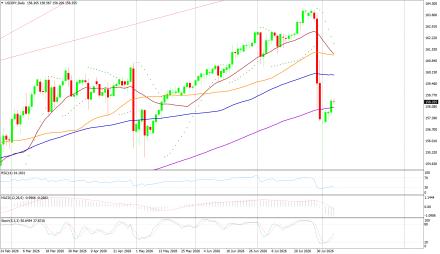
USD/JPY on Thursday made an intra‐day low of JPY157.54/USD an intraday high of 158.54/USD, and settled the day up by 0.451% at JPY158.43/USD.
Technicals in Focus:
In daily charts, JPY is sustaining above 100DMA (152.35), major support on the daily chart. 14-D RSI is currently in the overbought region and chances of downward are expected based on RSI. MACD is above the zero line but histograms are decreasing mode which might lead to downward movement. The Stochastic Oscillator is in overbought territory and signaling to sell as it has given a negative crossover to confirm a bearish stance.
Trading Strategy: Neutral to Sell
Sell below 158.40-161.90 with risk above 162.00 targeting 157.00-156.50-156.00-155.20 and 154.50-154.00-153.00.
Long positions above 157.90-152.00 with targets of 158.40-161.00-161.40-162.40-163.00-163.50 and 164.00-164.60-165.00 with stops below 152.00. |
|
| Intraday Support Levels |
| S1 |
|
|
157.90-157.10-156.50 |
| S2 |
|
|
156.00-155.20-154.50 |
| S3 |
|
|
154.00-153.00 |
| INTRADAY RESISTANCE LEVELS |
| R1 |
|
|
158.40-158.9 |
| R2 |
|
|
159.40-160.00-160.7 |
| R3 |
|
|
161.00-161.40-161.9 |
| TECHNICAL INDICATORS |
| Name |
|
Value |
Action |
| 14DRSI |
|
41.14 |
Buy |
| 20-DMA |
|
148.91 |
Buy |
| 50-DMA |
|
150.24 |
Buy |
| 100-DMA |
|
150.24 |
Buy |
| 200-DMA |
|
151.18 |
Buy |
| STOCH(9,6) |
|
93.662 |
Sell |
| MACD(12,26,9) |
|
0.683 |
Sell |
|
|
|
 |