 |
|
|
Daily Market Lookup
- The U.S. dollar on Monday rebounded from a two-week losing streak, getting a boost from safe haven demand as oil prices marched higher. Currency market participants were also digesting a rapid recalibration of Federal Reserve rate hike expectations after a softer-than-expected July jobs report, and were now eyeing key inflation data later in the week for more cues on interest rates. Meanwhile, the Japanese yen slipped nearly 1% against the dollar, chipping away at gains achieved after a historic joint currency intervention last month. Oil prices rose nearly 5% on Monday after Iran ruled out direct talks with the U.S. and said a full reopening of the Strait of Hormuz would only be possible after Washington met certain conditions. Concerns over regional oil flows were also exacerbated by Iran-backed Houthi attacks on Saudi Arabian energy infrastructure. Traders moved into the safe haven nature of the dollar against this backdrop. Crude benchmarks had slumped last week, largely due to assertions from U.S. officials including President Donald Trump that talks with Iran were ongoing. But the losses were tempered towards the end of the week amid Tehran’s continuous rejection of Washington’s negotiation claims and reports that the Strait of Hormuz’s management framework would prohibit passage of U.S, Israeli, and other hostile vessels through the vital waterway. Iran’s state media said a parliamentary commission had approved the framework with the inclusion of the ban on the vessels. Foreign ministry spokesperson Esmaeil Baqaei on Monday said that Iran and Oman had yet to finalize a joint statement on the management of the strait, adding that the plan would include mechanisms to monitor vessel passage, for which compensation should be received. Iran also ruled out direct talks with the U.S. for now, citing alleged violations of the interim peace agreement reached in June. Tehran reiterated conditions for a full reopening of Hormuz, including an end to the U.S. naval blockade, the removal of sanctions, and compensation for war damage Trump on Monday said Iran was asking for compensation for damages since the start of the U.S.-Israeli joint assault on Tehran towards the end of February. The president said he in turn would also be "demanding compensation from Iran" and that he had instructed his representatives "to put this firmly into any, and all, future negotiations." Turning away from the Middle East, the dollar had fallen 0.4% on Friday after data showed the first monthly decline in U.S. nonfarm payrolls since February, primarily due to a fall in local government education jobs. Additionally, payrolls for May and June were collectively revised lower by a 103k. The jobs report complicated the picture for the Fed. On the one hand, despite the negative print, the overall labor market remains solid. On the other hand, inflationary risks are much higher amid ongoing volatility in oil prices due to the Iran war, with some policymakers showing a clear bias towards raising rates at the Fed’s last monetary policy meeting in July. Traders reacted to the data by paring their expectations for Fed rate hikes in September. Higher rate environments tend to strengthen the dollar. All eyes are now on key inflation indicators this week for further cues on monetary policy outlook. The economic calendar will be highlighted by the July consumer price index (CPI) and producer price index (PPI) readings on Wednesday and Thursday, respectively. Those will be followed by the July retail sales report on Friday. As per Truflation, July headline CPI "will rise to 3.6% year-on-year, as renewed pressure from services, food and utilities offsets easing in some categories. The data suggest June’s softer inflation reading may have been a temporary trough rather than the start of a sustained disinflationary trend, with tariff pass-through creating an additional risk to the inflation outlook," Before the intervention, the yen had slid to a forty-year trough against the dollar at 164. A sliding yen puts pressure on Japan’s import-heavy economy. To support the yen, authorities generally sell U.S. Treasury bonds - of which Japan is the single largest foreign holder - to raise the cash needed to buy their own currency.
- Oil prices steadied on Tuesday at more than one-week highs amid fading hopes of a deal between the U.S. and Iran to end their war and reopen the Strait of Hormuz, after President Donald Trump demanded compensation for damage the U.S. has incurred. Both benchmarks rose more than 5% on Monday to their highest since July 31, after Trump responded to Iran’s conditions for a peace deal with his own demands that Iran pay compensation for people killed in wars, attacks and protests, which is likely to complicate efforts to reopen the Strait of Hormuz. Later in the day he added that the U.S. had control of the strait and had swept the strategic oil waterway for Iranian mines. Meanwhile, Saudi Aramco has postponed the restart of its 400,000-barrel-per-day Jazan refinery to August 30 after the Houthis claimed two attacks on the plant on Sunday. In a note on Monday, analysts at Barclays said that in the week ending August 7, crude oil and refined product net exports through the Strait of Hormuz averaged 3 million barrels per day, down from 4.4 million bpd the previous week Markets will likely remain in a state of morbid detachment if oil continues to slip through both blockades via ship-to-ship transfers and overland routes, said IG’s analyst Tony Sycamore. Meanwhile, the Abu Dhabi National Oil Company (ADNOC) is offering spot crude in a tender, its eighth issued since the start of June as the UAE state oil company works to move oil from inside the Strait of Hormuz.
|
|
| Intraday RESISTANCE LEVELS |
| 11th August 2026 |
R1 |
R2 |
R3 |
| GOLD-XAU |
4434-4460-4489 |
4496-4516-4540 |
4555-4570-4595 |
| Silver-XAG |
66.00-66.50-67.15 |
68.00-68.90-69.50 |
69.90-70.30-71.20 |
| Crude Oil |
81.60-82.50-83.10 |
83.70-84.10- |
86.00-86.75 |
| EURO/USD |
1.1550-1.1568 |
1.1588-1.1610-1.1630 |
1.1655-1.1690 |
| GBP/USD |
1.3530-1.3560 |
1.3590 1.3640 |
1.3660-1.3690 |
| USD/JPY |
159.40-160.00-160.7 |
161.00-161.40-161.9 |
162.50 |
| Intraday SUPPORTS LEVELS |
| 11th August 2026 |
S1 |
S2 |
S3 |
| GOLD-XAU |
4410-4389-4370 |
4355-4340-4324 |
4305-4282-4270 |
| Silver-XAG |
65.50-65.00-64.60 |
64.00-63.25-62.60 |
62.30-61.70-61.00 |
| Crude Oil |
80.70-80.10-79.30 |
78.70-78.25-77.50 |
77.00-76.00-75.40 |
| EURO/USD |
1.1510-1.1485-1.1465 |
1.1440-1.1400-1.1370 |
1.1355-1.1323-1.1390 |
| GBP/USD |
1.3490-1.3450-1.3410 |
1.3350-1.3315-1.3290 |
1.3270-1.3160-1.3100 |
| USD/JPY |
158.90-157.90-157.10 |
156.50-156.00-155.20 |
154.50-154.00-153.00 |
|
|
| Intra-Day Strategy (11th August 2026) |
| GOLD-XAU |
Sell on Strength |
| Silver-XAG |
Buy on Dips |
|
| Crude Oil |
Neutral to Sell |
| EUR/USD |
Neutral to Sell |
|
| GBP/USD |
Neutral to Buy |
| USD/JPY |
Neutral to Sell |
|
|
|
|
Gold – XAU
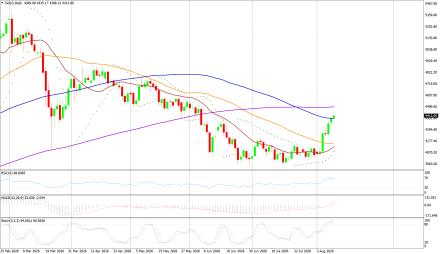
Gold on Monday interaday high of US$4395.11/oz and low of $4313.14/oz. God is up by 0.935% at US$4389.46/oz.
Technicals in Focus:
On the daily charts, gold trades higher than 20DMA (2197). If it drops below this level, it could lead to 2,100. The MACD is currently above the zero line and the histograms are showing an increasing trend, indicating that there may be upward movement in the coming sessions. The RSI is currently at 83.04, which is in the overbought region, suggesting there may be selling pressure in the next 2 to 3 sessions. The Stochastic Oscillator is also in the overbought territory but has given a positive crossover, indicating a bullish stance for intraday trades, but rebound in expected in all the overbought indicators.
Trading Strategy: Sell on Strength
Sell below 4430-4600 keeping stop loss closing above 4600, targeting 4410-4389-4370-4355-4340 and 4324-4305-4282-4270-4253. Buy in between 4410-4250 with risk below 4200 targeting 4434-4460-4489-4496-4516 and 4540-4555-4570-4595. |
|
| Intraday Support Levels |
| S1 |
|
|
4410-4389-4370 |
| S2 |
|
|
4355-4340-4324 |
| S3 |
|
|
4305-4282-4270 |
| Intraday Resistance Levels |
| R1 |
|
|
4434-4460-4489 |
| R2 |
|
|
4496-4516-4540 |
| R3 |
|
|
4555-4570-4595 |
| Technical Indicators
|
| Name |
|
Value |
Action |
| 14DRSI |
|
52.916 |
Buy |
| 20-DMA |
|
4800.67 |
Buy |
| 50-DMA |
|
4497.76 |
Buy |
| 100-DMA |
|
4239.36 |
Buy |
| 200-DMA |
|
3800.35 |
Buy |
| STOCH(5,3) |
|
26.933 |
Sell |
| MACD(12,26,9) |
|
150.924 |
Buy |
|
|
|
|
Silver - XAG
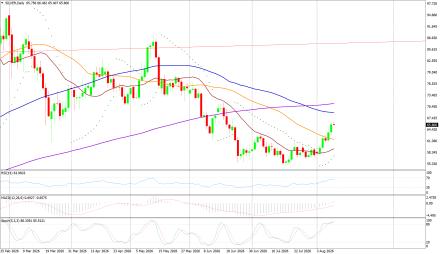
Silver on Monday its intraday high of US$66.05/oz and low of US$62.95/oz settle up by 0.935% at US$65.69/oz.
Technicals in Focus:
On daily charts, silver is sustaining above 20MA (25.05), breakage above will lead to 23.73. MACD is below the zero line and histograms are increasing trend, bringing a bullish stance in the upcoming sessions. RSI is in the oversold region, indicating a sell signal for now. The Stochastic Oscillator is in the overbought region and gives a positive crossover to show an upside move for the intraday trade.
Trading Strategy: Buy on Dips
Buy in between 65.50-61.00 targeting 66.00-66.50-67.15-68.00 and 68.90-69.50-69.90-70.30 with stop loss should be placed on the breakage below 61.00.
Sell in between 66.00-71.45 with a stop loss above 72.00 targeting 65.50-65.00-64.60-64.00-63.25 and 62.60-62.30-61.70-61.40-60.90. |
|
| Intraday Support Levels |
| S1 |
|
|
65.50-65.00-64.60 |
| S2 |
|
|
64.00-63.25-62.60 |
| S3 |
|
|
62.30-61.70-61.00 |
| Intraday Resistance Levels |
| R1 |
|
|
66.00-66.50-67.15 |
| R2 |
|
|
68.00-68.90-69.50 |
| R3 |
|
|
69.90-70.30-71.20 |
| TECHNICAL INDICATORS |
| Name |
|
Value |
Action |
| 14DRSI |
|
46.1562 |
Buy |
| 20-DMA |
|
92.99 |
Sell |
| 50-DMA |
|
75.81 |
Sell |
| 100-DMA |
|
62.03 |
Sell |
| 200-DMA |
|
49.29 |
Sell |
| STOCH(5,3) |
|
21.094 |
Buy |
| MACD(12,26,9) |
|
5.262 |
Buy |
|
|
|
|
Oil - WTI
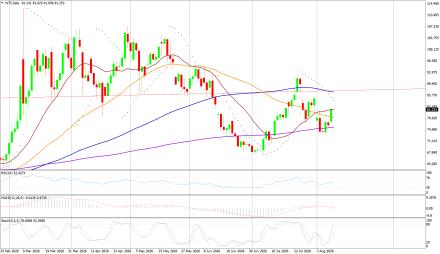
Crude Oil on Friday high of US$77.86/bbl, an intraday low of US$75.67/bbl, and settled up by 1.067% to close at US$76.33/bbl.
Technicals in Focus:
On daily charts, oil is sustaining above its 100DMA i.e. 75.37, a support level, and breakage above will call for 77.48. MACD is above the zero line and histograms are in increasing mode will bring a bullish stance in the upcoming sessions. The Stochastic Oscillator is in the overbought region, giving a negative crossover to confirm a bearish stance; while the RSI is in the neutral region, more upsides can be expected to reach the overbought region, which is highly probable.
Trading Strategy: Neutral to Sell
Sell in between 77.50-90.50 with stop loss at 91.00 targeting 77.00-76.00-75.40-73.90-73.40 and 72.90-72.00-71.40-70.70-70.00
Buy above 77.00-70.00 with risk daily closing below 70.00, targeting 77.50-78.25-78.70-79.30 and 80.10-80.70-81.60. |
|
| Intraday Support Levels |
| S1 |
|
|
80.70-80.10-79.30 |
| S2 |
|
|
78.70-78.25-77.50 |
| S3 |
|
|
77.00-76.00-75.40 |
| Intraday Resistance Levels |
| R1 |
|
|
81.60-82.50-83.10 |
| R2 |
|
|
83.70-84.10- |
| R3 |
|
|
86.00-86.75 |
| TECHNICAL INDICATORS |
| Name |
|
Value |
Action |
| 14DRSI |
|
29.346 |
Sell |
| 20-DMA |
|
67.35 |
Sell |
| 50-DMA |
|
69.06 |
Sell |
| 100-DMA |
|
70.28 |
Sell |
| 200-DMA |
|
71.85 |
Sell |
| STOCH(5,3) |
|
16.166 |
Sell |
| MACD(12,26,9) |
|
-1.306 |
Buy |
|
|
|
|
EUR/USD
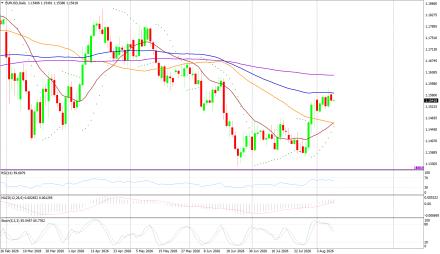
EUR/USD on Monday made an intraday low of US$1.1539/EUR, a high of US$1.1565/EUR, and settled down by 0.170% to close at US$1.1541/EUR.
Technicals in Focus:
On daily charts, prices are sustaining above 100DMA (1.1661), which becomes immediate support, a break below will target 1.1695. MACD is above the zero line and histograms are increasing mode, bringing a bullish view. Stochastic is in oversold territory, giving negative crossovers to the bullish outlook for intraday. 14D RSI is currently in a neutral region and giving no directions to consider right now.
Trading Strategy: Neutral to Sell
Sell below 1.1540-1.1650, targeting 1.1485-1.1465-1.1440-1.1405 and 1.1370-1.1355-1.1323-1.1390 with stop-loss at daily closing above 1.1520.
Buy above 1.1495-1.1250 with risk below 1.1250 targeting 1.1530-1.1565-1.1590 and 1.1610-1.1650. |
|
| Intraday Support Levels |
| S1 |
|
|
1.1510-1.1485-1.1465 |
| S2 |
|
|
1.1440-1.1400-1.1370 |
| S3 |
|
|
1.1355-1.1323-1.1390 |
| Intraday Resistance Levels |
| R1 |
|
|
1.1550-1.1568 |
| R2 |
|
|
1.1588-1.1610-1.1630 |
| R3 |
|
|
1.1655-1.1690 |
| TECHNICAL INDICATORS |
| Name |
|
Value |
Action |
| 14DRSI |
|
48.897 |
Buy |
| 20-DMA |
|
1.1695 |
Sell |
| 50-DMA |
|
1.1656 |
Buy |
| 100-DMA |
|
1.1661 |
Buy |
| 200-DMA |
|
1.1585 |
Buy |
| STOCH(5,3) |
|
55.688 |
Buy |
| MACD(12,26,9) |
|
-0.0013 |
|
|
|
|
|
GBP/USD
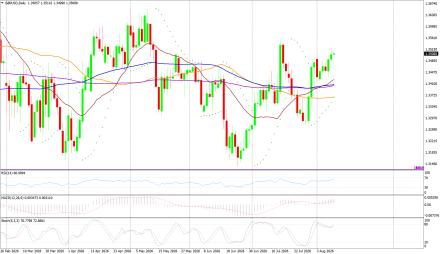
GBP/USD on Monday made a intraday low of US$1.3481/GBP, a high of US$1.3529/GBP, and settled the day up by 0.120% to close at US$1.3505/GBP.
Technicals in Focus:
On daily charts, prices are sustaining above 50DMA (1.2674) is becoming a support level. 14-D RSI is currently in a neutral region and direction is difficult to predict on an RSI basis. The Stochastic Oscillator is in oversold territory and gives a positive crossover to confirm a bullish stance. MACD is above the zero line, but histograms are increasing leading to movement.
Trading Strategy: Neutral to Buy
Based on the charts and explanations above; buy between 1.3490-1.3079 with a target of 1.3410-1.3350-1.3410-1.3440-1.3490-1.3520-1.3540-1.3570 and 1.3600-1.3640-1.3690 with a stop loss closing below 1.3150.
Sell in between 1.3530-1.3820 with targets at 1.3300-1.3270-1.3190 and 1.3150-1.3135-1.3120-1.3100 with a stop loss of 1.3900. |
|
| Intraday Support Levels |
| S1 |
|
|
1.3490-1.3450-1.3410 |
| S2 |
|
|
1.3350-1.3315-1.3290 |
| S3 |
|
|
1.3270-1.3160-1.3100 |
| Intraday Resistance Levels |
| R1 |
|
|
1.3530-1.3560 |
| R2 |
|
|
1.3590 1.3640 |
| R3 |
|
|
1.3660-1.3690 |
| TECHNICAL INDICATORS |
| Name |
|
Value |
Action |
| 14DRSI |
|
46.905 |
Buy |
| 20-DMA |
|
1.2932 |
Buy |
| 50-DMA |
|
1.2736 |
Buy |
| 100-DMA |
|
1.2629 |
Buy |
| 200-DMA |
|
1.2811 |
Buy |
| STOCH(5,3) |
|
9.458 |
Buy |
| MACD(12,26,9) |
|
-0.003 |
Sell |
|
|
|
|
USD/JPY
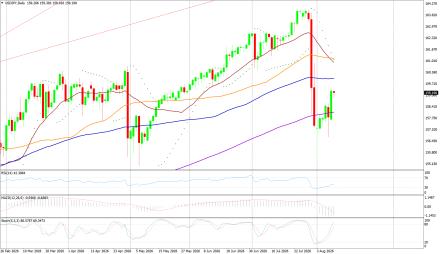
USD/JPY on Monday made an intra‐day low of JPY157.57/USD an intraday high of 159.35/USD, and settled the day up by 1.035% at JPY159.29/USD.
Technicals in Focus:
In daily charts, JPY is sustaining above 100DMA (152.35), major support on the daily chart. 14-D RSI is currently in the overbought region and chances of downward are expected based on RSI. MACD is above the zero line but histograms are decreasing mode which might lead to downward movement. The Stochastic Oscillator is in overbought territory and signaling to sell as it has given a negative crossover to confirm a bearish stance.
Trading Strategy: Neutral to Sell
Sell below 159.40-161.90 with risk above 162.00 targeting 157.00-156.50-156.00-155.20 and 154.50-154.00-153.00.
Long positions above 157.90-152.00 with targets of 158.40-161.00-161.40-162.40-163.00-163.50 and 164.00-164.60-165.00 with stops below 152.00.
|
|
| Intraday Support Levels |
| S1 |
|
|
158.90-157.90-157.10 |
| S2 |
|
|
156.50-156.00-155.20 |
| S3 |
|
|
154.50-154.00-153.00 |
| INTRADAY RESISTANCE LEVELS |
| R1 |
|
|
159.40-160.00-160.7 |
| R2 |
|
|
161.00-161.40-161.9 |
| R3 |
|
|
162.50 |
| TECHNICAL INDICATORS |
| Name |
|
Value |
Action |
| 14DRSI |
|
41.14 |
Buy |
| 20-DMA |
|
148.91 |
Buy |
| 50-DMA |
|
150.24 |
Buy |
| 100-DMA |
|
152.53 |
Buy |
| 200-DMA |
|
151.18 |
Buy |
| STOCH(9,6) |
|
93.662 |
Sell |
| MACD(12,26,9) |
|
0.683 |
Sell |
|
|
|
 |