 |
|
|
Daily Market Lookup
- The U.S. dollar was flat on Tuesday, as currency market participants refrained from any big moves a day ahead of key inflation data that could shape monetary policy outlook. Oil prices ticked up after an Iranian official said the Strait of Hormuz would remain shut until the U.S. met Tehran’s demands All eyes are on the U.S. consumer price index (CPI) and producer price index (PPI) reports for July, scheduled for Wednesday and Thursday. The data will come after an unexpectedly weak jobs report on Friday caused a major recalibration of Federal Reserve rate hike expectations. Economists expect the headline and core CPI to increase on a M/M basis from a negative and flat reading, respectively, in June. On a Y/Y basis, both measures are expected to moderate slightly from June. Turning to the Middle East, oil prices rose nearly 2% on Tuesday following a 5% surge in the previous session. Traders have been on the lookout for some sort of agreement on reopening the Strait of Hormuz since last week following repeated assertions from U.S. officials, including President Donald Trump, that talks were ongoing - claims that Iran has rejected, instead saying it was only dealing with Oman and not involved in any direct negotiations with Washington. Both sides have made conflicting claims over the status of the vital waterway, with the former insisting that it was open for commercial shipping and the latter warning that it was effectively shut. The mixed messaging and lack of a breakthrough on a peace deal have lifted oil prices in the last few sessions. Iran has been in discussions with Oman to create a framework for the management of the strait, with Qatar’s foreign ministry spokesperson saying negotiations between the two countries were in an advanced stage and at a critical crossroads. Meanwhile, Bloomberg News reported that the U.S. and Iran were nearing "some sort of an arrangement" on a potential peace deal, citing Pakistan’s defense minister Khawaja Muhammad Asif. Oman and Pakistan have served as the chief mediators between the warring sides in the current conflict Iran has demanded that the Hormuz reopening is contingent on the U.S. meeting the conditions outlined in an interim peace deal reached in June that subsequently collapsed, including the lifting of an American naval blockade, the removal of sanctions, and compensation for war damage. President Donald Trump on Monday shot back with compensation demands of his own Traffic through the strait has slowed to a trickle, according to Kpler. Data from the shipping tracker showed confirmed vessels crossings fell from 15 on Friday to 11 on Saturday and just six on Sunday. Turning to other major currencies, the Japanese yen weakened slightly against the dollar on Tuesday, giving up some more of the gains achieved after last month’s landmark intervention. The USD/JPY pair was last up 0.1% to 159.31, inching closer to the key 160 level.
- Gold prices rose on Wednesday, holding near the $4,400-an-ounce level as uncertainty over a U.S.-Iran deal to reopen the Strait of Hormuz pushed oil prices higher, while investors waited for U.S. inflation data that could reshape expectations for Federal Reserve policy. Gold remained supported near a two-month high as investors reassessed the chances of a deal to reopen the Strait of Hormuz. Pakistan's defense minister said Washington and Tehran were close to an arrangement, while reports of advanced Oman-Iran discussions suggested diplomacy was still moving forward. Iran, however, has insisted the waterway will remain closed until the U.S. meets its demands, including lifting the blockade on Iranian ports and providing compensation for damage caused by U.S. military strikes. The mixed signals have kept energy markets volatile. The U.S. and Yemen's Iran-aligned Houthis reported separate attacks on shipping in the Strait of Hormuz and Bab el-Mandeb, while a U.S. Navy helicopter fired missiles at a Panama-flagged cargo vessel attempting to transit the Gulf of Oman. For gold, the inflation implications remain central. Higher energy prices could encourage the Federal Reserve to keep rates elevated for longer, increasing the opportunity cost of holding non-yielding bullion. Investors now await Wednesday's U.S. consumer price index, followed by producer prices on Thursday. A softer reading could reduce pressure on the Fed to tighten, while a hotter number could revive rate-hike expectations. Markets have been holding back from aggressive positioning ahead of the CPI release, with swaps putting the odds of a quarter-point September hike around 50-50. Meanwhile, the People's Bank of China increased its gold reserves for a 21st consecutive month in July, adding about 640,000 troy ounces to reach 76.08 million ounces. Gold-backed Chinese ETFs have also continued to attract buyers, reinforcing the stronger institutional demand seen in recent weeks. He said bullion needs a sustained break above both levels to open the way for a stronger recovery toward $5,000.
- Oil prices rose on Wednesday morning as doubts about a U.S.-Iran peace deal and attacks on two ships fuelled concerns about Middle East supply disruptions, even as industry data showed U.S. crude inventories expanded. Both benchmark contracts settled more than $1 higher on Tuesday, marking their highest closes since July 31 and extending gains after jumping about 5% on Monday as hopes for a peace deal between the U.S. and Iran began to fade. The United States and Yemen’s Iran-aligned Houthis reported separate attacks on shipping in the Strait of Hormuz and the Bab el-Mandeb Strait on Tuesday. Iran’s top security official, Mohsen Rezaei, said on Tuesday that the vital Strait of Hormuz shipping route would remain closed unless the U.S. accepted Iran’s conditions for ending the war, including the release of frozen Iranian assets and an end to other conflicts across the region. Shipping data showed that traffic through the Strait of Hormuz dropped to six vessels on Monday, compared with a 10-day average of about 11. Before the war, daily traffic through the waterway averaged 125 to 140 vessels. On the supply front, a Reuters poll showed on Tuesday that U.S. crude oil and fuel inventories were expected to have fallen last week. However, market sources citing American Petroleum Institute data said U.S. crude inventories rose sharply in the week ended August 7, while gasoline and distillate stocks fell. Crude stocks rose by about 9.1 million barrels, while gasoline and distillate inventories fell by 1.5 million barrels and 596,000 barrels, respectively, from the previous week, the sources said. The crude build far exceeded expectations and, if confirmed by the EIA report later on Wednesday, could ease market concerns about supply tightness, Haitong Futures said in a note. Official numbers from the EIA, the statistical arm of the U.S. Department of Energy, are due at 10:30 a.m. ET (1430 GMT) on Wednesday. As for longer-term supply, the EIA expected disruptions of about 600,000 barrels per day to Middle East crude oil supplies to persist through the end of 2027.
|
|
| Intraday RESISTANCE LEVELS |
| 12th August 2026 |
R1 |
R2 |
R3 |
| GOLD-XAU |
4410-4434-4460-4489 |
4496-4516-4540 |
4555-4570-4595 |
| Silver-XAG |
66.00-66.50-67.15 |
68.00-68.90-69.50 |
69.90-70.30-71.20 |
| Crude Oil |
82.70-83.10 |
83.70-84.10- |
86.00-86.75 |
| EURO/USD |
1.1550-1.1568 |
1.1588-1.1610-1.1630 |
1.1655-1.1690 |
| GBP/USD |
1.3530-1.3560 |
1.3590 1.3640 |
1.3660-1.3690 |
| USD/JPY |
159.40-160.00-160.7 |
161.00-161.40-161.9 |
162.50 |
| Intraday SUPPORTS LEVELS |
| 12th August 2026 |
S1 |
S2 |
S3 |
| GOLD-XAU |
4389-4370 |
4355-4340-4324 |
4305-4282-4270 |
| Silver-XAG |
65.50-65.00-64.60 |
64.00-63.25-62.60 |
62.30-61.70-61.00 |
| Crude Oil |
81.60-80.70-80.10-79.30 |
78.70-78.25-77.50 |
77.00-76.00-75.40 |
| EURO/USD |
1.1510-1.1485-1.1465 |
1.1440-1.1400-1.1370 |
1.1355-1.1323-1.1390 |
| GBP/USD |
1.3490-1.3450-1.3410 |
1.3350-1.3315-1.3290 |
1.3270-1.3160-1.3100 |
| USD/JPY |
158.90-157.90-157.10 |
156.50-156.00-155.20 |
154.50-154.00-153.00 |
|
|
| Intra-Day Strategy (12th August 2026) |
| GOLD-XAU |
Sell on Strength |
| Silver-XAG |
Buy on Dips |
|
| Crude Oil |
Neutral to Sell |
| EUR/USD |
Neutral to Sell |
|
| GBP/USD |
Neutral to Buy |
| USD/JPY |
Neutral to Sell |
|
|
|
|
Gold – XAU
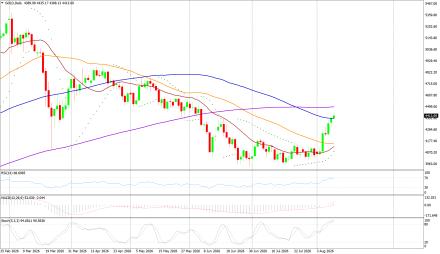
Gold on Tuesday interaday high of US$4435.17/oz and low of $4356.63/oz. God is down by 0.4911% at US$4368.42/oz.
Technicals in Focus:
On the daily charts, gold trades higher than 20DMA (2197). If it drops below this level, it could lead to 2,100. The MACD is currently above the zero line and the histograms are showing an increasing trend, indicating that there may be upward movement in the coming sessions. The RSI is currently at 83.04, which is in the overbought region, suggesting there may be selling pressure in the next 2 to 3 sessions. The Stochastic Oscillator is also in the overbought territory but has given a positive crossover, indicating a bullish stance for intraday trades, but rebound in expected in all the overbought indicators.
Trading Strategy: Sell on Strength
Sell below 4430-4600 keeping stop loss closing above 4600, targeting 4389-4370-4355-4340 and 4324-4305-4282-4270-4253. Buy in between 4389-4250 with risk below 4200 targeting 4434-4460-4489-4496-4516 and 4540-4555-4570-4595. |
|
| Intraday Support Levels |
| S1 |
|
|
4389-4370 |
| S2 |
|
|
4355-4340-4324 |
| S3 |
|
|
4305-4282-4270 |
| Intraday Resistance Levels |
| R1 |
|
|
4410-4434-4460-4489 |
| R2 |
|
|
4496-4516-4540 |
| R3 |
|
|
4555-4570-4595 |
| Technical Indicators
|
| Name |
|
Value |
Action |
| 14DRSI |
|
52.916 |
Buy |
| 20-DMA |
|
4800.67 |
Buy |
| 50-DMA |
|
4497.76 |
Buy |
| 100-DMA |
|
4239.36 |
Buy |
| 200-DMA |
|
3800.35 |
Buy |
| STOCH(5,3) |
|
26.933 |
Sell |
| MACD(12,26,9) |
|
150.924 |
Buy |
|
|
|
|
Silver - XAG
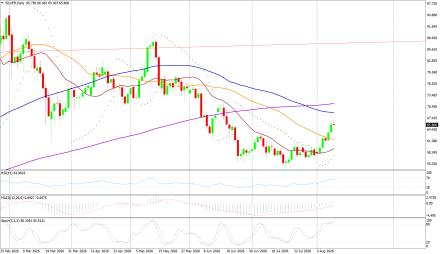
Silver on Tuesday its intraday high of US$66.46/oz and low of US$64.21/oz settle up by 0.935% at US$65.69/oz.
Technicals in Focus:
On daily charts, silver is sustaining above 20MA (25.05), breakage above will lead to 23.73. MACD is below the zero line and histograms are increasing trend, bringing a bullish stance in the upcoming sessions. RSI is in the oversold region, indicating a sell signal for now. The Stochastic Oscillator is in the overbought region and gives a positive crossover to show an upside move for the intraday trade.
Trading Strategy: Buy on Dips
Buy in between 65.50-61.00 targeting 66.00-66.50-67.15-68.00 and 68.90-69.50-69.90-70.30 with stop loss should be placed on the breakage below 61.00.
Sell in between 66.00-71.45 with a stop loss above 72.00 targeting 65.50-65.00-64.60-64.00-63.25 and 62.60-62.30-61.70-61.40-60.90. |
|
| Intraday Support Levels |
| S1 |
|
|
65.50-65.00-64.60 |
| S2 |
|
|
64.00-63.25-62.60 |
| S3 |
|
|
62.30-61.70-61.00 |
| Intraday Resistance Levels |
| R1 |
|
|
66.00-66.50-67.15 |
| R2 |
|
|
68.00-68.90-69.50 |
| R3 |
|
|
69.90-70.30-71.20 |
| TECHNICAL INDICATORS |
| Name |
|
Value |
Action |
| 14DRSI |
|
46.1562 |
Buy |
| 20-DMA |
|
92.99 |
Sell |
| 50-DMA |
|
75.81 |
Sell |
| 100-DMA |
|
62.03 |
Sell |
| 200-DMA |
|
49.29 |
Sell |
| STOCH(5,3) |
|
21.094 |
Buy |
| MACD(12,26,9) |
|
5.262 |
Buy |
|
|
|
|
Oil - WTI
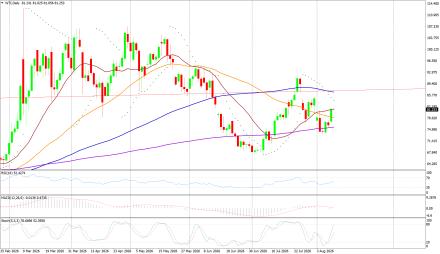
Crude Oil on Friday high of US$83.54/bbl, an intraday low of US$80.34/bbl, and settled up by 1.163% to close at US$82.18/bbl.
Technicals in Focus:
On daily charts, oil is sustaining above its 100DMA i.e. 75.37, a support level, and breakage above will call for 77.48. MACD is above the zero line and histograms are in increasing mode will bring a bullish stance in the upcoming sessions. The Stochastic Oscillator is in the overbought region, giving a negative crossover to confirm a bearish stance; while the RSI is in the neutral region, more upsides can be expected to reach the overbought region, which is highly probable.
Trading Strategy: Neutral to Sell
Sell in between 77.50-90.50 with stop loss at 91.00 targeting 77.00-76.00-75.40-73.90-73.40 and 72.90-72.00-71.40-70.70-70.00
Buy above 77.00-70.00 with risk daily closing below 70.00, targeting 77.50-78.25-78.70-79.30 and 80.10-80.70-81.60. |
|
| Intraday Support Levels |
| S1 |
|
|
81.60-80.70-80.10-79.30 |
| S2 |
|
|
78.70-78.25-77.50 |
| S3 |
|
|
77.00-76.00-75.40 |
| Intraday Resistance Levels |
| R1 |
|
|
82.70-83.10 |
| R2 |
|
|
83.70-84.10- |
| R3 |
|
|
86.00-86.75 |
| TECHNICAL INDICATORS |
| Name |
|
Value |
Action |
| 14DRSI |
|
29.346 |
Sell |
| 20-DMA |
|
67.35 |
Sell |
| 50-DMA |
|
69.06 |
Sell |
| 100-DMA |
|
70.28 |
Sell |
| 200-DMA |
|
71.85 |
Sell |
| STOCH(5,3) |
|
16.166 |
Sell |
| MACD(12,26,9) |
|
-1.306 |
Buy |
|
|
|
|
EUR/USD
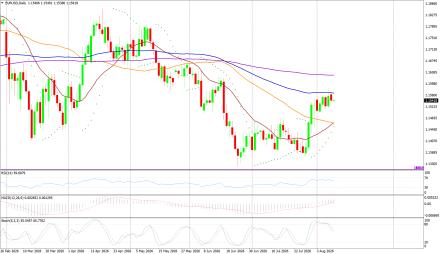
EUR/USD on Tuesday made an intraday low of US$1.1530/EUR, a high of US$1.1549/EUR, and settled up by 0.007% to close at US$1.1541/EUR.
Technicals in Focus:
On daily charts, prices are sustaining above 100DMA (1.1661), which becomes immediate support, a break below will target 1.1695. MACD is above the zero line and histograms are increasing mode, bringing a bullish view. Stochastic is in oversold territory, giving negative crossovers to the bullish outlook for intraday. 14D RSI is currently in a neutral region and giving no directions to consider right now.
Trading Strategy: Neutral to Sell
Sell below 1.1540-1.1650, targeting 1.1485-1.1465-1.1440-1.1405 and 1.1370-1.1355-1.1323-1.1390 with stop-loss at daily closing above 1.1520.
Buy above 1.1495-1.1250 with risk below 1.1250 targeting 1.1530-1.1565-1.1590 and 1.1610-1.1650. |
|
| Intraday Support Levels |
| S1 |
|
|
1.1510-1.1485-1.1465 |
| S2 |
|
|
1.1440-1.1400-1.1370 |
| S3 |
|
|
1.1355-1.1323-1.1390 |
| Intraday Resistance Levels |
| R1 |
|
|
1.1550-1.1568 |
| R2 |
|
|
1.1588-1.1610-1.1630 |
| R3 |
|
|
1.1655-1.1690 |
| TECHNICAL INDICATORS |
| Name |
|
Value |
Action |
| 14DRSI |
|
48.897 |
Buy |
| 20-DMA |
|
1.1695 |
Sell |
| 50-DMA |
|
1.1656 |
Buy |
| 100-DMA |
|
1.1661 |
Buy |
| 200-DMA |
|
1.1585 |
Buy |
| STOCH(5,3) |
|
55.688 |
Buy |
| MACD(12,26,9) |
|
-0.0013 |
|
|
|
|
|
GBP/USD
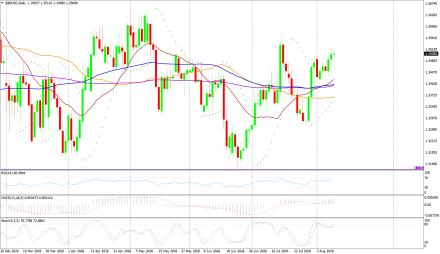
GBP/USD on Tuesday made a intraday low of US$1.3491/GBP, a high of US$1.3515/GBP, and settled the day up by 0.0051% to close at US$1.3506/GBP.
Technicals in Focus:
On daily charts, prices are sustaining above 50DMA (1.2674) is becoming a support level. 14-D RSI is currently in a neutral region and direction is difficult to predict on an RSI basis. The Stochastic Oscillator is in oversold territory and gives a positive crossover to confirm a bullish stance. MACD is above the zero line, but histograms are increasing leading to movement.
Trading Strategy: Neutral to Buy
Based on the charts and explanations above; buy between 1.3490-1.3079 with a target of 1.3410-1.3350-1.3410-1.3440-1.3490-1.3520-1.3540-1.3570 and 1.3600-1.3640-1.3690 with a stop loss closing below 1.3150.
Sell in between 1.3530-1.3820 with targets at 1.3300-1.3270-1.3190 and 1.3150-1.3135-1.3120-1.3100 with a stop loss of 1.3900. |
|
| Intraday Support Levels |
| S1 |
|
|
1.3490-1.3450-1.3410 |
| S2 |
|
|
1.3350-1.3315-1.3290 |
| S3 |
|
|
1.3270-1.3160-1.3100 |
| Intraday Resistance Levels |
| R1 |
|
|
1.3530-1.3560 |
| R2 |
|
|
1.3590 1.3640 |
| R3 |
|
|
1.3660-1.3690 |
| TECHNICAL INDICATORS |
| Name |
|
Value |
Action |
| 14DRSI |
|
46.905 |
Buy |
| 20-DMA |
|
1.2932 |
Buy |
| 50-DMA |
|
1.2736 |
Buy |
| 100-DMA |
|
1.2629 |
Buy |
| 200-DMA |
|
1.2811 |
Buy |
| STOCH(5,3) |
|
9.458 |
Buy |
| MACD(12,26,9) |
|
-0.003 |
Sell |
|
|
|
|
USD/JPY
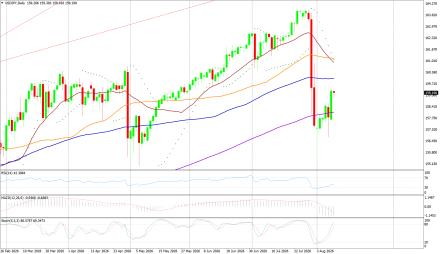
USD/JPY on Tuesday made an intra‐day low of JPY158.91/USD an intraday high of 159.38/USD, and settled the day up by 0.0169% at JPY159.29/USD.
Technicals in Focus:
In daily charts, JPY is sustaining above 100DMA (152.35), major support on the daily chart. 14-D RSI is currently in the overbought region and chances of downward are expected based on RSI. MACD is above the zero line but histograms are decreasing mode which might lead to downward movement. The Stochastic Oscillator is in overbought territory and signaling to sell as it has given a negative crossover to confirm a bearish stance.
Trading Strategy: Neutral to Sell
Sell below 159.40-161.90 with risk above 162.00 targeting 157.00-156.50-156.00-155.20 and 154.50-154.00-153.00.
Long positions above 157.90-152.00 with targets of 158.40-161.00-161.40-162.40-163.00-163.50 and 164.00-164.60-165.00 with stops below 152.00. |
|
| Intraday Support Levels |
| S1 |
|
|
158.90-157.90-157.10 |
| S2 |
|
|
156.50-156.00-155.20 |
| S3 |
|
|
154.50-154.00-153.00 |
| INTRADAY RESISTANCE LEVELS |
| R1 |
|
|
159.40-160.00-160.7 |
| R2 |
|
|
161.00-161.40-161.9 |
| R3 |
|
|
162.50 |
| TECHNICAL INDICATORS |
| Name |
|
Value |
Action |
| 14DRSI |
|
41.14 |
Buy |
| 20-DMA |
|
148.91 |
Buy |
| 50-DMA |
|
150.24 |
Buy |
| 100-DMA |
|
152.53 |
Buy |
| 200-DMA |
|
151.18 |
Buy |
| STOCH(9,6) |
|
93.662 |
Sell |
| MACD(12,26,9) |
|
0.683 |
Sell |
|
|
|
 |