 |
|
|
Daily Market Lookup
- The U.S. dollar on Wednesday bounced back from a session low to tick higher, as ongoing uncertainty over a Middle East peace deal offset an in-line July consumer inflation report that reduced odds of Federal Reserve rate hike expectations. The dollar had strengthened in recent sessions as investors raised expectations for tighter monetary policy, but the latest inflation data failed to deliver the upside surprise needed to extend that move. On Wednesday, currency market participants were squarely focused on the July consumer price index (CPI) report for further cues on monetary policy outlook. The data came after a weaker-than-expected July jobs report on Friday led to a rapid recalibration in Fed rate hike odds for September. As per the U.S. Bureau of Labor Statistics, headline CPI ticked up 0.1% M/M in July, after falling 0.4% in June, while cooling on a Y/Y basis to 3.4% from 3.5%. Core CPI, which strips out food and energy, increased 0.2% M/M, after a flat reading in June, while also decelerating on a Y/Y basis to 2.5% from 2.6%. All four measures matched expectations CPI will be followed by July producer price index (PPI) figures on Thursday. While both indicators are widely followed, the Fed prefers to track the personal consumption expenditures (PCE) price index to gauge inflation. Components from CPI and PPI feed into the PCE. For the Federal Open Market Committee (FOMC), the in-line readings likely give it more breathing room to hold interest rates steady instead of hiking, especially after the weak jobs report on Friday. Interest rate odds reflected such a move, with the CME FedWatch tool showing chances of the FOMC holding steady in September ticking up to 62% after the CPI report from 54%. Higher rate environments tend to strengthen the dollar The market and the Fed won’t stop worrying about inflation, and there are another set of reports before the next Fed meeting, but these two reports (Jobs and CPI) are going to go a long way toward keeping the bulls running in the near term," he added Turning away from the economic calendar and to the Middle East, oil prices fluctuated on Wednesday amid more mixed messaging on the Strait of Hormuz. Brent crude futures, the global benchmark, briefly touched $90 a barrel. There appeared to be little progress towards a peace deal to reopen the critical strait, with both the U.S. and Iran continuing to claim control over the vital waterway. Earlier, Iran’s state media on Tuesday said the country had reiterated its demands that the U.S. cease hostilities across all fronts and release frozen assets before the strait could be reopened, citing comments made by security council chief Mohsen Rezaei to the Chinese ambassador to Tehran. While Kpler data showed a modest rise in confirmed vessel crossings through the strait on Tuesday, the overall mood remained one of caution, compounded by fresh attacks. Houthi rebels reported an attack on commercial shipping in the Bab el-Mandeb Strait that killed four cargo-ship crew members and two Yemeni rescuers, while the U.S. disabled a Panama-flagged vessel near the Gulf of Oman. Looking at other major currencies, the Japanese yen weakened against the dollar, continuing to eat into the gains made after a historic joint intervention by Washington and Tokyo at the end of last month. The USD/JPY pair was last up 0.1% to 159.46. Earlier, the latest Reuters Tankan survey showed business confidence improved in Japan in August on the back of robust semiconductor demand and strong domestic consumption. The survey is designed to be a preview of the Bank of Japan’s quarterly business survey.
- Gold prices were little changed on Thursday after climbing to a fresh two-month high in the previous session, as a softer-than-expected reading beneath the U.S. headline inflation data reduced near-term pressure on the Federal Reserve to raise interest rates. Gold advanced as much as 0.9% on Wednesday to around $4,450, reaching its highest level in more than two months, before paring gains. The metal had also gained about 1% after U.S. consumer prices rose only 0.1% in July from a month earlier, matching expectations and suggesting that the energy shock linked to the Iran conflict had not yet generated a stronger inflation impulse. The Federal Reserve held rates at 3.50%-3.75% at its July meeting, although three policymakers dissented in favor of an increase. Investors now turn to Thursday's U.S. producer price report for another inflation reading before the next Fed meeting. Further employment and inflation data will also arrive ahead of the September decision, while investors are expected to watch Fed Chair Kevin Warsh's comments at the Jackson Hole symposium later this month for clues on how policymakers view the balance between inflation and economic growth. Higher interest rates remain a headwind for gold because bullion does not generate interest income. The softer CPI reading has not eliminated the inflation threat. Further flare-ups in the Middle East could push oil prices higher again and revive pressure on the Federal Reserve to tighten policy.
- Efforts to end the U.S.-Iran conflict and reopen the Strait of Hormuz remain intermittent, while the strategic waterway continues to face severe restrictions. Oil is heading for a weekly gain as traders monitor the latest attempts by Washington and Tehran to resolve the conflict. The US Dollar Index was essentially flat around 99.96, offering little fresh direction to bullion. Lower Treasury yields and a softer dollar had helped gold's earlier rally, but those moves have since moderated. Gold has also benefited from renewed demand after holding above the psychologically important $4,000 level. Chinese buying has been an important part of that support, with the People's Bank of China extending its gold-buying streak and investor appetite for bullion recovering after the earlier selloff.
- The metal also moved above its 100-day moving average this week for the first time since April, adding to the improving technical picture. Tony Sycamore, senior market analyst at IG, said gold's overnight retreat from about $4,441 came as traders took profits ahead of the CPI report while hawkish Fed commentary and higher energy prices also encouraged some selling He said the rebound has now brought gold toward downtrend resistance around $4,450, drawn from the late-January record near $5,602, with the 200-day moving average near $4,499 providing an additional barrier.
|
|
| Intraday RESISTANCE LEVELS |
| 13th August 2026 |
R1 |
R2 |
R3 |
| GOLD-XAU |
4410-4434-4460-4489 |
4496-4516-4540 |
4555-4570-4595 |
| Silver-XAG |
66.00-66.50-67.15 |
68.00-68.90-69.50 |
69.90-70.30-71.20 |
| Crude Oil |
81.60-82.70-83.10 |
83.70-84.10-85.00 |
86.00-86.75 |
| EURO/USD |
1.1550-1.1568 |
1.1588-1.1610-1.1630 |
1.1655-1.1690 |
| GBP/USD |
1.3500-1.3530-1.3560 |
1.3590 1.3640 |
1.3660-1.3690 |
| USD/JPY |
159.50-160.00-160.7 |
161.00-161.40-161.9 |
162.50 |
| Intraday SUPPORTS LEVELS |
| 13th August 2026 |
S1 |
S2 |
S3 |
| GOLD-XAU |
4389-4370 |
4355-4340-4324 |
4305-4282-4270 |
| Silver-XAG |
65.40-64.60 |
64.00-63.25-62.60 |
62.30-61.70-61.00 |
| Crude Oil |
81.20-80.70-80.10-79.30 |
78.70-78.25-77.50 |
77.00-76.00-75.40 |
| EURO/USD |
1.1510-1.1485-1.1465 |
1.1440-1.1400-1.1370 |
1.1355-1.1323-1.1390 |
| GBP/USD |
1.3480-1.3450-1.3410 |
1.3350-1.3315-1.3290 |
1.3270-1.3160-1.3100 |
| USD/JPY |
158.90-157.90-157.10 |
156.50-156.00-155.20 |
154.50-154.00-153.00 |
|
|
| Intra-Day Strategy (13th August 2026) |
| GOLD-XAU |
Sell on Strength |
| Silver-XAG |
Buy on Dips |
|
| Crude Oil |
Neutral to Sell |
| EUR/USD |
Neutral to Sell |
|
| GBP/USD |
Neutral to Buy |
| USD/JPY |
Neutral to Sell |
|
|
|
|
Gold – XAU
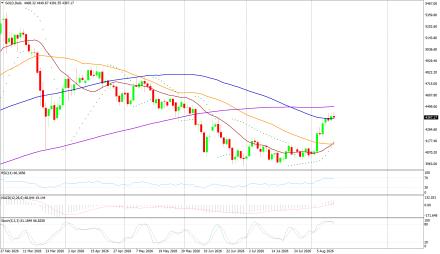
Gold on Wednesday interaday high of US$4441.21/oz and low of $4356.63/oz. God is up by 0.837% at US$4108.47/oz.
Technicals in Focus:
On the daily charts, gold trades higher than 20DMA (2197). If it drops below this level, it could lead to 2,100. The MACD is currently above the zero line and the histograms are showing an increasing trend, indicating that there may be upward movement in the coming sessions. The RSI is currently at 83.04, which is in the overbought region, suggesting there may be selling pressure in the next 2 to 3 sessions. The Stochastic Oscillator is also in the overbought territory but has given a positive crossover, indicating a bullish stance for intraday trades, but rebound in expected in all the overbought indicators.
Trading Strategy: Sell on Strength
Sell below 4430-4600 keeping stop loss closing above 4600, targeting 4389-4370-4355-4340 and 4324-4305-4282-4270-4253. Buy in between 4389-4250 with risk below 4200 targeting 4434-4460-4489-4496-4516 and 4540-4555-4570-4595. |
|
| Intraday Support Levels |
| S1 |
|
|
4389-4370 |
| S2 |
|
|
4355-4340-4324 |
| S3 |
|
|
4305-4282-4270 |
| Intraday Resistance Levels |
| R1 |
|
|
4410-4434-4460-4489 |
| R2 |
|
|
4496-4516-4540 |
| R3 |
|
|
4555-4570-4595 |
| Technical Indicators
|
| Name |
|
Value |
Action |
| 14DRSI |
|
52.916 |
Buy |
| 20-DMA |
|
4800.67 |
Buy |
| 50-DMA |
|
4497.76 |
Buy |
| 100-DMA |
|
4239.36 |
Buy |
| 200-DMA |
|
3800.35 |
Buy |
| STOCH(5,3) |
|
26.933 |
Sell |
| MACD(12,26,9) |
|
150.924 |
Buy |
|
|
|
|
Silver - XAG
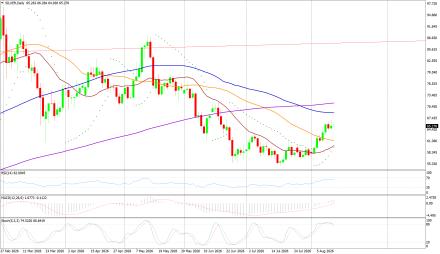
Silver on Wednesday its intraday high of US$66.78/oz and low of US$64.65/oz settle up by 0.935% at US$65.31/oz.
Technicals in Focus:
On daily charts, silver is sustaining above 20MA (25.05), breakage above will lead to 23.73. MACD is below the zero line and histograms are increasing trend, bringing a bullish stance in the upcoming sessions. RSI is in the oversold region, indicating a sell signal for now. The Stochastic Oscillator is in the overbought region and gives a positive crossover to show an upside move for the intraday trade.
Trading Strategy: Buy on Dips
Buy in between 65.50-61.00 targeting 66.00-66.50-67.15-68.00 and 68.90-69.50-69.90-70.30 with stop loss should be placed on the breakage below 61.00.
Sell in between 66.00-71.45 with a stop loss above 72.00 targeting 65.50-65.00-64.60-64.00-63.25 and 62.60-62.30-61.70-61.40-60.90. |
|
| Intraday Support Levels |
| S1 |
|
|
65.40-64.60 |
| S2 |
|
|
64.00-63.25-62.60 |
| S3 |
|
|
62.30-61.70-61.00 |
| Intraday Resistance Levels |
| R1 |
|
|
66.00-66.50-67.15 |
| R2 |
|
|
68.00-68.90-69.50 |
| R3 |
|
|
69.90-70.30-71.20 |
| TECHNICAL INDICATORS |
| Name |
|
Value |
Action |
| 14DRSI |
|
46.1562 |
Buy |
| 20-DMA |
|
92.99 |
Sell |
| 50-DMA |
|
75.81 |
Sell |
| 100-DMA |
|
62.03 |
Sell |
| 200-DMA |
|
49.29 |
Sell |
| STOCH(5,3) |
|
21.094 |
Buy |
| MACD(12,26,9) |
|
5.262 |
Buy |
|
|
|
|
Oil - WTI
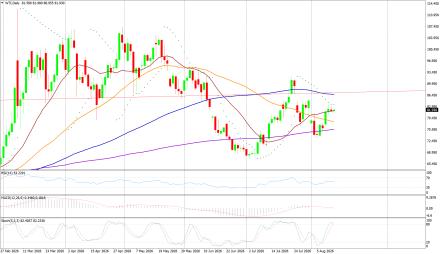
Crude Oil on Wednesday high of US$83.08/bbl, an intraday low of US$81.25/bbl, and settled down by 0.307% to close at US$81.64/bbl.
Technicals in Focus:
On daily charts, oil is sustaining above its 100DMA i.e. 75.37, a support level, and breakage above will call for 77.48. MACD is above the zero line and histograms are in increasing mode will bring a bullish stance in the upcoming sessions. The Stochastic Oscillator is in the overbought region, giving a negative crossover to confirm a bearish stance; while the RSI is in the neutral region, more upsides can be expected to reach the overbought region, which is highly probable.
Trading Strategy: Neutral to Sell
Sell in between 81.60-90.50 with stop loss at 91.00 targeting 81.20-80.70-80.10-79.30 and 78.70-78.25-77.50-77.00-76.00-75.40.
Buy above 81.20-75.00 with risk daily closing below 75.00, targeting 81.60-82.70-83.10-83.70 and 84.10-85.00-86.00-86.75. |
|
| Intraday Support Levels |
| S1 |
|
|
81.20-80.70-80.10-79.30 |
| S2 |
|
|
78.70-78.25-77.50 |
| S3 |
|
|
77.00-76.00-75.40 |
| Intraday Resistance Levels |
| R1 |
|
|
81.60-82.70-83.10 |
| R2 |
|
|
83.70-84.10-85.00 |
| R3 |
|
|
86.00-86.75 |
| TECHNICAL INDICATORS |
| Name |
|
Value |
Action |
| 14DRSI |
|
29.346 |
Sell |
| 20-DMA |
|
67.35 |
Sell |
| 50-DMA |
|
69.06 |
Sell |
| 100-DMA |
|
70.28 |
Sell |
| 200-DMA |
|
71.85 |
Sell |
| STOCH(5,3) |
|
16.166 |
Sell |
| MACD(12,26,9) |
|
-1.306 |
Buy |
|
|
|
|
EUR/USD
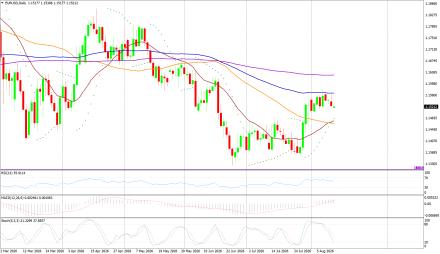
EUR/USD on Wednesday made an intraday low of US$1.1519/EUR, a high of US$1.1519/EUR, and settled down by 0.123% to close at US$1.1524/EUR.
Technicals in Focus:
On daily charts, prices are sustaining above 100DMA (1.1661), which becomes immediate support, a break below will target 1.1695. MACD is above the zero line and histograms are increasing mode, bringing a bullish view. Stochastic is in oversold territory, giving negative crossovers to the bullish outlook for intraday. 14D RSI is currently in a neutral region and giving no directions to consider right now.
Trading Strategy: Neutral to Sell
Sell below 1.1540-1.1650, targeting 1.1485-1.1465-1.1440-1.1405 and 1.1370-1.1355-1.1323-1.1390 with stop-loss at daily closing above 1.1520.
Buy above 1.1495-1.1250 with risk below 1.1250 targeting 1.1530-1.1565-1.1590 and 1.1610-1.1650. |
|
| Intraday Support Levels |
| S1 |
|
|
1.1510-1.1485-1.1465 |
| S2 |
|
|
1.1440-1.1400-1.1370 |
| S3 |
|
|
1.1355-1.1323-1.1390 |
| Intraday Resistance Levels |
| R1 |
|
|
1.1550-1.1568 |
| R2 |
|
|
1.1588-1.1610-1.1630 |
| R3 |
|
|
1.1655-1.1690 |
| TECHNICAL INDICATORS |
| Name |
|
Value |
Action |
| 14DRSI |
|
48.897 |
Buy |
| 20-DMA |
|
1.1695 |
Sell |
| 50-DMA |
|
1.1656 |
Buy |
| 100-DMA |
|
1.1661 |
Buy |
| 200-DMA |
|
1.1585 |
Buy |
| STOCH(5,3) |
|
55.688 |
Buy |
| MACD(12,26,9) |
|
-0.0013 |
|
|
|
|
|
GBP/USD
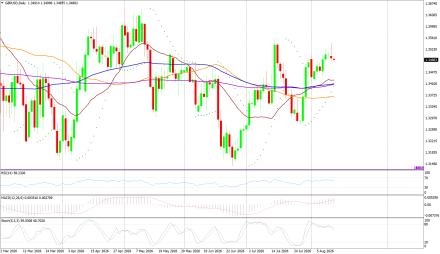
GBP/USD on Wednesday made a intraday low of US$1.3/GBP, a high of US$1.3515/GBP, and settled the day down by 0.054% to close at US$1.3506/GBP.
Technicals in Focus:
On daily charts, prices are sustaining above 50DMA (1.2674) is becoming a support level. 14-D RSI is currently in a neutral region and direction is difficult to predict on an RSI basis. The Stochastic Oscillator is in oversold territory and gives a positive crossover to confirm a bullish stance. MACD is above the zero line, but histograms are increasing leading to movement.
Trading Strategy: Neutral to Buy
Based on the charts and explanations above; buy between 1.3490-1.3079 with a target of 1.3410-1.3350-1.3410-1.3440-1.3490-1.3520-1.3540-1.3570 and 1.3600-1.3640-1.3690 with a stop loss closing below 1.3150.
Sell in between 1.3530-1.3820 with targets at 1.3300-1.3270-1.3190 and 1.3150-1.3135-1.3120-1.3100 with a stop loss of 1.3900. |
|
| Intraday Support Levels |
| S1 |
|
|
1.3480-1.3450-1.3410 |
| S2 |
|
|
1.3350-1.3315-1.3290 |
| S3 |
|
|
1.3270-1.3160-1.3100 |
| Intraday Resistance Levels |
| R1 |
|
|
1.3500-1.3530-1.3560 |
| R2 |
|
|
1.3590 1.3640 |
| R3 |
|
|
1.3660-1.3690 |
| TECHNICAL INDICATORS |
| Name |
|
Value |
Action |
| 14DRSI |
|
46.905 |
Buy |
| 20-DMA |
|
1.2932 |
Buy |
| 50-DMA |
|
1.2736 |
Buy |
| 100-DMA |
|
1.2629 |
Buy |
| 200-DMA |
|
1.2811 |
Buy |
| STOCH(5,3) |
|
9.458 |
Buy |
| MACD(12,26,9) |
|
-0.003 |
Sell |
|
|
|
|
USD/JPY
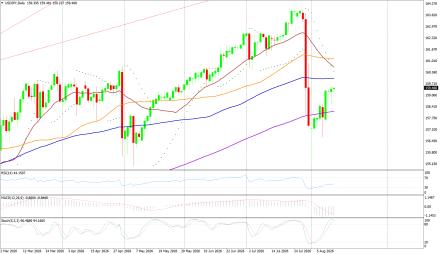
USD/JPY on Thursday made an intra‐day low of JPY158.57/USD an intraday high of 159.53/USD, and settled the day up by 0.100% at JPY159.39/USD.
Technicals in Focus:
In daily charts, JPY is sustaining above 100DMA (152.35), major support on the daily chart. 14-D RSI is currently in the overbought region and chances of downward are expected based on RSI. MACD is above the zero line but histograms are decreasing mode which might lead to downward movement. The Stochastic Oscillator is in overbought territory and signaling to sell as it has given a negative crossover to confirm a bearish stance.
Trading Strategy: Neutral to Sell
Sell below 159.50-161.90 with risk above 162.00 targeting 157.00-156.50-156.00-155.20 and 154.50-154.00-153.00.
Long positions above 158.90-152.00 with targets of 158.40-161.00-161.40-162.40-163.00-163.50 and 164.00-164.60-165.00 with stops below 152.00. |
|
| Intraday Support Levels |
| S1 |
|
|
158.90-157.90-157.10 |
| S2 |
|
|
156.50-156.00-155.20 |
| S3 |
|
|
154.50-154.00-153.00 |
| INTRADAY RESISTANCE LEVELS |
| R1 |
|
|
159.50-160.00-160.7 |
| R2 |
|
|
161.00-161.40-161.9 |
| R3 |
|
|
162.50 |
| TECHNICAL INDICATORS |
| Name |
|
Value |
Action |
| 14DRSI |
|
41.14 |
Buy |
| 20-DMA |
|
148.91 |
Buy |
| 50-DMA |
|
150.24 |
Buy |
| 100-DMA |
|
152.53 |
Buy |
| 200-DMA |
|
151.18 |
Buy |
| STOCH(9,6) |
|
93.662 |
Sell |
| MACD(12,26,9) |
|
0.683 |
Sell |
|
|
|
 |