 |
|
|
Daily Market Lookup
- The U.S. dollar slipped on Thursday, as Federal Reserve rate hike expectations took another hit from softer-than-expected producer inflation data. A day after an in-line July consumer inflation report, investors were focused on producer price readings for the same period. According to the Bureau of Labor Statistics, the headline July producer price index (PPI) was flat on a M/M basis, while ticking up 4.7% Y/Y. In June, headline PPI had slipped 0.1% M/M and climbed 5.5% Y/Y. The July readings were softer than economists’ expectations. Meanwhile, July core PPI added 0.2% M/M and 4.2% Y/Y, against estimates of 0.3% and 4.2%, respectively. In June, core PPI had risen 0.4% M/M and 4.7% Y/Y. With both reports in hand, headline and core CPI and PPI have now moderated on a Y/Y basis. Both indicators are widely followed, but the Fed prefers to track the core personal consumption expenditures (PCE) price index to gauge inflation. Components from CPI and PPI feed into the PCE. Currency market participants reacted to the data by reducing their expectations for Fed rate hikes. As per the CME FedWatch tool, the odds of a September rate hike slipped to about 34% after PPI, while the odds of the Fed holding rates steady rose to nearly 66%. Rate-sensitive assets also reacted accordingly, with U.S. Treasury yields falling as bonds were snapped up. The benchmark longer-end 10-year yield was last down 6.1 basis points to 4.631%, while the shorter-end 2-year yield slipped 5.4 basis points to 4.145%. Technology stocks got a lift, with the S&P 500 tech sector last up 1.1%. Separately, initial claims for state unemployment benefits rose 9k to a seasonally adjusted 209k for the week ended August 8, the Labor Department said on Thursday. Economists had expected 202k claims. Elsewhere, the sterling shed 0.1% to $1.3485, despite government data earlier showing United Kingdom’s gross domestic product (GDP) returning to growth in June. As per the Office for National Statistics, GDP ticked up 0.4% in June, compared to a flat reading in May and a fall of 0.1% in April.
- Gold prices edged lower on Friday after retreating from a 10-week high, as investors weighed a less aggressive Federal Reserve outlook against uncertainty over efforts to reopen the Strait of Hormuz. The metal remained on track for a second straight weekly gain, however, after a softer U.S. inflation backdrop reduced pressure on the Fed to raise interest rates. Gold has pulled back after reaching a 10-week high earlier in the week, but remains on course for a second weekly advance. Thursday's 1.3% decline came as traders reassessed the rally following subdued U.S. inflation data, which suggested that the inflationary impact of the energy shock linked to the Iran war had eased in July. Money markets now price roughly a one-in-three probability of a September rate hike, while investors will get additional employment data before the Fed's next meeting and will closely watch Chair Kevin Warsh's remarks at the central bank's Jackson Hole symposium later this month. ANZ said the latest U.S. producer-price data reinforce that view. Headline PPI was unchanged in July, while core PPI rose 0.2% from the previous month, with both readings below consensus. The softer PPI followed this week's CPI report, which also showed relatively contained price pressures. Together, the readings support the case for the Fed to leave rates unchanged in September, although upcoming inflation and employment data will continue to determine whether that view holds. For gold, the prospect of no immediate rate hike remains supportive because bullion does not generate interest income. However, ANZ noted that profit-taking has emerged after the recent rebound, particularly after the metal moved through its 100-day moving average, an important technical barrier. The inflation outlook remains closely tied to developments in the Middle East. Investors continue to monitor efforts by Washington and Tehran to end the conflict and reopen the Strait of Hormuz, with the outcome carrying significant implications for energy prices. Any renewed flare-up could push oil prices higher and revive inflation concerns, potentially strengthening the case for tighter monetary policy. Conversely, a sustained reopening of the waterway would ease supply pressures and remove some of the inflation risk that has complicated the Fed outlook since the U.S.-Iran war began in late February. Gold's recovery above the psychologically important $4,000-an-ounce level in recent weeks has also benefited from renewed investor demand and stronger central-bank purchases, particularly from China. The metal moved above its 100-day moving average for the first time since April earlier this week, although it has since fallen back below that level. The metal also moved above its 100-day moving average this week for the first time since April, adding to the improving technical picture. Tony Sycamore, senior market analyst at IG, said gold's overnight retreat from about $4,441 came as traders took profits ahead of the CPI report while hawkish Fed commentary and higher energy prices also encouraged some selling He said the rebound has now brought gold toward downtrend resistance around $4,450, drawn from the late-January record near $5,602, with the 200-day moving average near $4,499 providing an additional barrier.
- Oil prices inched up on Friday after the United States threatened an indefinite naval blockade of Iran, reviving concerns about supply of crude after the previous session’s fall on a weaker outlook for demand and a large build in U.S. stocks. On Thursday, the United States warned that it could maintain a naval blockade of Iran indefinitely and ramp up economic pressure on Tehran as ceasefire talks have stalled. The latest U.S. threats come as Iran curbs traffic through the Strait of Hormuz, which carried 20% of the world’s oil before the conflict, driving up fuel prices and putting pressure on President Donald Trump to end a war that is unpopular at home The strait is "under the management and control of the Islamic Republic", however, the recently appointed head of Iran’s Basj paramilitary unit, Hossein Taeb, has said, according to the semi-official Fars news. The prospect of a longer war constraining supply was offset this week by forecasts from OPEC and the International Energy Agency lowering outlooks for demand growth, while data showed the largest weekly gain in U.S. crude stocks for more than 3-1/2-years. KCM chief market analyst Tim Waterer said the two forces were acting as counterweights. Two vessels from the state-owned Abu Dhabi National Oil Company were attacked transiting the Strait of Hormuz on Thursday, said UAE state news agency WAM, an incident the United Arab Emirates government condemned as an Iranian attack.
|
|
| Intraday RESISTANCE LEVELS |
| 14th August 2026 |
R1 |
R2 |
R3 |
| GOLD-XAU |
4340-4355-4370 |
4389-4410-4434-4460- |
4489-4496-4516 |
| Silver-XAG |
64.10-64.60-65.40 |
66.00-66.50-67.15 |
68.00-68.90-69.50 |
| Crude Oil |
80.70-81.20-81.60-82.70 |
83.10-83.70-84.10 |
85.00-86.00-86.75 |
| EURO/USD |
1.1550-1.1568 |
1.1588-1.1610-1.1630 |
1.1655-1.1690 |
| GBP/USD |
1.3500-1.3530-1.3560 |
1.3590 1.3640 |
1.3660-1.3690 |
| USD/JPY |
159.50-160.00-160.7 |
161.00-161.40-161.9 |
162.50 |
| Intraday SUPPORTS LEVELS |
| 14th August 2026 |
S1 |
S2 |
S3 |
| GOLD-XAU |
4324-4304 |
4282-4270-4240 |
4200-4145 |
| Silver-XAG |
63.70-63.25-62.60 |
62.30-61.70-61.30 |
61.00-60.45 |
| Crude Oil |
80.50-80.10-79.30 |
78.70-78.25-77.50 |
77.00-76.00-75.40 |
| EURO/USD |
1.1510-1.1485-1.1465 |
1.1440-1.1400-1.1370 |
1.1355-1.1323-1.1390 |
| GBP/USD |
1.3480-1.3450-1.3410 |
1.3350-1.3315-1.3290 |
1.3270-1.3160-1.3100 |
| USD/JPY |
158.90-157.90-157.10 |
156.50-156.00-155.20 |
154.50-154.00-153.00 |
|
|
| Intra-Day Strategy (14th August 2026) |
| GOLD-XAU |
Sell on Strength |
| Silver-XAG |
Buy on Dips |
|
| Crude Oil |
Neutral to Sell |
| EUR/USD |
Neutral to Sell |
|
| GBP/USD |
Neutral to Buy |
| USD/JPY |
Neutral to Sell |
|
|
|
|
Gold – XAU
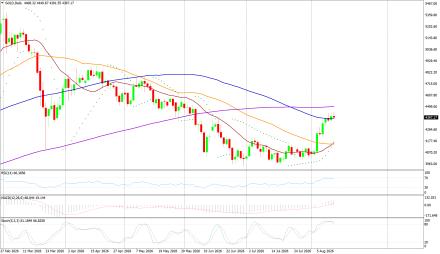
Gold on Thursday interaday high of US$4449.67/oz and low of $4343.67/oz. God is down by 1.300% at US$4350.99/oz.
Technicals in Focus:
On the daily charts, gold trades higher than 20DMA (2197). If it drops below this level, it could lead to 2,100. The MACD is currently above the zero line and the histograms are showing an increasing trend, indicating that there may be upward movement in the coming sessions. The RSI is currently at 83.04, which is in the overbought region, suggesting there may be selling pressure in the next 2 to 3 sessions. The Stochastic Oscillator is also in the overbought territory but has given a positive crossover, indicating a bullish stance for intraday trades, but rebound in expected in all the overbought indicators.
Trading Strategy: Sell on Strength
Sell below 4430-4600 keeping stop loss closing above 4600, targeting 4389-4370-4355-4340 and 4324-4305-4282-4270-4253. Buy in between 4389-4250 with risk below 4200 targeting 4434-4460-4489-4496-4516 and 4540-4555-4570-4595. |
|
| Intraday Support Levels |
| S1 |
|
|
4324-4304 |
| S2 |
|
|
4282-4270-4240 |
| S3 |
|
|
4200-4145 |
| Intraday Resistance Levels |
| R1 |
|
|
4340-4355-4370 |
| R2 |
|
|
4389-4410-4434-4460- |
| R3 |
|
|
4489-4496-4516 |
| Technical Indicators
|
| Name |
|
Value |
Action |
| 14DRSI |
|
52.916 |
Buy |
| 20-DMA |
|
4800.67 |
Buy |
| 50-DMA |
|
4497.76 |
Buy |
| 100-DMA |
|
4239.36 |
Buy |
| 200-DMA |
|
3800.35 |
Buy |
| STOCH(5,3) |
|
26.933 |
Sell |
| MACD(12,26,9) |
|
150.924 |
Buy |
|
|
|
|
Silver - XAG
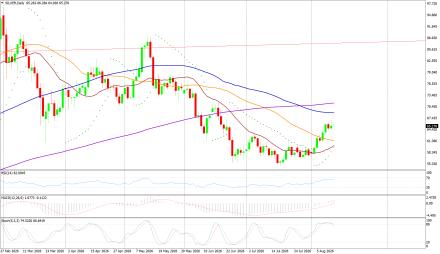
Silver on Thursday its intraday high of US$66.28/oz and low of US$64.19/oz settle down by 1.26% at US$64.44/oz.
Technicals in Focus:
On daily charts, silver is sustaining above 20MA (25.05), breakage above will lead to 23.73. MACD is below the zero line and histograms are increasing trend, bringing a bullish stance in the upcoming sessions. RSI is in the oversold region, indicating a sell signal for now. The Stochastic Oscillator is in the overbought region and gives a positive crossover to show an upside move for the intraday trade.
Trading Strategy: Buy on Dips
Buy in between 63.70-61.00 targeting 64.60-65.40-66.00-66.50-67.15 and 68.00-68.90-69.50-69.90 with stop loss should be placed on the breakage below 61.00.
Sell in between 64.00-71.45 with a stop loss above 72.00 targeting 65.50-65.00-64.60-64.00-63.25 and 62.60-62.30-61.70-61.40-60.90. |
|
| Intraday Support Levels |
| S1 |
|
|
63.70-63.25-62.60 |
| S2 |
|
|
62.30-61.70-61.30 |
| S3 |
|
|
61.00-60.45 |
| Intraday Resistance Levels |
| R1 |
|
|
64.10-64.60-65.40 |
| R2 |
|
|
66.00-66.50-67.15 |
| R3 |
|
|
68.00-68.90-69.50 |
| TECHNICAL INDICATORS |
| Name |
|
Value |
Action |
| 14DRSI |
|
46.1562 |
Buy |
| 20-DMA |
|
92.99 |
Sell |
| 50-DMA |
|
75.81 |
Sell |
| 100-DMA |
|
62.03 |
Sell |
| 200-DMA |
|
49.29 |
Sell |
| STOCH(5,3) |
|
21.094 |
Buy |
| MACD(12,26,9) |
|
5.262 |
Buy |
|
|
|
|
Oil - WTI
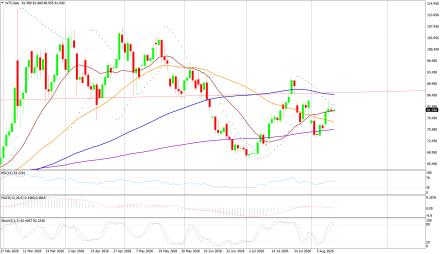
Crude Oil on Thursday high of US$82.25/bbl, an intraday low of US$79.35/bbl, and settled down by 1.434% to close at US$80.40/bbl.
Technicals in Focus:
On daily charts, oil is sustaining above its 100DMA i.e. 75.37, a support level, and breakage above will call for 77.48. MACD is above the zero line and histograms are in increasing mode will bring a bullish stance in the upcoming sessions. The Stochastic Oscillator is in the overbought region, giving a negative crossover to confirm a bearish stance; while the RSI is in the neutral region, more upsides can be expected to reach the overbought region, which is highly probable.
Trading Strategy: Neutral to Sell
Sell in between 80.60-90.50 with stop loss at 91.00 targeting 81.20-80.70-80.10-79.30 and 78.70-78.25-77.50-77.00-76.00-75.40.
Buy above 80.20-75.00 with risk daily closing below 75.00, targeting 81.60-82.70-83.10-83.70 and 84.10-85.00-86.00-86.75. |
|
| Intraday Support Levels |
| S1 |
|
|
80.50-80.10-79.30 |
| S2 |
|
|
78.70-78.25-77.50 |
| S3 |
|
|
77.00-76.00-75.40 |
| Intraday Resistance Levels |
| R1 |
|
|
80.70-81.20-81.60-82.70 |
| R2 |
|
|
83.10-83.70-84.10 |
| R3 |
|
|
85.00-86.00-86.75 |
| TECHNICAL INDICATORS |
| Name |
|
Value |
Action |
| 14DRSI |
|
29.346 |
Sell |
| 20-DMA |
|
67.35 |
Sell |
| 50-DMA |
|
69.06 |
Sell |
| 100-DMA |
|
70.28 |
Sell |
| 200-DMA |
|
71.85 |
Sell |
| STOCH(5,3) |
|
16.166 |
Sell |
| MACD(12,26,9) |
|
-1.306 |
Buy |
|
|
|
|
EUR/USD
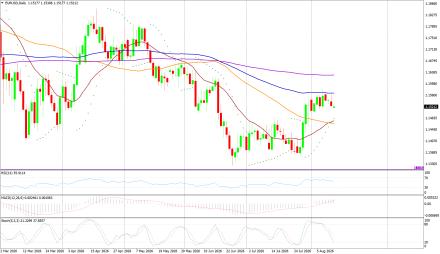
EUR/USD on Thursday made an intraday low of US$1.1511/EUR, a high of US$1.1544/EUR, and settled up by 0.090% to close at US$1.1528/EUR.
Technicals in Focus:
On daily charts, prices are sustaining above 100DMA (1.1661), which becomes immediate support, a break below will target 1.1695. MACD is above the zero line and histograms are increasing mode, bringing a bullish view. Stochastic is in oversold territory, giving negative crossovers to the bullish outlook for intraday. 14D RSI is currently in a neutral region and giving no directions to consider right now.
Trading Strategy: Neutral to Sell
Sell below 1.1540-1.1650, targeting 1.1485-1.1465-1.1440-1.1405 and 1.1370-1.1355-1.1323-1.1390 with stop-loss at daily closing above 1.1520.
Buy above 1.1495-1.1250 with risk below 1.1250 targeting 1.1530-1.1565-1.1590 and 1.1610-1.1650. |
|
| Intraday Support Levels |
| S1 |
|
|
1.1510-1.1485-1.1465 |
| S2 |
|
|
1.1440-1.1400-1.1370 |
| S3 |
|
|
1.1355-1.1323-1.1390 |
| Intraday Resistance Levels |
| R1 |
|
|
1.1550-1.1568 |
| R2 |
|
|
1.1588-1.1610-1.1630 |
| R3 |
|
|
1.1655-1.1690 |
| TECHNICAL INDICATORS |
| Name |
|
Value |
Action |
| 14DRSI |
|
48.897 |
Buy |
| 20-DMA |
|
1.1695 |
Sell |
| 50-DMA |
|
1.1656 |
Buy |
| 100-DMA |
|
1.1661 |
Buy |
| 200-DMA |
|
1.1585 |
Buy |
| STOCH(5,3) |
|
55.688 |
Buy |
| MACD(12,26,9) |
|
-0.0013 |
|
|
|
|
|
GBP/USD
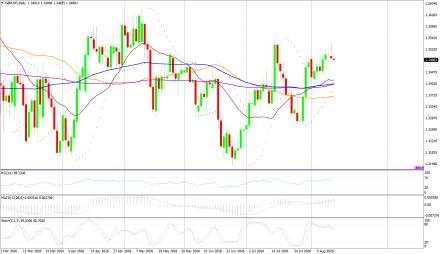
GBP/USD on Thursday made a intraday low of US$1.3473/GBP, a high of US$1.3512/GBP, and settled the day down by 0.049% to close at US$1.3484/GBP.
Technicals in Focus:
On daily charts, prices are sustaining above 50DMA (1.2674) is becoming a support level. 14-D RSI is currently in a neutral region and direction is difficult to predict on an RSI basis. The Stochastic Oscillator is in oversold territory and gives a positive crossover to confirm a bullish stance. MACD is above the zero line, but histograms are increasing leading to movement.
Trading Strategy: Neutral to Buy
Based on the charts and explanations above; buy between 1.3490-1.3079 with a target of 1.3410-1.3350-1.3410-1.3440-1.3490-1.3520-1.3540-1.3570 and 1.3600-1.3640-1.3690 with a stop loss closing below 1.3150.
Sell in between 1.3530-1.3820 with targets at 1.3300-1.3270-1.3190 and 1.3150-1.3135-1.3120-1.3100 with a stop loss of 1.3900. |
|
| Intraday Support Levels |
| S1 |
|
|
1.3480-1.3450-1.3410 |
| S2 |
|
|
1.3350-1.3315-1.3290 |
| S3 |
|
|
1.3270-1.3160-1.3100 |
| Intraday Resistance Levels |
| R1 |
|
|
1.3500-1.3530-1.3560 |
| R2 |
|
|
1.3590 1.3640 |
| R3 |
|
|
1.3660-1.3690 |
| TECHNICAL INDICATORS |
| Name |
|
Value |
Action |
| 14DRSI |
|
46.905 |
Buy |
| 20-DMA |
|
1.2932 |
Buy |
| 50-DMA |
|
1.2736 |
Buy |
| 100-DMA |
|
1.2629 |
Buy |
| 200-DMA |
|
1.2811 |
Buy |
| STOCH(5,3) |
|
9.458 |
Buy |
| MACD(12,26,9) |
|
-0.003 |
Sell |
|
|
|
|
USD/JPY
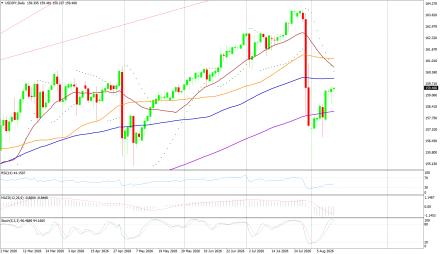
USD/JPY on Thursday made an intra‐day low of JPY159.01/USD an intraday high of 159.55/USD, and settled the day up by 0.058% at JPY159.48/USD.
Technicals in Focus:
In daily charts, JPY is sustaining above 100DMA (152.35), major support on the daily chart. 14-D RSI is currently in the overbought region and chances of downward are expected based on RSI. MACD is above the zero line but histograms are decreasing mode which might lead to downward movement. The Stochastic Oscillator is in overbought territory and signaling to sell as it has given a negative crossover to confirm a bearish stance.
Trading Strategy: Neutral to Sell
Sell below 159.50-161.90 with risk above 162.00 targeting 157.00-156.50-156.00-155.20 and 154.50-154.00-153.00.
Long positions above 158.90-152.00 with targets of 158.40-161.00-161.40-162.40-163.00-163.50 and 164.00-164.60-165.00 with stops below 152.00. |
|
| Intraday Support Levels |
| S1 |
|
|
158.90-157.90-157.10 |
| S2 |
|
|
156.50-156.00-155.20 |
| S3 |
|
|
154.50-154.00-153.00 |
| INTRADAY RESISTANCE LEVELS |
| R1 |
|
|
159.50-160.00-160.7 |
| R2 |
|
|
161.00-161.40-161.9 |
| R3 |
|
|
162.50 |
| TECHNICAL INDICATORS |
| Name |
|
Value |
Action |
| 14DRSI |
|
41.14 |
Buy |
| 20-DMA |
|
148.91 |
Buy |
| 50-DMA |
|
150.24 |
Buy |
| 100-DMA |
|
152.53 |
Buy |
| 200-DMA |
|
151.18 |
Buy |
| STOCH(9,6) |
|
93.662 |
Sell |
| MACD(12,26,9) |
|
0.683 |
Sell |
|
|
|
 |