 |
|
|
Daily Market Lookup
- The U.S. dollar slipped on Friday, after yet more economic data led to a further recalibration in Federal Reserve rate hike expectations. However, the world’s premier currency was on track to snap a two-week losing streak, as rising oil prices due to a diplomatic impasse in the Middle East booted safe haven demand. Much of the focus this week was on key U.S. inflation data and on Friday’s retail sales for cues about monetary policy outlook. The indicators have painted a picture of moderating price pressures and a slowdown in consumer spending, and, coupled with an unexpectedly weak jobs report last week, have taken the pressure off the Fed to immediately tighten policy. Wednesday’s consumer price index (CPI) readings showed a deceleration in annual headline and core figures in July. Thursday’s producer price index (PPI) echoed a similar trend, with annual headline and core indexes ticking up at a slower pace. Interest rate odds have reacted accordingly to the inflation and retail sales data. As per the CME FedWatch tool, the chances of the Fed holding rate steady in September have risen to about 67% from nearly 56% a week ago. The probability of a quarter-point hike has reduced to almost 33% from around 44% a week ago. Lower rate environments tend to weigh on the dollar. Rate-sensitive U.S. Treasury yields slipped on Wednesday and Thursday after the CPI and PPI data as traders snapped up bonds. Yields bounced back on Friday, moving the benchmark 10-year yield into positive territory for the week, but the shorter-end 2-year yield was still set for a weekly loss. While the economic calendar exerted pressure on the dollar this week, that was countered by a weekly climb in oil prices. Brent crude futures, the global benchmark, were last up 1.7% to $88.52 a barrel, and had added 4.5% for the week. The rise was driven by an ongoing impasse between the U.S. and Iran over control of the critical Strait of Hormuz. Both sides have independently asserted authority over the vital waterway, with Tehran insisting that Washington meet certain demands including the cessation of hostilities on all fronts and the unfreezing of Iranian assets before the chokepoint can be reopened. The U.S. is now considering maintaining its naval blockade of Iran indefinitely as efforts to end the conflict and restore normal shipping through the strait remain stalled. Tanker traffic through the corridor has slowed to a trickle, leading to concerns about oil supply disruptions. Those worries have been compounded by attacks on ships in the Bab el-Mandeb Strait - another key Gulf shipping lane - by Iran-backed Houthis in Yemen. Turning to other major currencies, the Japanese yen strengthened on Friday, but was set for a weekly decline of about 1% against the dollar. After a historic joint intervention by Washington and Tokyo at the end of last month, the yen has failed to hold on to those gains, having eased against the greenback for two consecutive weeks now.
- Gold prices rose on Monday as investors balanced weaker U.S. economic data against renewed energy-market risks, with the Federal Reserve's July meeting minutes due later this week offering fresh clues on the path for interest rates. Gold entered the new week after ending the previous week nearly 1% higher, with the latest U.S. data helping to ease fears of an imminent rate increase. U.S. consumer sentiment declined for the first time in three months, while retail sales posted their biggest monthly drop in more than a year. The softer readings have reduced some of the pressure on the Federal Reserve to tighten policy, supporting a metal that does not generate interest income The inverse relationship between gold and U.S. Treasury yields has also strengthened, according to ANZ analysts, with higher borrowing costs increasingly weighing on bullion. The brokerage expects gold's performance over the next year to develop in three stages: near-term pressure from persistent inflation and a Fed that remains on hold, followed by an economic slowdown caused by an energy shock, and eventually stronger support from monetary easing. ANZ expects deteriorating international relations to keep central-bank diversification demand relevant and sees gold rising toward $5,200 an ounce by year-end. Investors will get a closer look at policymakers' thinking on Wednesday, when the minutes from the Fed's July meeting are scheduled for release.
The softer economic data have not removed the inflation risk. Several ships came under attack in the Strait of Hormuz late last week, while the U.S. said it was preparing additional measures aimed at putting further pressure on Iran's economy. At the same time, vessels have continued leaving the strategic waterway, in some cases switching off satellite transponders to reduce the risk of detection. Iran and Oman also appear to be moving closer to an agreement on how the Strait of Hormuz should be managed, although the United States is not involved in those negotiations That mix of disrupted shipping, continued geopolitical tension and tentative diplomacy has kept the outlook for global energy supplies volatile. Any renewed rise in oil prices could feed inflation and make it harder for the Fed to move toward easier monetary policy.
- Oil prices fell slightly in Asian trade on Monday after clocking strong gains last week, with continued uncertainty over U.S.-Iran relations and the Strait of Hormuz limiting overall declines in crude. Brent surged over 5% last week as U.S.-Iran hostilities continued, with Tehran attacking more energy infrastructure in West Asia. Shipping through the Strait of Hormuz also slowed further following Iranian attacks on tankers in the region, while the U.S. maintained its naval blockade against Tehran.
- The West Asian conflict entered a new front in the Red Sea, as Yemen’s Iran-backed Houthis continued to attack ships in the Bab al-Mandab strait. Attacks in the region threatened to further destabilize oil supplies in West Asia. Concerns over tightening supplies largely overshadowed forecasts for weaker global oil demand from major industry bodies, released last week. Both the Organization of Petroleum Exporting Countries and the International Energy Administration cut their demand forecasts for 2026.
|
|
| Intraday RESISTANCE LEVELS |
| 17th August 2026 |
R1 |
R2 |
R3 |
| GOLD-XAU |
4410-4434-4460 |
4489-4504-4516 |
4530-4554-4570-4595 |
| Silver-XAG |
66.00-66.50-67.15 |
68.00-68.90-69.50 |
|
| Crude Oil |
81.60-82.70 |
83.10-83.70-84.10 |
85.00-86.00-86.75 |
| EURO/USD |
1.1588-1.1610-1.1627 |
1.1655-1.1690 |
1.1720-1.1750 |
| GBP/USD |
1.3560-1.3590 |
1.3640 |
1.3660-1.3690-1.3730 |
| USD/JPY |
159.50-160.00-160.7 |
161.00-161.40-161.9 |
162.50 |
| Intraday SUPPORTS LEVELS |
| 17th August 2026 |
S1 |
S2 |
S3 |
| GOLD-XAU |
4385-4370-4355 |
4340-4324-4304 |
4282-4270-4248 |
| Silver-XAG |
65.40-64.60-64.10-63.70 |
63.25-62.60-62.30 |
61.70-61.00-60.45 |
| Crude Oil |
81.20-80.50-80.10-79.30 |
78.70-78.25-77.50 |
77.00-76.00-75.40 |
| EURO/USD |
1.1550-1.1510-1.1485-1.1465 |
1.1440-1.1400-1.1370 |
1.1355-1.1323-1.1390 |
| GBP/USD |
1.3530-1.3480-1.3450-1.3410 |
1.3350-1.3315-1.3290 |
1.3270-1.3160-1.3100 |
| USD/JPY |
158.90-157.90-157.10 |
156.50-156.00-155.20 |
154.50-154.00-153.00 |
|
|
| Intra-Day Strategy (17th August 2026) |
| GOLD-XAU |
Sell on Strength |
| Silver-XAG |
Buy on Dips |
|
| Crude Oil |
Neutral to Sell |
| EUR/USD |
Neutral to Sell |
|
| GBP/USD |
Neutral to Buy |
| USD/JPY |
Neutral to Sell |
|
|
|
|
Gold – XAU
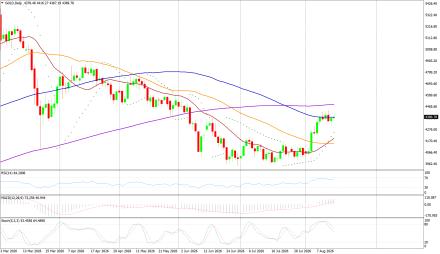
Gold on Friday interaday high of US$4396.92/oz and low of $4310.84/oz. God is up by 0.540% at US$4376.58/oz
Technicals in Focus:
On the daily charts, gold trades higher than 20DMA (2197). If it drops below this level, it could lead to 2,100. The MACD is currently above the zero line and the histograms are showing an increasing trend, indicating that there may be upward movement in the coming sessions. The RSI is currently at 83.04, which is in the overbought region, suggesting there may be selling pressure in the next 2 to 3 sessions. The Stochastic Oscillator is also in the overbought territory but has given a positive crossover, indicating a bullish stance for intraday trades, but rebound in expected in all the overbought indicators.
Trading Strategy: Sell on Strength
Sell below 4405-4600 keeping stop loss closing above 4600, targeting 4389-4370-4355-4340 and 4324-4305-4282-4270-4253. Buy in between 4389-4250 with risk below 4200 targeting 4434-4460-4489-4496-4516 and 4540-4555-4570-4595. |
|
| Intraday Support Levels |
| S1 |
|
|
4385-4370-4355 |
| S2 |
|
|
4340-4324-4304 |
| S3 |
|
|
4282-4270-4248 |
| Intraday Resistance Levels |
| R1 |
|
|
4410-4434-4460 |
| R2 |
|
|
4489-4504-4516 |
| R3 |
|
|
4530-4554-4570-4595 |
| Technical Indicators
|
| Name |
|
Value |
Action |
| 14DRSI |
|
52.916 |
Buy |
| 20-DMA |
|
4800.67 |
Buy |
| 50-DMA |
|
4497.76 |
Buy |
| 100-DMA |
|
4239.36 |
Buy |
| 200-DMA |
|
3800.35 |
Buy |
| STOCH(5,3) |
|
26.933 |
Sell |
| MACD(12,26,9) |
|
150.924 |
Buy |
|
|
|
|
Silver - XAG
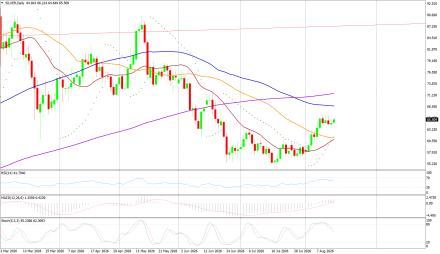
Silver on Friday its intraday high of US$65.68/oz and low of US$63.48/oz settle up by 0.444% at US$64.49/oz.
Technicals in Focus:
On daily charts, silver is sustaining above 20MA (25.05), breakage above will lead to 23.73. MACD is below the zero line and histograms are increasing trend, bringing a bullish stance in the upcoming sessions. RSI is in the oversold region, indicating a sell signal for now. The Stochastic Oscillator is in the overbought region and gives a positive crossover to show an upside move for the intraday trade.
Trading Strategy: Buy on Dips
Buy in between 65.40-61.00 targeting 65.40-66.00-66.50-67.15 and 68.00-68.90-69.50-69.90 with stop loss should be placed on the breakage below 61.00.
Sell in between 66.00-71.45 with a stop loss above 72.00 targeting 65.50-65.00-64.60-64.00-63.25 and 62.60-62.30-61.70-61.40-60.90. |
|
| Intraday Support Levels |
| S1 |
|
|
65.40-64.60-64.10-63.70 |
| S2 |
|
|
63.25-62.60-62.30 |
| S3 |
|
|
61.70-61.00-60.45 |
| Intraday Resistance Levels |
| R1 |
|
|
66.00-66.50-67.15 |
| R2 |
|
|
68.00-68.90-69.50 |
| R3 |
|
|
|
| TECHNICAL INDICATORS |
| Name |
|
Value |
Action |
| 14DRSI |
|
46.1562 |
Buy |
| 20-DMA |
|
92.99 |
Sell |
| 50-DMA |
|
75.81 |
Sell |
| 100-DMA |
|
62.03 |
Sell |
| 200-DMA |
|
49.29 |
Sell |
| STOCH(5,3) |
|
21.094 |
Buy |
| MACD(12,26,9) |
|
5.262 |
Buy |
|
|
|
|
Oil - WTI
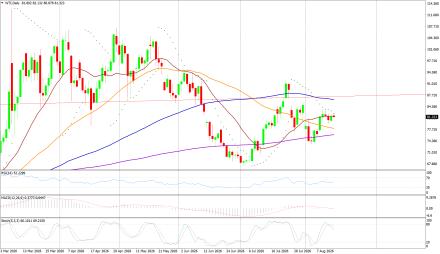
Crude Oil on Friday high of US$84.27/bbl, an intraday low of US$79.91/bbl, and settled up by 1.59% to close at US$81.48/bbl.
Technicals in Focus:
On daily charts, oil is sustaining above its 100DMA i.e. 75.37, a support level, and breakage above will call for 77.48. MACD is above the zero line and histograms are in increasing mode will bring a bullish stance in the upcoming sessions. The Stochastic Oscillator is in the overbought region, giving a negative crossover to confirm a bearish stance; while the RSI is in the neutral region, more upsides can be expected to reach the overbought region, which is highly probable.
Trading Strategy: Neutral to Sell
Sell in between 81.60-90.50 with stop loss at 91.00 targeting 81.20-80.70-80.10-79.30 and 78.70-78.25-77.50-77.00-76.00-75.40.
Buy above 80.20-75.00 with risk daily closing below 75.00, targeting 81.60-82.70-83.10-83.70 and 84.10-85.00-86.00-86.75. |
|
| Intraday Support Levels |
| S1 |
|
|
81.20-80.50-80.10-79.30 |
| S2 |
|
|
78.70-78.25-77.50 |
| S3 |
|
|
77.00-76.00-75.40 |
| Intraday Resistance Levels |
| R1 |
|
|
81.60-82.70 |
| R2 |
|
|
83.10-83.70-84.10 |
| R3 |
|
|
85.00-86.00-86.75 |
| TECHNICAL INDICATORS |
| Name |
|
Value |
Action |
| 14DRSI |
|
29.346 |
Sell |
| 20-DMA |
|
67.35 |
Sell |
| 50-DMA |
|
69.06 |
Sell |
| 100-DMA |
|
70.28 |
Sell |
| 200-DMA |
|
71.85 |
Sell |
| STOCH(5,3) |
|
16.166 |
Sell |
| MACD(12,26,9) |
|
-1.306 |
Buy |
|
|
|
|
EUR/USD
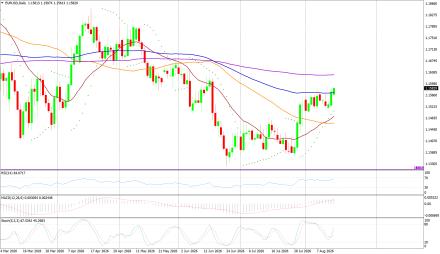
EUR/USD on Friday made an intraday low of US$1.1524/EUR, a high of US$1.1584/EUR, and settled up by 0.396% to close at US$1.1570/EUR.
Technicals in Focus:
On daily charts, prices are sustaining above 100DMA (1.1661), which becomes immediate support, a break below will target 1.1695. MACD is above the zero line and histograms are increasing mode, bringing a bullish view. Stochastic is in oversold territory, giving negative crossovers to the bullish outlook for intraday. 14D RSI is currently in a neutral region and giving no directions to consider right now.
Trading Strategy: Neutral to Sell
Sell below 1.1590-1.1650, targeting 1.1485-1.1465-1.1440-1.1405 and 1.1370-1.1355-1.1323-1.1390 with stop-loss at daily closing above 1.1520.
Buy above 1.1550-1.1250 with risk below 1.1250 targeting 1.1530-1.1565-1.1590 and 1.1610-1.1650. |
|
| Intraday Support Levels |
| S1 |
|
|
1.1550-1.1510-1.1485-1.1465 |
| S2 |
|
|
1.1440-1.1400-1.1370 |
| S3 |
|
|
1.1355-1.1323-1.1390 |
| Intraday Resistance Levels |
| R1 |
|
|
1.1588-1.1610-1.1627 |
| R2 |
|
|
1.1655-1.1690 |
| R3 |
|
|
1.1720-1.1750 |
| TECHNICAL INDICATORS |
| Name |
|
Value |
Action |
| 14DRSI |
|
48.897 |
Buy |
| 20-DMA |
|
1.1695 |
Sell |
| 50-DMA |
|
1.1656 |
Buy |
| 100-DMA |
|
1.1661 |
Buy |
| 200-DMA |
|
1.1585 |
Buy |
| STOCH(5,3) |
|
55.688 |
Buy |
| MACD(12,26,9) |
|
-0.0013 |
|
|
|
|
|
GBP/USD
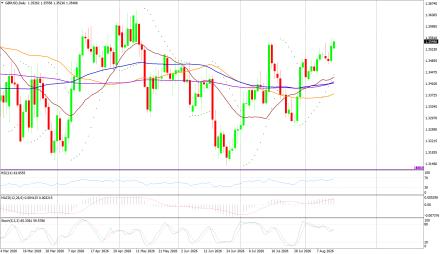
GBP/USD on Friday made a intraday low of US$1.3476/GBP, a high of US$1.3561/GBP, and settled the day up by 0.370% to close at US$1.3534/GBP.
Technicals in Focus:
On daily charts, prices are sustaining above 50DMA (1.2674) is becoming a support level. 14-D RSI is currently in a neutral region and direction is difficult to predict on an RSI basis. The Stochastic Oscillator is in oversold territory and gives a positive crossover to confirm a bullish stance. MACD is above the zero line, but histograms are increasing leading to movement.
Trading Strategy: Neutral to Buy
Based on the charts and explanations above; buy between 1.3530-1.3079 with a target of 1.3410-1.3350-1.3410-1.3440-1.3490-1.3520-1.3540-1.3570 and 1.3600-1.3640-1.3690 with a stop loss closing below 1.3150.
Sell in between 1.3560-1.3820 with targets at 1.3300-1.3270-1.3190 and 1.3150-1.3135-1.3120-1.3100 with a stop loss of 1.3900. |
|
| Intraday Support Levels |
| S1 |
|
|
1.3530-1.3480-1.3450-1.3410 |
| S2 |
|
|
1.3350-1.3315-1.3290 |
| S3 |
|
|
1.3270-1.3160-1.3100 |
| Intraday Resistance Levels |
| R1 |
|
|
1.3560-1.3590 |
| R2 |
|
|
1.3640 |
| R3 |
|
|
1.3660-1.3690-1.3730 |
| TECHNICAL INDICATORS |
| Name |
|
Value |
Action |
| 14DRSI |
|
46.905 |
Buy |
| 20-DMA |
|
1.2932 |
Buy |
| 50-DMA |
|
1.2736 |
Buy |
| 100-DMA |
|
1.2629 |
Buy |
| 200-DMA |
|
1.2811 |
Buy |
| STOCH(5,3) |
|
9.458 |
Buy |
| MACD(12,26,9) |
|
-0.003 |
Sell |
|
|
|
|
USD/JPY
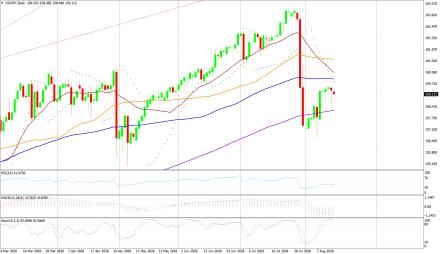
USD/JPY on Friday made an intra‐day low of JPY158.59/USD an intraday high of 159.50/USD, and settled the day up by 0.094% at JPY159.31/USD.
Technicals in Focus:
In daily charts, JPY is sustaining above 100DMA (152.35), major support on the daily chart. 14-D RSI is currently in the overbought region and chances of downward are expected based on RSI. MACD is above the zero line but histograms are decreasing mode which might lead to downward movement. The Stochastic Oscillator is in overbought territory and signaling to sell as it has given a negative crossover to confirm a bearish stance.
Trading Strategy: Neutral to Sell
Sell below 159.50-161.90 with risk above 162.00 targeting 157.00-156.50-156.00-155.20 and 154.50-154.00-153.00.
Long positions above 158.90-152.00 with targets of 158.40-161.00-161.40-162.40-163.00-163.50 and 164.00-164.60-165.00 with stops below 152.00. |
|
| Intraday Support Levels |
| S1 |
|
|
158.90-157.90-157.10 |
| S2 |
|
|
156.50-156.00-155.20 |
| S3 |
|
|
154.50-154.00-153.00 |
| INTRADAY RESISTANCE LEVELS |
| R1 |
|
|
159.50-160.00-160.7 |
| R2 |
|
|
161.00-161.40-161.9 |
| R3 |
|
|
162.50 |
| TECHNICAL INDICATORS |
| Name |
|
Value |
Action |
| 14DRSI |
|
41.14 |
Buy |
| 20-DMA |
|
148.91 |
Buy |
| 50-DMA |
|
150.24 |
Buy |
| 100-DMA |
|
152.53 |
Buy |
| 200-DMA |
|
151.18 |
Buy |
| STOCH(9,6) |
|
93.662 |
Sell |
| MACD(12,26,9) |
|
0.683 |
Sell |
|
|
|
 |