 |
|
|
Daily Market Lookup
- The U.S. dollar on Monday recovered after earlier sliding to its lowest level in over two months, but remained in negative territory amid reduced expectations for imminent Federal Reserve interest rate hikes. Oil prices extended weekly gains, keeping inflation jitters on the table. Currency market participants are coming off a key week in which the economic calendar showed a moderation in annual consumer and producer inflation across both headline and core measures in July. Arriving after an unexpectedly weak July nonfarm payrolls report, and coupled with a soft retail sales reading on Friday, the data together suggests some breathing room for the Fed in terms of not immediately tightening policy. Interest rate odds reacted accordingly. As per the CME FedWatch tool, the probability of the central bank holding rates steady in September stand at about 63%, while the chances of a quarter-point hike are at nearly 37%. There will likely be some more insight into the central bank’s thinking later this week when the minutes of the Federal Open Market Committee’s (FOMC) July meeting will be published. Three regional Fed presidents had dissented with the FOMC’s move to hold rates steady, and watchers of monetary policy will be keen to see if there will be any more hawkish commentary in the minutes The dollar on Tuesday bounced off its session low in part due a boost to safe-haven demand amid rising oil prices, with Brent crude futures, the global benchmark, topping $90 a barrel. The advance came as the U.S. and Iran continued to remain at loggerheads over the Strait of Hormuz. Both sides have independently asserted control over the vital waterway, while Tehran has demanded that Washington fulfill conditions such as ceasing hostilities across all fronts and unfreezing Iranian assets before the chokepoint can be reopened. Meanwhile, Iran has been working on a framework for management of the strait with Oman. Fox News on Monday quoted President Donald Trump as saying: "If Oman gets in the way, we’ll bomb the s--- out of them." Monday also marks the expiration of the memorandum of understanding signed between the U.S. and Iran in mid-June, which effectively collapsed in July after the two sides exchanged tit-for-tat strikes over attacks on commercial ships in the strait. Trump told reporters that he would not be extending the agreement. Turning to other major currencies, the Japanese yen weakened slightly on Monday, with the USD/JPY pair up 0.1% to 159.49. The yen has given up about roughly half of the gains it made against the dollar following a historic joint intervention by Washington and Tokyo at the end of July. The easing in the yen also came after softer-than-expected domestic economic growth data. Official figures showed Japan’s economy expanded at an annualized rate of 1.1% in Q2, missing market forecasts of 2% and slowing from a revised 1.9% expansion in the prior quarter. On a quarterly basis, GDP rose 0.3%, trailing expectations for 0.5% as weak private consumption and a contraction in capital expenditure dragged on output.
- Gold prices held near the $4,400-an-ounce level on Tuesday as softer U.S. economic data continued to reduce expectations for Federal Reserve tightening, while renewed Middle East tensions supported demand for bullion despite higher Treasury yields. Softer data ease Fed hike bets, dollar hits three-month low. Gold has added about 1.5% over the past two sessions, with the latest advance extending the rebound from the $4,000-an-ounce area. Softer U.S. economic data have reduced expectations for another Federal Reserve rate increase, weakening the dollar and removing two headwinds that had contributed to gold's earlier correction. Interest-rate swaps also no longer fully price another Fed rate increase before the end of the year, compared with last week when markets had priced in another hike by year-end. The prospect of fewer rate increases is generally supportive for non-yielding gold. At the same time, the yield on 30-year U.S. Treasuries climbed to its highest level in almost two decades, reflecting investor concern over rising government spending, heavy issuance of long-dated debt and inflation. That unusual combination can still support gold as investors seek protection from higher government debt burdens, even as elevated yields normally make bullion less attractive. Gold's rebound has also taken it back toward its 100-day moving average, which it broke above last week for the first time since April. The metal continues to hover around that level. Investors will get another look at the Fed's thinking on Wednesday, when minutes from the July policy meeting are due. Attention will then turn to Chairman Kevin Warsh's comments at the Fed's annual Jackson Hole symposium later this month. The softer U.S. data have not removed the inflation risk. Renewed fighting in Lebanon has added to regional uncertainty, while U.S. President Donald Trump said he was not interested in extending the interim truce with Iran that was agreed in June. Tensions also remain elevated around the Strait of Hormuz, where attacks on vessels continue to disrupt shipping. Any prolonged disruption could push energy prices higher again and revive inflation concerns, increasing the risk that the Federal Reserve keeps policy tighter for longer. Against that backdrop, gold has shown greater resilience to higher yields, suggesting that geopolitical demand is helping offset some of the usual pressure from the rates market China remains another source of support. Gold's recovery above the $4,000 threshold has been driven in part by renewed investor appetite and stronger central-bank buying, particularly from China. Tony Sycamore, senior market analyst at IG, said gold's latest move suggests the metal may be forming a base around the late-June low near $3,942.
- Oil prices rose on Tuesday as prospects receded for a deal to end the Middle East war, with Iran saying it would adopt a more offensive stance and the United States ruling out extension of a ceasefire deal, heightening worries about energy supply. Iran will shift to a "fully offensive" military posture as efforts have stalled towards a permanent end to the war, a senior Iranian official told Reuters on Monday, as Washington ruled out extending their temporary ceasefire pact. Outward progress on peace talks and resumption of oil tanker traffic through the strategic Strait of Hormuz has halted, threatening to extend the conflict the United States and Israel launched with attacks on Iran on February 28. A projectile struck a vessel transiting out of the Strait of Hormuz on Tuesday in the latest of the attacks that have kept crossings to the single digits, despite a slight rise from the weekend, tracking data showed. Yemen’s Houthis launched missiles in an attack on vessels they described as a Saudi military ship and four escorts in the Red Sea, their military spokesperson, Yahya Saree, said on the Telegram messaging app. While the deal-related uncertainty lasts, he expected oil prices to range within $80 and $100 a barrel in the near term. Iran has separately been negotiating with Oman an agreement on managing the Strait of Hormuz and says they are close to a deal. But Trump responded to those talks with a threat to bomb the Gulf state, a longstanding U.S. security partner. U.S. crude oil stockpiles were expected to have fallen last week alongside product inventories, a preliminary Reuters poll showed on Monday.
|
|
| Intraday RESISTANCE LEVELS |
| 18th August 2026 |
R1 |
R2 |
R3 |
| GOLD-XAU |
4410-4434-4460 |
4489-4504-4516 |
4530-4554-4570-4595 |
| Silver-XAG |
65.40-66.00-66.50 |
67.15-68.00- |
68.90-69.50 |
| Crude Oil |
84.60-85.00-85.55 |
86.15-86.75 |
87.25-88.00 |
| EURO/USD |
1.1588-1.1610-1.1627 |
1.1655-1.1690 |
1.1720-1.1750 |
| GBP/USD |
1.3560-1.3590 |
1.3640 |
1.3660-1.3690-1.3730 |
| USD/JPY |
159.50-160.00-160.7 |
161.00-161.40-161.9 |
162.50 |
| Intraday SUPPORTS LEVELS |
| 18th August 2026 |
S1 |
S2 |
S3 |
| GOLD-XAU |
4385-4370-4355 |
4340-4324-4304 |
4282-4270-4248 |
| Silver-XAG |
64.60-64.10-63.70 |
63.25-62.60-62.30 |
61.70-61.00-60.45 |
| Crude Oil |
84.10-83.70-83.10 |
82.70-81.20-80.50 |
80.10-79.30-78.70 |
| EURO/USD |
1.1550-1.1510-1.1485-1.1465 |
1.1440-1.1400-1.1370 |
1.1355-1.1323-1.1390 |
| GBP/USD |
1.3530-1.3480-1.3450-1.3410 |
1.3350-1.3315-1.3290 |
1.3270-1.3160-1.3100 |
| USD/JPY |
158.90-157.90-157.10 |
156.50-156.00-155.20 |
154.50-154.00-153.00 |
|
|
| Intra-Day Strategy (18th August 2026) |
| GOLD-XAU |
Sell on Strength |
| Silver-XAG |
Buy on Dips |
|
| Crude Oil |
Neutral to Sell |
| EUR/USD |
Neutral to Sell |
|
| GBP/USD |
Neutral to Buy |
| USD/JPY |
Neutral to Sell |
|
|
|
|
Gold – XAU
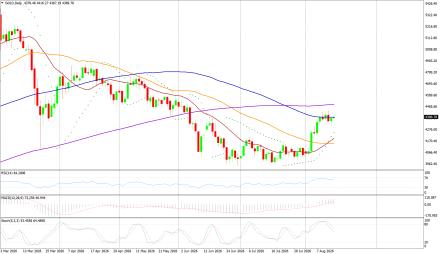
Gold on Monday interaday high of US$4428.90/oz and low of $4367.19/oz. God is up by 0.855% at US$4415.92/oz.
Technicals in Focus:
On the daily charts, gold trades higher than 20DMA (2197). If it drops below this level, it could lead to 2,100. The MACD is currently above the zero line and the histograms are showing an increasing trend, indicating that there may be upward movement in the coming sessions. The RSI is currently at 83.04, which is in the overbought region, suggesting there may be selling pressure in the next 2 to 3 sessions. The Stochastic Oscillator is also in the overbought territory but has given a positive crossover, indicating a bullish stance for intraday trades, but rebound in expected in all the overbought indicators.
Trading Strategy: Sell on Strength
Sell below 4405-4600 keeping stop loss closing above 4600, targeting 4389-4370-4355-4340 and 4324-4305-4282-4270-4253. Buy in between 4389-4250 with risk below 4200 targeting 4434-4460-4489-4496-4516 and 4540-4555-4570-4595. |
|
| Intraday Support Levels |
| S1 |
|
|
4385-4370-4355 |
| S2 |
|
|
4340-4324-4304 |
| S3 |
|
|
4282-4270-4248 |
| Intraday Resistance Levels |
| R1 |
|
|
4410-4434-4460 |
| R2 |
|
|
4489-4504-4516 |
| R3 |
|
|
4530-4554-4570-4595 |
| Technical Indicators
|
| Name |
|
Value |
Action |
| 14DRSI |
|
52.916 |
Buy |
| 20-DMA |
|
4800.67 |
Buy |
| 50-DMA |
|
4497.76 |
Buy |
| 100-DMA |
|
4239.36 |
Buy |
| 200-DMA |
|
3800.35 |
Buy |
| STOCH(5,3) |
|
26.933 |
Sell |
| MACD(12,26,9) |
|
150.924 |
Buy |
|
|
|
|
Silver - XAG
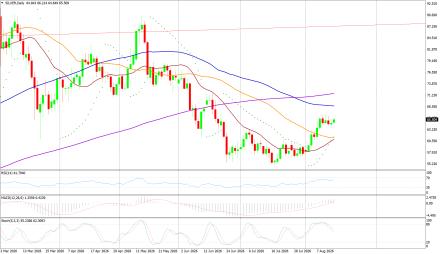
Silver on Monday its intraday high of US$65.53/oz and low of US$64.64/oz settle up by 1.411% at US$65.75/oz.
Technicals in Focus:
On daily charts, silver is sustaining above 20MA (25.05), breakage above will lead to 23.73. MACD is below the zero line and histograms are increasing trend, bringing a bullish stance in the upcoming sessions. RSI is in the oversold region, indicating a sell signal for now. The Stochastic Oscillator is in the overbought region and gives a positive crossover to show an upside move for the intraday trade.
Trading Strategy: Buy on Dips
Buy in between 65.00-61.00 targeting 65.40-66.00-66.50-67.15 and 68.00-68.90-69.50-69.90 with stop loss should be placed on the breakage below 61.00.
Sell in between 65.40-71.45 with a stop loss above 72.00 targeting 65.50-65.00-64.60-64.00-63.25 and 62.60-62.30-61.70-61.40-60.90. |
|
| Intraday Support Levels |
| S1 |
|
|
64.60-64.10-63.70 |
| S2 |
|
|
63.25-62.60-62.30 |
| S3 |
|
|
61.70-61.00-60.45 |
| Intraday Resistance Levels |
| R1 |
|
|
65.40-66.00-66.50 |
| R2 |
|
|
67.15-68.00- |
| R3 |
|
|
68.90-69.50 |
| TECHNICAL INDICATORS |
| Name |
|
Value |
Action |
| 14DRSI |
|
46.1562 |
Buy |
| 20-DMA |
|
92.99 |
Sell |
| 50-DMA |
|
75.81 |
Sell |
| 100-DMA |
|
62.03 |
Sell |
| 200-DMA |
|
49.29 |
Sell |
| STOCH(5,3) |
|
21.094 |
Buy |
| MACD(12,26,9) |
|
5.262 |
Buy |
|
|
|
|
Oil - WTI
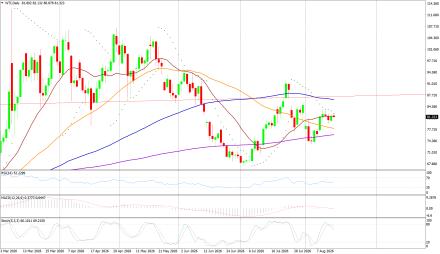
Crude Oil on Monday high of US$84.14/bbl, an intraday low of US$80.78/bbl, and settled up by 2.90% to close at US$84.06/bbl.
Technicals in Focus:
On daily charts, oil is sustaining above its 100DMA i.e. 75.37, a support level, and breakage above will call for 77.48. MACD is above the zero line and histograms are in increasing mode will bring a bullish stance in the upcoming sessions. The Stochastic Oscillator is in the overbought region, giving a negative crossover to confirm a bearish stance; while the RSI is in the neutral region, more upsides can be expected to reach the overbought region, which is highly probable.
Trading Strategy: Neutral to Sell
Sell in between 84.60-90.50 with stop loss at 91.00 targeting 84.10-83.7081.20-80.70-80.10-79.30 and 78.70-78.25-77.50-77.00-76.00-75.40.
Buy above 84.10-75.00 with risk daily closing below 75.00, targeting 84.60-85.00-85.55-86.00 and 86.75-87.25-88.00. |
|
| Intraday Support Levels |
| S1 |
|
|
84.10-83.70-83.10 |
| S2 |
|
|
82.70-81.20-80.50 |
| S3 |
|
|
80.10-79.30-78.70 |
| Intraday Resistance Levels |
| R1 |
|
|
84.60-85.00-85.55 |
| R2 |
|
|
86.15-86.75 |
| R3 |
|
|
87.25-88.00 |
| TECHNICAL INDICATORS |
| Name |
|
Value |
Action |
| 14DRSI |
|
29.346 |
Sell |
| 20-DMA |
|
67.35 |
Sell |
| 50-DMA |
|
69.06 |
Sell |
| 100-DMA |
|
70.28 |
Sell |
| 200-DMA |
|
71.85 |
Sell |
| STOCH(5,3) |
|
16.166 |
Sell |
| MACD(12,26,9) |
|
-1.306 |
Buy |
|
|
|
|
EUR/USD
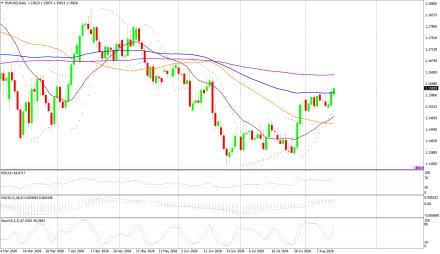
EUR/USD on Monday made an intraday low of US$1.1561/EUR, a high of US$1.1613/EUR, and settled up by 0.146% to close at US$1.1578/EUR.
Technicals in Focus:
On daily charts, prices are sustaining above 100DMA (1.1661), which becomes immediate support, a break below will target 1.1695. MACD is above the zero line and histograms are increasing mode, bringing a bullish view. Stochastic is in oversold territory, giving negative crossovers to the bullish outlook for intraday. 14D RSI is currently in a neutral region and giving no directions to consider right now.
Trading Strategy: Neutral to Sell
Sell below 1.1590-1.1650, targeting 1.1485-1.1465-1.1440-1.1405 and 1.1370-1.1355-1.1323-1.1390 with stop-loss at daily closing above 1.1520.
Buy above 1.1550-1.1250 with risk below 1.1250 targeting 1.1530-1.1565-1.1590 and 1.1610-1.1650. |
|
| Intraday Support Levels |
| S1 |
|
|
1.1550-1.1510-1.1485-1.1465 |
| S2 |
|
|
1.1440-1.1400-1.1370 |
| S3 |
|
|
1.1355-1.1323-1.1390 |
| Intraday Resistance Levels |
| R1 |
|
|
1.1588-1.1610-1.1627 |
| R2 |
|
|
1.1655-1.1690 |
| R3 |
|
|
1.1720-1.1750 |
| TECHNICAL INDICATORS |
| Name |
|
Value |
Action |
| 14DRSI |
|
48.897 |
Buy |
| 20-DMA |
|
1.1695 |
Sell |
| 50-DMA |
|
1.1656 |
Buy |
| 100-DMA |
|
1.1661 |
Buy |
| 200-DMA |
|
1.1585 |
Buy |
| STOCH(5,3) |
|
55.688 |
Buy |
| MACD(12,26,9) |
|
-0.0013 |
Buy |
|
|
|
|
GBP/USD
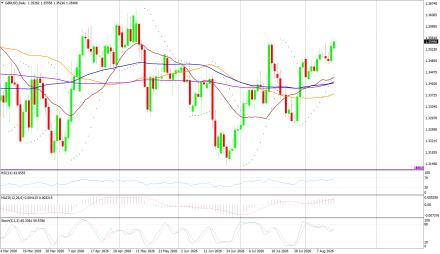
GBP/USD on Monday made a intraday low of US$1.3523/GBP, a high of US$1.3570/GBP, and settled the day up by 0.370% to close at US$1.3540/GBP.
Technicals in Focus:
On daily charts, prices are sustaining above 50DMA (1.2674) is becoming a support level. 14-D RSI is currently in a neutral region and direction is difficult to predict on an RSI basis. The Stochastic Oscillator is in oversold territory and gives a positive crossover to confirm a bullish stance. MACD is above the zero line, but histograms are increasing leading to movement.
Trading Strategy: Neutral to Buy
Based on the charts and explanations above; buy between 1.3530-1.3079 with a target of 1.3410-1.3350-1.3410-1.3440-1.3490-1.3520-1.3540-1.3570 and 1.3600-1.3640-1.3690 with a stop loss closing below 1.3150.
Sell in between 1.3560-1.3820 with targets at 1.3300-1.3270-1.3190 and 1.3150-1.3135-1.3120-1.3100 with a stop loss of 1.3900. |
|
| Intraday Support Levels |
| S1 |
|
|
1.3530-1.3480-1.3450-1.3410 |
| S2 |
|
|
1.3350-1.3315-1.3290 |
| S3 |
|
|
1.3270-1.3160-1.3100 |
| Intraday Resistance Levels |
| R1 |
|
|
1.3560-1.3590 |
| R2 |
|
|
1.3640 |
| R3 |
|
|
1.3660-1.3690-1.3730 |
| TECHNICAL INDICATORS |
| Name |
|
Value |
Action |
| 14DRSI |
|
46.905 |
Buy |
| 20-DMA |
|
1.2932 |
Buy |
| 50-DMA |
|
1.2736 |
Buy |
| 100-DMA |
|
1.2629 |
Buy |
| 200-DMA |
|
1.2811 |
Buy |
| STOCH(5,3) |
|
9.458 |
Buy |
| MACD(12,26,9) |
|
-0.003 |
Sell |
|
|
|
|
USD/JPY
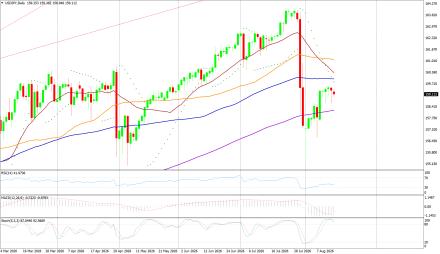
USD/JPY on Monday made an intra‐day low of JPY158.83/USD an intraday high of 158.83/USD, and settled the day up by 0.130% at JPY159.46/USD.
Technicals in Focus:
In daily charts, JPY is sustaining above 100DMA (152.35), major support on the daily chart. 14-D RSI is currently in the overbought region and chances of downward are expected based on RSI. MACD is above the zero line but histograms are decreasing mode which might lead to downward movement. The Stochastic Oscillator is in overbought territory and signaling to sell as it has given a negative crossover to confirm a bearish stance.
Trading Strategy: Neutral to Sell
Sell below 159.50-161.90 with risk above 162.00 targeting 157.00-156.50-156.00-155.20 and 154.50-154.00-153.00.
Long positions above 158.90-152.00 with targets of 158.40-161.00-161.40-162.40-163.00-163.50 and 164.00-164.60-165.00 with stops below 152.00.
|
|
| Intraday Support Levels |
| S1 |
|
|
158.90-157.90-157.10 |
| S2 |
|
|
156.50-156.00-155.20 |
| S3 |
|
|
154.50-154.00-153.00 |
| INTRADAY RESISTANCE LEVELS |
| R1 |
|
|
159.50-160.00-160.7 |
| R2 |
|
|
161.00-161.40-161.9 |
| R3 |
|
|
162.50 |
| TECHNICAL INDICATORS |
| Name |
|
Value |
Action |
| 14DRSI |
|
41.14 |
Buy |
| 20-DMA |
|
148.91 |
Buy |
| 50-DMA |
|
150.24 |
Buy |
| 100-DMA |
|
152.53 |
Buy |
| 200-DMA |
|
151.18 |
Buy |
| STOCH(9,6) |
|
93.662 |
Sell |
| MACD(12,26,9) |
|
0.683 |
Sell |
|
|
|
 |