 |
|
|
Daily Market Lookup
- Asian currencies were largely unchanged on Monday as the dollar hovered near multi-month lows, with investors weighing U.S. Treasury bond buyback plans against renewed trade and geopolitical risks. The U.S. Treasury said last week it would at least double the size of its long-end Treasury buybacks to $4 billion per operation, seeking to improve liquidity and contain pressure on long-term yields. The move initially pushed yields lower but has done little to ease broader concerns over the U.S. bond market. U.S. federal debt has surpassed $40 trillion, while the federal deficit is approaching $1.8 trillion. Investors worry that heavy borrowing needs will require the market to absorb large amounts of Treasury supply, keeping upward pressure on long-term yields and raising the government's interest costs. Investors were also awaiting Nvidia's results and Federal Reserve Chair Kevin Warsh's speech at Jackson Hole later this week for fresh clues on the outlook for global risk appetite and U.S. interest rates. The dollar's weakness has provided support for regional currencies, although gains were limited by rising geopolitical risks and uncertainty over U.S. policy. The Japanese yen's USD/JPY pair edged down 0.1% to below 159 yen, with traders awaiting comments from Bank of Japan Deputy Governor Ryozo Himino for clues on monetary policy. The U.S. imposed 50% tariffs on $20 billion of Canadian goods after negotiations broke down, prompting Ottawa to announce dollar-for-dollar retaliatory tariffs from Sept. 8. Elsewhere in Asia, the Chinese yuan's onshore pair USD/CNY and the Indian rupee's USD/INR traded flat. Markets were also bracing for details of new U.S. sanctions on Iran. Treasury Secretary Scott Bessent was expected to provide details later on Monday, with investors focused on whether the measures could further restrict Iranian oil exports and tighten global energy supplies. Oil prices slipped more than $1 a barrel as traders took profits ahead of the sanctions announcement, although risks around the Strait of Hormuz remained a concern for energy markets and inflation-sensitive currencies.
- Gold prices held near a three-month high on Monday after surging more than 5% last week, as U.S. Treasury efforts to contain longer-term borrowing costs revived concerns over the dollar and the country’s fiscal position, strengthening demand for bullion as an alternative store of value. Gold has extended a powerful run after gaining more than 5% last week, its third consecutive weekly advance. The metal briefly traded above $4,620 an ounce on Monday, building on Friday’s 1.9% gain and remaining close to its highest level in three months. The latest leg higher has been closely linked to the U.S. Treasury’s surprise decision to ramp up purchases of longer-dated government debt. The move pushed bond yields and the dollar lower and has revived a trade in which investors favor hard assets such as gold when they become less confident in the long-term purchasing power of fiat currencies. Treasury Secretary Scott Bessent subsequently indicated that the government could expand the buyback program further and said the administration would soon unveil a fiscal initiative aimed at addressing the high cost of government borrowing. The concern is not simply about lower yields. Treasury intervention has raised questions about whether policymakers are increasingly willing to manage borrowing costs rather than allow the bond market to determine them freely. ANZ analysts said the Treasury’s intervention has also heightened concerns about the U.S. fiscal position. They noted that gold’s move above $4,500 was supported by expectations that the government would continue trying to keep longer-term yields under control, while pressure on the dollar encouraged investors to increase exposure to bullion. The backdrop has become more striking after U.S. government debt crossed $40 trillion for the first time, while the dollar has fallen to its lowest level in more than three months. Investor appetite for bullion has broadened alongside the Treasury-driven rally. Gold-backed ETFs recorded their largest single-day inflow since September 2025 and extended their streak of net inflows to five consecutive weeks, according to ANZ analysts. At the same time, geopolitical uncertainty continues to underpin demand for assets seen as stores of value. Gold has moved well beyond the $4,000-an-ounce level that served as a key support zone during the earlier correction, while central-bank purchases and renewed ETF demand have reinforced the recovery. The World Gold Council has also highlighted the importance of central-bank demand as geopolitical and inflation risks remain elevated.
- Oil prices slipped more than $1 a barrel on Monday as investors took profits ahead of an expected announcement from Washington about imposing more sanctions on Iran that may further disrupt supplies from the Middle East. Both contracts posted their second weekly gains last week, up more than 5%, as peace talks between the U.S. and Iran hit a stalemate, capping oil shipments through the Strait of Hormuz where a fifth of the world’s supply used to transit. U.S. Treasury Secretary Scott Bessent, set to hold a press conference at 2 p.m. EDT (1800 GMT) on Monday, has threatened to impose "the toughest sanctions in history" on Iran. President Donald Trump has also threatened to impose sanctions on Iran’s trading partners. Iran has condemned U.S. plans to announce new sanctions even as President Masoud Pezeshkian called for a diplomatic solution. Offers of Iranian crude to Chinese buyers have declined and prices have jumped as the U.S. blockade has cut Tehran’s shipments, according to trade sources. However, Iran has granted permission for a number of Iraqi oil tankers to pass through the Strait following repeated requests from Baghdad, Iran’s state news agency IRNA reported on Saturday. Some analysts are expecting the recovery in supplies from the Middle East to take even longer than expected as the U.S.-Iran conflict persists. "Crude (supply) is tightening. Recent weeks have seen one of the sharpest declines in oil-on-water, whilst onshore inventories are declining as well, including in China," said Morgan Stanley analysts in a note. "A reduction in supply is driving this, most notably from the Middle East where several data sources put aggregate exports back at March/April levels," they said, slowing their assumption for a recovery in Middle East supplies.
|
|
| Intraday RESISTANCE LEVELS |
| 24th August 2026 |
R1 |
R2 |
R3 |
| GOLD-XAU |
4640-4669-4680 |
4705-4720-4738 |
4751-4760-4775 |
| Silver-XAG |
69.10-69.50-70.20 |
71.00-71.40-71.80 |
72.40-73.00-73.50 |
| Crude Oil |
84.60-85.00-85.55 |
86.15-86.75 |
87.25-88.00 |
| EURO/USD |
1.1690-1.1720 |
1.1750-1.1795 |
1.1820-1.1850 |
| GBP/USD |
1.3640 |
1.3660-1.3690-1.3730 |
1.3770-1.3800 |
| USD/JPY |
158.90-159.50-160.00 |
160.7-161.00-161.40- |
161.9-162.50 |
| Intraday SUPPORTS LEVELS |
| 24th August 2026 |
S1 |
S2 |
S3 |
| GOLD-XAU |
4595-4570-4554 |
4530-4516-4504 |
4489-4460-4434-4410 |
| Silver-XAG |
68.45-68.00-67.15 |
66.50-66.00-65.40 |
64.60-64.10-63.70 |
| Crude Oil |
84.10-83.70-83.10 |
82.70-81.20-80.50 |
80.10-79.30-78.70 |
| EURO/USD |
1.1655-1.1627-1.1610 |
1.1588-1.1550 |
1.1510-1.1485-1.1465 |
| GBP/USD |
1.3590-1.3560-1.3530 |
1.3480-1.3450-1.3410 |
1.3350-1.3315-1.3290 |
| USD/JPY |
157.90-157.10 |
156.50-156.00-155.20 |
154.50-154.00-153.00 |
|
|
| Intra-Day Strategy (24th August 2026) |
| GOLD-XAU |
Sell on Strength |
| Silver-XAG |
Buy on Dips |
|
| Crude Oil |
Neutral to Sell |
| EUR/USD |
Neutral to Sell |
|
| GBP/USD |
Neutral to Buy |
| USD/JPY |
Neutral to Sell |
|
|
|
|
Gold – XAU
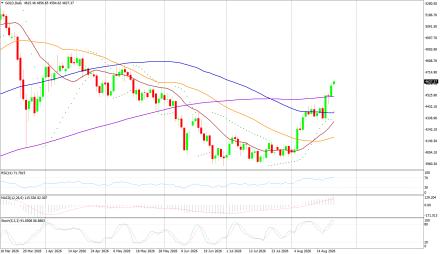
Gold on Friday interaday high of US$4623.27/oz and low of $4508.74/oz. God is up by 1.889% at US$4602.92/oz.
Technicals in Focus:
On the daily charts, gold trades higher than 20DMA (2197). If it drops below this level, it could lead to 2,100. The MACD is currently above the zero line and the histograms are showing an increasing trend, indicating that there may be upward movement in the coming sessions. The RSI is currently at 83.04, which is in the overbought region, suggesting there may be selling pressure in the next 2 to 3 sessions. The Stochastic Oscillator is also in the overbought territory but has given a positive crossover, indicating a bullish stance for intraday trades, but rebound in expected in all the overbought indicators.
Trading Strategy: Sell on Strength
Sell below 4640-4770 keeping stop loss closing above 4770, targeting 4530-4516-4504-4489 and 4469-4434-4410-4389-4370. Buy in between 4600-4450 with risk below 4400 targeting 4640-4669-4680-4705-4720 and 4738-4751-4760-4775. |
|
| Intraday Support Levels |
| S1 |
|
|
4595-4570-4554 |
| S2 |
|
|
4530-4516-4504 |
| S3 |
|
|
4489-4460-4434-4410 |
| Intraday Resistance Levels |
| R1 |
|
|
4640-4669-4680 |
| R2 |
|
|
4705-4720-4738 |
| R3 |
|
|
4751-4760-4775 |
| Technical Indicators
|
| Name |
|
Value |
Action |
| 14DRSI |
|
52.916 |
Buy |
| 20-DMA |
|
4800.67 |
Buy |
| 50-DMA |
|
4497.76 |
Buy |
| 100-DMA |
|
4239.36 |
Buy |
| 200-DMA |
|
3800.35 |
Buy |
| STOCH(5,3) |
|
26.933 |
Sell |
| MACD(12,26,9) |
|
150.924 |
Buy |
|
|
|
|
Silver - XAG
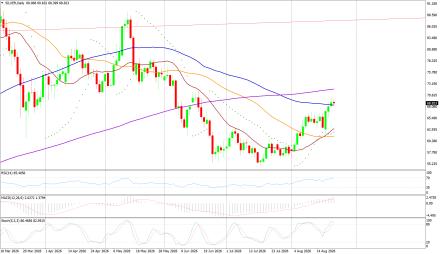
Silver on Monday its intraday high of US$70.00/oz and low of US$67.88/oz settle up by 1.15% at US$68.95/oz.
Technicals in Focus:
On daily charts, silver is sustaining above 20MA (25.05), breakage above will lead to 23.73. MACD is below the zero line and histograms are increasing trend, bringing a bullish stance in the upcoming sessions. RSI is in the oversold region, indicating a sell signal for now. The Stochastic Oscillator is in the overbought region and gives a positive crossover to show an upside move for the intraday trade.
Trading Strategy: Buy on Dips
Buy in between 68.45-63.00 targeting 69.10-69.50-69.90-71.00-71.40 and 71.80-72.40-73.00 with stop loss should be placed on the breakage below 63.00.
Sell in between 67.40-71.45 with a stop loss above 72.00 targeting 66.50-66.00-65.50-65.00-64.60 and 64.00-63.25-62.60-62.30-61.70. |
|
| Intraday Support Levels |
| S1 |
|
|
68.45-68.00-67.15 |
| S2 |
|
|
66.50-66.00-65.40 |
| S3 |
|
|
64.60-64.10-63.70 |
| Intraday Resistance Levels |
| R1 |
|
|
69.10-69.50-70.20 |
| R2 |
|
|
71.00-71.40-71.80 |
| R3 |
|
|
72.40-73.00-73.50 |
| TECHNICAL INDICATORS |
| Name |
|
Value |
Action |
| 14DRSI |
|
46.1562 |
Buy |
| 20-DMA |
|
92.99 |
Sell |
| 50-DMA |
|
75.81 |
Sell |
| 100-DMA |
|
62.03 |
Sell |
| 200-DMA |
|
49.29 |
Sell |
| STOCH(5,3) |
|
21.094 |
Buy |
| MACD(12,26,9) |
|
5.262 |
Buy |
|
|
|
|
Oil - WTI
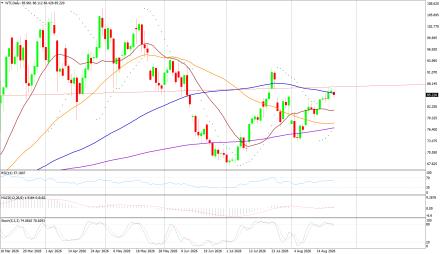
Crude Oil on Monday high of US$87.10/bbl, an intraday low of US$85.45/bbl, and settled up by 0.436% to close at US$86.27/bbl.
Technicals in Focus:
On daily charts, oil is sustaining above its 100DMA i.e. 75.37, a support level, and breakage above will call for 77.48. MACD is above the zero line and histograms are in increasing mode will bring a bullish stance in the upcoming sessions. The Stochastic Oscillator is in the overbought region, giving a negative crossover to confirm a bearish stance; while the RSI is in the neutral region, more upsides can be expected to reach the overbought region, which is highly probable.
Trading Strategy: Neutral to Sell
Sell in between 84.60-90.50 with stop loss at 91.00 targeting 84.10-83.7081.20-80.70-80.10-79.30 and 78.70-78.25-77.50-77.00-76.00-75.40.
Buy above 84.10-75.00 with risk daily closing below 75.00, targeting 84.60-85.00-85.55-86.00 and 86.75-87.25-88.00. |
|
| Intraday Support Levels |
| S1 |
|
|
84.10-83.70-83.10 |
| S2 |
|
|
82.70-81.20-80.50 |
| S3 |
|
|
80.10-79.30-78.70 |
| Intraday Resistance Levels |
| R1 |
|
|
84.60-85.00-85.55 |
| R2 |
|
|
86.15-86.75 |
| R3 |
|
|
87.25-88.00 |
| TECHNICAL INDICATORS |
| Name |
|
Value |
Action |
| 14DRSI |
|
29.346 |
Sell |
| 20-DMA |
|
67.35 |
Sell |
| 50-DMA |
|
69.06 |
Sell |
| 100-DMA |
|
70.28 |
Sell |
| 200-DMA |
|
71.85 |
Sell |
| STOCH(5,3) |
|
16.166 |
Sell |
| MACD(12,26,9) |
|
-1.306 |
Buy |
|
|
|
|
EUR/USD
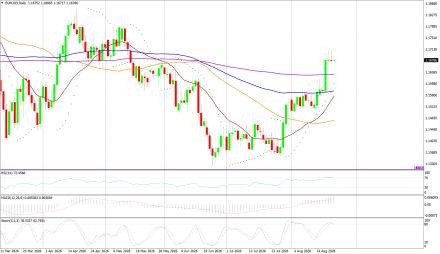
EUR/USD on Monday made an intraday low of US$1.1668/EUR, a high of US$1.1710/EUR, and settled down by 0.0214% to close at US$1.1674/EUR.
Technicals in Focus:
On daily charts, prices are sustaining above 100DMA (1.1661), which becomes immediate support, a break below will target 1.1695. MACD is above the zero line and histograms are increasing mode, bringing a bullish view. Stochastic is in oversold territory, giving negative crossovers to the bullish outlook for intraday. 14D RSI is currently in a neutral region and giving no directions to consider right now.
Trading Strategy: Neutral to Sell
Sell below 1.1690-1.1850, targeting 1.1655-1.1627-1.1610-1.1588 and 1.1550-1.1485-1.1465-1.1440-1.1405 with stop-loss at daily closing above 1.1850.
Buy above 1.1650-1.1250 with risk below 1.1250 targeting 1.1690-1.1720-1.1750 and 1.1795-1.1820-1.1850. |
|
| Intraday Support Levels |
| S1 |
|
|
1.1655-1.1627-1.1610 |
| S2 |
|
|
1.1588-1.1550 |
| S3 |
|
|
1.1510-1.1485-1.1465 |
| Intraday Resistance Levels |
| R1 |
|
|
1.1690-1.1720 |
| R2 |
|
|
1.1750-1.1795 |
| R3 |
|
|
1.1820-1.1850 |
| TECHNICAL INDICATORS |
| Name |
|
Value |
Action |
| 14DRSI |
|
48.897 |
Buy |
| 20-DMA |
|
1.1695 |
Sell |
| 50-DMA |
|
1.1656 |
Buy |
| 100-DMA |
|
1.1661 |
Buy |
| 200-DMA |
|
1.1585 |
Buy |
| STOCH(5,3) |
|
55.688 |
Buy |
| MACD(12,26,9) |
|
-0.0013 |
|
|
|
|
|
GBP/USD
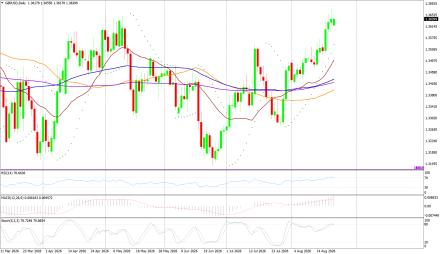
GBP/USD on Monday made a intraday low of US$1.3617/GBP, a high of US$1.3674/GBP, and settled the day up by 0.0851% to close at US$1.3639/GBP.
Technicals in Focus:
On daily charts, prices are sustaining above 50DMA (1.2674) is becoming a support level. 14-D RSI is currently in a neutral region and direction is difficult to predict on an RSI basis. The Stochastic Oscillator is in oversold territory and gives a positive crossover to confirm a bullish stance. MACD is above the zero line, but histograms are increasing leading to movement.
Trading Strategy: Neutral to Buy
Based on the charts and explanations above; buy between 1.3530-1.3079 with a target of 1.3410-1.3350-1.3410-1.3440-1.3490-1.3520-1.3540-1.3570 and 1.3600-1.3640-1.3690 with a stop loss closing below 1.3150.
Sell in between 1.3560-1.3820 with targets at 1.3300-1.3270-1.3190 and 1.3150-1.3135-1.3120-1.3100 with a stop loss of 1.3900. |
|
| Intraday Support Levels |
| S1 |
|
|
1.3590-1.3560-1.3530 |
| S2 |
|
|
1.3480-1.3450-1.3410 |
| S3 |
|
|
1.3350-1.3315-1.3290 |
| Intraday Resistance Levels |
| R1 |
|
|
1.3640 |
| R2 |
|
|
1.3660-1.3690-1.3730 |
| R3 |
|
|
1.3770-1.3800 |
| TECHNICAL INDICATORS |
| Name |
|
Value |
Action |
| 14DRSI |
|
46.905 |
Buy |
| 20-DMA |
|
1.2932 |
Buy |
| 50-DMA |
|
1.2736 |
Buy |
| 100-DMA |
|
1.2629 |
Buy |
| 200-DMA |
|
1.2811 |
Buy |
| STOCH(5,3) |
|
9.458 |
Buy |
| MACD(12,26,9) |
|
-0.003 |
Sell |
|
|
|
|
USD/JPY
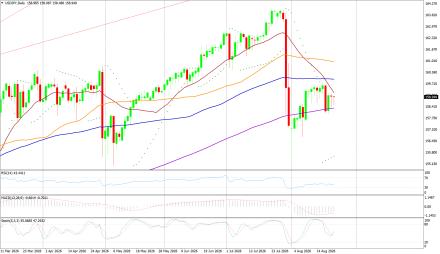
USD/JPY on Monday made an intra‐day low of JPY158.34/USD an intraday high of 159.12/USD, and settled the day down by 0.025% at JPY158.97/USD.
Technicals in Focus:
In daily charts, JPY is sustaining above 100DMA (152.35), major support on the daily chart. 14-D RSI is currently in the overbought region and chances of downward are expected based on RSI. MACD is above the zero line but histograms are decreasing mode which might lead to downward movement. The Stochastic Oscillator is in overbought territory and signaling to sell as it has given a negative crossover to confirm a bearish stance.
Trading Strategy: Neutral to Sell
Sell below 158.90-161.90 with risk above 162.00 targeting 157.00-156.50-156.00-155.20 and 154.50-154.00-153.00.
Long positions above 157.90-152.00 with targets of 158.40-161.00-161.40-162.40-163.00-163.50 and 164.00-164.60-165.00 with stops below 152.00. |
|
| Intraday Support Levels |
| S1 |
|
|
157.90-157.10 |
| S2 |
|
|
156.50-156.00-155.20 |
| S3 |
|
|
154.50-154.00-153.00 |
| INTRADAY RESISTANCE LEVELS |
| R1 |
|
|
158.90-159.50-160.00 |
| R2 |
|
|
160.7-161.00-161.40- |
| R3 |
|
|
161.9-162.50 |
| TECHNICAL INDICATORS |
| Name |
|
Value |
Action |
| 14DRSI |
|
41.14 |
Buy |
| 20-DMA |
|
148.91 |
Buy |
| 50-DMA |
|
150.24 |
Buy |
| 100-DMA |
|
152.53 |
Buy |
| 200-DMA |
|
151.18 |
Buy |
| STOCH(9,6) |
|
93.662 |
Sell |
| MACD(12,26,9) |
|
0.683 |
Sell |
|
|
|
 |