 |
|
|
Daily Market Lookup
- The U.S. dollar firmed on Wednesday after mixed July inflation data kept currency market participants on edge about the Federal Reserve’s interest rate path. Meanwhile, after a brief rebound in the previous session, the Canadian dollar resumed a slide amid elevated trade tensions between Washington and Ottawa. As per the Bureau of Economic Analysis (BEA), the core personal consumption expenditures (PCE) price index - widely seen as the Federal Reserve’s preferred inflation gauge - ticked up 0.2% M/M and 3.3% Y/Y in July, matching expectations. The M/M figure accelerated from June, while the Y/Y reading remained the same. The 3.3% annual rise is significantly above the Fed’s long-term target of 2%. On a headline basis, PCE increased 0.2% M/M and 3.7% Y/Y in July, just above expectations. Similar to core, the M/M number picked up from June, while the Y/Y measure was flat. Separately, the BEA’s second estimate of U.S. real gross domestic product growth for Q2 was unchanged at 1.5%, matching the consensus estimate. Elsewhere, the U.S. Census Bureau said new orders for manufactured durable goods in July improved 1.1%, better than the anticipated rise of 0.4%. With the cumulative data painting a picture of a resilient economy and sticky inflation, the Fed gains some more breathing room to keep interest rates steady while evaluating more incoming indicators. The CME FedWatch tool reflected this, with the odds of the central bank standing pat in September rising to nearly 64% from about 60% a day ago. Rising inflation jitters due to elevated oil prices and concerns over the massive amount of debt being issued by mega-cap companies to fund their AI infrastructure spending led to a steep sell-off in longer-dated U.S. government debt last week. A surprise intervention move by the U.S. Treasury to cap rising yields had little effect after news that U.S. debt had crossed $40 trillion. Generally, climbing bond yields act like interest rate hikes as they drive up borrowing costs for consumers and businesses, which in turn tends to strengthen the dollar. But the U.S. debt news caused fiscal skepticism last week, and in such an environment investors look to move capital out of fiat currencies and into hard assets such as gold or cryptocurrency - a strategy known as the debasement trade. Indeed, the U.S. dollar index shed nearly 1% last week, while gold and crypto rallied. The focus now turns to Fed Chair Kevin Warsh’s upcoming keynote address at the annual Jackson Hole conference on Friday for more rate cues. Elsewhere, the Japanese yen weakened, with the USD/JPY pair last up 0.1% to 159.34. While losing roughly half of the gains it made against the dollar in the wake of a landmark joint intervention at the end of July, the yen has managed to stay below 160, seen as a key level for authorities in Tokyo. A Reuters survey earlier showed a clear majority of economists now expecting the Bank of Japan to raise its policy rate as early as September. The euro dipped 0.2% to $1.1651, as regional desks digested hawkish warnings from European Central Bank Executive Board member Isabel Schnabel, who stated that further rate hikes remain necessary despite a sharp drop in energy prices.
- Gold prices climbed on Thursday, moving back toward $4,650 an ounce as investors weighed the Federal Reserve's approach to sticky inflation ahead of Chair Kevin Warsh's first major speech at the Jackson Hole symposium. The decline followed the release of U.S. inflation data that showed price pressures remained well above the Federal Reserve's target. The data pushed the dollar higher and lifted Treasury yields, two moves that typically weigh on gold because the metal pays no interest and is priced in dollars. The Personal Consumption Expenditures price index rose 3.7% in the year through July, unchanged from June and slightly above economists' 3.6% forecast. Markets have responded by nudging up expectations for a September hike. The probability of at least a 25 basis point increase is now around 40%, up from about 36% before the data, while traders still expect rates to rise by year end. The latest inflation data also came with signs of resilience in the broader U.S. economy. Second quarter GDP growth was left unchanged at 1.5%, personal income rose 0.4% in July, while consumer spending was flat. The focus now shifts to Friday’s Jackson Hole speech from Warsh, his first major address as Fed chair. Investors want to know how he plans to respond to inflation that has remained above the Fed’s 2% goal for an extended period. Warsh is under pressure to provide greater clarity after moving away from traditional forward guidance since taking the job. Investors also want him to address the interaction between monetary policy and the bond market, particularly after the Treasury doubled its planned buybacks of longer dated debt. That theme has provided a counterweight to the rate pressure created by inflation. Gold remains about 14% higher this month, despite Wednesday’s setback, after the Treasury intervention gave the rally fresh momentum.
- Oil prices fell on Thursday, extending their decline into a fourth consecutive session as markets held out hopes for improving supplies from the Middle East. A report said Iran and Oman had reached an agreement on commercial shipping routes through the Strait of Hormuz, although Tehran warned that an agreement may not entail an immediate reopening of the crossing. Brent and WTI futures were down over 6% each this week, as optimism over a potential Hormuz deal largely overshadowed continued U.S.-Iran ructions. The U.S. imposed stricter economic sanctions on Iran earlier this week, and also warned countries against conducting trade with Iran. But reports pointed to a potential improvement in U.S.-Iran relations. Russian state media reported that the two had reached a new ceasefire deal that would be announced in the coming days. Separately, Pakistan– a major regional mediator– also flagged progress in peace talks with Iran. Still, shipping data showed flows through Hormuz remained at a fraction of pre-war levels. The channel supplied roughly 20% of the world’s crude prior to the conflict, and has become a flashpoint in the U.S.-Iran war. Iran accused the U.S. of obstructing an agreement with Oman to reopen Hormuz, local media reported on Wednesday. Both sides signaled they were close to an agreement, which could also bar any military vessels from Hormuz, Iranian media reported this week. Oil’s losses this week came even as a report said Russia was planning to escalate attacks on Ukraine after concluding that negotiations had largely fallen flat. Russia is considering increased ballistic missile attacks on Kyiv and other infrastructure targets. Such a move plans to increase supply disruptions for Russia, especially given that Ukraine has retaliated against Russian aggression by attacking Moscow’s energy and oil refining infrastructure. U.S. media outlets said U.S. CIA Director John Ratcliffe had travelled to Moscow this week to meet with Russian officials. But it was not immediately clear what the agenda of the meeting was.
|
|
| Intraday RESISTANCE LEVELS |
| 27th August 2026 |
R1 |
R2 |
R3 |
| GOLD-XAU |
4640-4669-4680 |
4705-4720-4738 |
4751-4760-4775 |
| Silver-XAG |
69.10-69.50-70.20 |
71.00-71.40-71.90 |
72.25-73.00 |
| Crude Oil |
82.00-82.70 |
83.10-83.70 |
84.60-85.00-85.55 |
| EURO/USD |
1.1690-1.1720 |
1.1750-1.1795 |
1.1820-1.1850 |
| GBP/USD |
1.3590-1.3640 |
1.3660-1.3690-1.3730 |
1.3770-1.3800 |
| USD/JPY |
159.50-160.00 |
160.7-161.00-161.40- |
161.9-162.50 |
| Intraday SUPPORTS LEVELS |
| 27th August 2026 |
S1 |
S2 |
S3 |
| GOLD-XAU |
4595-4570-4554 |
4530-4516-4504 |
4489-4460-4434-4410 |
| Silver-XAG |
68.45-68.00-67.50-67.15 |
66.50-66.00-65.40 |
64.60-64.10-63.70 |
| Crude Oil |
81.20-80.50-80.10 |
79.30-78.70-78.40 |
77.90-77.00-76.10 |
| EURO/USD |
1.1655-1.1627-1.1610 |
1.1588-1.1550 |
1.1510-1.1485-1.1465 |
| GBP/USD |
1.3560-1.3530 |
1.3480-1.3450-1.3410 |
1.3350-1.3315-1.3290 |
| USD/JPY |
158.90-158.50-157.90-157.10 |
156.50-156.00-155.20 |
154.50-154.00-153.00 |
|
|
| Intra-Day Strategy (27th August 2026) |
| GOLD-XAU |
Sell on Strength |
| Silver-XAG |
Buy on Dips |
|
| Crude Oil |
Neutral to Sell |
| EUR/USD |
Neutral to Sell |
|
| GBP/USD |
Neutral to Buy |
| USD/JPY |
Neutral to Sell |
|
|
|
|
Gold – XAU
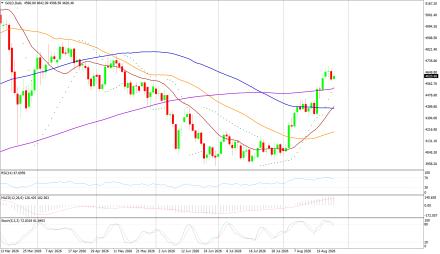
Gold on Wednesday interaday high of US$4673.66/oz and low of $4582.89/oz. God is up by 1.315% at US$4594.15/oz.
Technicals in Focus:
On the daily charts, gold trades higher than 20DMA (2197). If it drops below this level, it could lead to 2,100. The MACD is currently above the zero line and the histograms are showing an increasing trend, indicating that there may be upward movement in the coming sessions. The RSI is currently at 83.04, which is in the overbought region, suggesting there may be selling pressure in the next 2 to 3 sessions. The Stochastic Oscillator is also in the overbought territory but has given a positive crossover, indicating a bullish stance for intraday trades, but rebound in expected in all the overbought indicators.
Trading Strategy: Sell on Strength
Sell below 4640-4770 keeping stop loss closing above 4770, targeting 4530-4516-4504-4489 and 4469-4434-4410-4389-4370. Buy in between 4600-4450 with risk below 4400 targeting 4640-4669-4680-4705-4720 and 4738-4751-4760-4775.
|
|
| Intraday Support Levels |
| S1 |
|
|
4595-4570-4554 |
| S2 |
|
|
4530-4516-4504 |
| S3 |
|
|
4489-4460-4434-4410 |
| Intraday Resistance Levels |
| R1 |
|
|
4640-4669-4680 |
| R2 |
|
|
4705-4720-4738 |
| R3 |
|
|
4751-4760-4775 |
| Technical Indicators
|
| Name |
|
Value |
Action |
| 14DRSI |
|
52.916 |
Buy |
| 20-DMA |
|
4800.67 |
Buy |
| 50-DMA |
|
4497.76 |
Buy |
| 100-DMA |
|
4239.36 |
Buy |
| 200-DMA |
|
3800.35 |
Buy |
| STOCH(5,3) |
|
26.933 |
Sell |
| MACD(12,26,9) |
|
150.924 |
Buy |
|
|
|
|
Silver - XAG
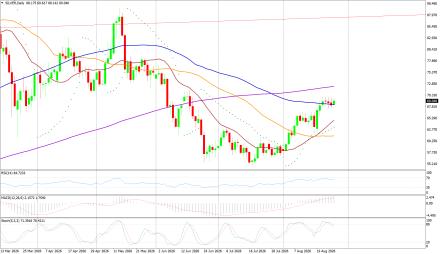
Silver on Wednesday its intraday high of US$69.72/oz and low of US$67.49/oz settle down by 0.837% at US$68.08/oz.
Technicals in Focus:
On daily charts, silver is sustaining above 20MA (25.05), breakage above will lead to 23.73. MACD is below the zero line and histograms are increasing trend, bringing a bullish stance in the upcoming sessions. RSI is in the oversold region, indicating a sell signal for now. The Stochastic Oscillator is in the overbought region and gives a positive crossover to show an upside move for the intraday trade.
Trading Strategy: Buy on Dips
Buy in between 68.45-63.00 targeting 69.10-69.50-69.90-71.00-71.40 and 71.80-72.40-73.00 with stop loss should be placed on the breakage below 63.00.
Sell in between 69.00-71.45 with a stop loss above 72.00 targeting 68.45-67.50-67.15-66.50-66.00 and 65.50-65.00-64.60-64.00-63.25. |
|
| Intraday Support Levels |
| S1 |
|
|
68.45-68.00-67.50-67.15 |
| S2 |
|
|
66.50-66.00-65.40 |
| S3 |
|
|
64.60-64.10-63.70 |
| Intraday Resistance Levels |
| R1 |
|
|
69.10-69.50-70.20 |
| R2 |
|
|
71.00-71.40-71.90 |
| R3 |
|
|
72.25-73.00 |
| TECHNICAL INDICATORS |
| Name |
|
Value |
Action |
| 14DRSI |
|
64.613 |
Buy |
| 20-DMA |
|
64.74 |
Buy |
| 50-DMA |
|
61.35 |
Buy |
| 100-DMA |
|
68.21 |
Buy |
| 200-DMA |
|
72.25 |
Sell |
| STOCH(5,3) |
|
70.939 |
Buy |
| MACD(12,26,9) |
|
2.150 |
Buy |
|
|
|
|
Oil - WTI
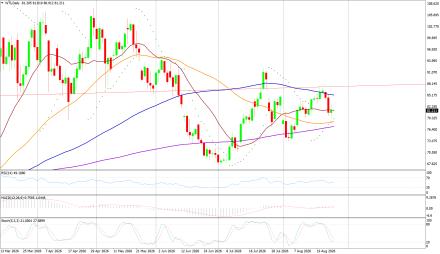
Crude Oil on Wednesday high of US$82.80/bbl, an intraday low of US$79.25/bbl, and settled dwon by 0.937% to close at US$81.40/bbl.
Technicals in Focus:
On daily charts, oil is sustaining above its 100DMA i.e. 75.37, a support level, and breakage above will call for 77.48. MACD is above the zero line and histograms are in increasing mode will bring a bullish stance in the upcoming sessions. The Stochastic Oscillator is in the overbought region, giving a negative crossover to confirm a bearish stance; while the RSI is in the neutral region, more upsides can be expected to reach the overbought region, which is highly probable.
Trading Strategy: Neutral to Sell
Sell in between 82.00-90.50 with stop loss at 91.00 targeting 80.10-79.30 and 78.70-78.25-77.50-77.00-76.00-75.40.
Buy above 81.20-75.00 with risk daily closing below 75.00, targeting 81.20-82.00-82.70-84.60-85.00 and 85.55-86.0086.75-87.25 |
|
| Intraday Support Levels |
| S1 |
|
|
81.20-80.50-80.10 |
| S2 |
|
|
79.30-78.70-78.40 |
| S3 |
|
|
77.90-77.00-76.10 |
| Intraday Resistance Levels |
| R1 |
|
|
82.00-82.70 |
| R2 |
|
|
83.10-83.70 |
| R3 |
|
|
84.60-85.00-85.55 |
| TECHNICAL INDICATORS |
| Name |
|
Value |
Action |
| 14DRSI |
|
29.346 |
Sell |
| 20-DMA |
|
67.35 |
Sell |
| 50-DMA |
|
69.06 |
Sell |
| 100-DMA |
|
70.28 |
Sell |
| 200-DMA |
|
71.85 |
Sell |
| STOCH(5,3) |
|
16.166 |
Sell |
| MACD(12,26,9) |
|
-1.306 |
Buy |
|
|
|
|
EUR/USD
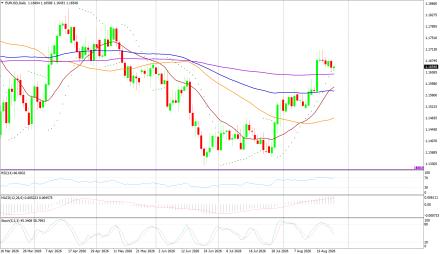
EUR/USD on Wednesday made an intraday low of US$1.1641/EUR, a high of US$1.1676/EUR, and settled down by 0.185% to close at US$1.1651/EUR.
Technicals in Focus:
On daily charts, prices are sustaining above 100DMA (1.1661), which becomes immediate support, a break below will target 1.1695. MACD is above the zero line and histograms are increasing mode, bringing a bullish view. Stochastic is in oversold territory, giving negative crossovers to the bullish outlook for intraday. 14D RSI is currently in a neutral region and giving no directions to consider right now.
Trading Strategy: Neutral to Sell
Sell below 1.1690-1.1850, targeting 1.1655-1.1627-1.1610-1.1588 and 1.1550-1.1485-1.1465-1.1440-1.1405 with stop-loss at daily closing above 1.1850.
Buy above 1.1650-1.1250 with risk below 1.1250 targeting 1.1690-1.1720-1.1750 and 1.1795-1.1820-1.1850. |
|
| Intraday Support Levels |
| S1 |
|
|
1.1655-1.1627-1.1610 |
| S2 |
|
|
1.1588-1.1550 |
| S3 |
|
|
1.1510-1.1485-1.1465 |
| Intraday Resistance Levels |
| R1 |
|
|
1.1690-1.1720 |
| R2 |
|
|
1.1750-1.1795 |
| R3 |
|
|
1.1820-1.1850 |
| TECHNICAL INDICATORS |
| Name |
|
Value |
Action |
| 14DRSI |
|
48.897 |
Buy |
| 20-DMA |
|
1.1695 |
Sell |
| 50-DMA |
|
1.1656 |
Buy |
| 100-DMA |
|
1.1661 |
Buy |
| 200-DMA |
|
1.1585 |
Buy |
| STOCH(5,3) |
|
55.688 |
Buy |
| MACD(12,26,9) |
|
-0.0013 |
|
|
|
|
|
GBP/USD
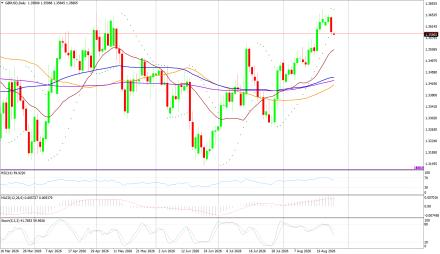
GBP/USD on Wednesday made a intraday low of US$1.3582/GBP, a high of US$1.3648/GBP, and settled the day down by 0.364% to close at US$1.3595/GBP.
Technicals in Focus:
On daily charts, prices are sustaining above 50DMA (1.2674) is becoming a support level. 14-D RSI is currently in a neutral region and direction is difficult to predict on an RSI basis. The Stochastic Oscillator is in oversold territory and gives a positive crossover to confirm a bullish stance. MACD is above the zero line, but histograms are increasing leading to movement.
Trading Strategy: Neutral to Buy
Based on the charts and explanations above; buy between 1.3590-1.3079 with a target of 1.3630-1.3660-1.3690 and 1.3730-1.3770-1.3800 with a stop loss closing below 1.3100.
Sell in between 1.3640-1.3820 with targets at 1.3590-1.3560-1.3530-1.3480-1.3450 and 1.3410-1.3350-1.3300-1.3270 with a stop loss of 1.3900. |
|
| Intraday Support Levels |
| S1 |
|
|
1.3560-1.3530 |
| S2 |
|
|
1.3480-1.3450-1.3410 |
| S3 |
|
|
1.3350-1.3315-1.3290 |
| Intraday Resistance Levels |
| R1 |
|
|
1.3590-1.3640 |
| R2 |
|
|
1.3660-1.3690-1.3730 |
| R3 |
|
|
1.3770-1.3800 |
| TECHNICAL INDICATORS |
| Name |
|
Value |
Action |
| 14DRSI |
|
46.905 |
Buy |
| 20-DMA |
|
1.2932 |
Buy |
| 50-DMA |
|
1.2736 |
Buy |
| 100-DMA |
|
1.2629 |
Buy |
| 200-DMA |
|
1.2811 |
Buy |
| STOCH(5,3) |
|
9.458 |
Buy |
| MACD(12,26,9) |
|
-0.003 |
Sell |
|
|
|
|
USD/JPY
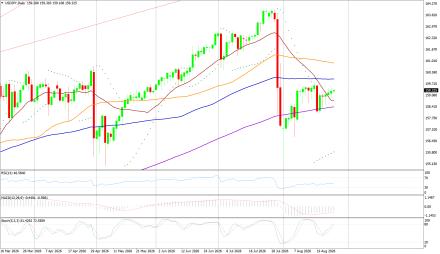
USD/JPY on Wednesday made an intra‐day low of JPY158.87/USD an intraday high of JPY159.43/USD, and settled the day up by 0.0785% at JPY159.27/USD.
Technicals in Focus:
In daily charts, JPY is sustaining above 100DMA (152.35), major support on the daily chart. 14-D RSI is currently in the overbought region and chances of downward are expected based on RSI. MACD is above the zero line but histograms are decreasing mode which might lead to downward movement. The Stochastic Oscillator is in overbought territory and signaling to sell as it has given a negative crossover to confirm a bearish stance.
Trading Strategy: Neutral to Sell
Sell below 159.50-161.90 with risk above 162.00 targeting 157.00-156.50-156.00-155.20 and 154.50-154.00-153.00.
Long positions above 158.90-152.00 with targets of 159.40-160.00-161.00-161.40-162.40-163.00-163.50 and 164.00-164.60-165.00 with stops below 152.00. |
|
| Intraday Support Levels |
| S1 |
|
|
158.90-158.50-157.90-157.10 |
| S2 |
|
|
156.50-156.00-155.20 |
| S3 |
|
|
154.50-154.00-153.00 |
| INTRADAY RESISTANCE LEVELS |
| R1 |
|
|
159.50-160.00 |
| R2 |
|
|
160.7-161.00-161.40- |
| R3 |
|
|
161.9-162.50 |
| TECHNICAL INDICATORS |
| Name |
|
Value |
Action |
| 14DRSI |
|
41.14 |
Buy |
| 20-DMA |
|
148.91 |
Buy |
| 50-DMA |
|
150.24 |
Buy |
| 100-DMA |
|
152.53 |
Buy |
| 200-DMA |
|
151.18 |
Buy |
| STOCH(9,6) |
|
93.662 |
Sell |
| MACD(12,26,9) |
|
0.683 |
Sell |
|
|
|
 |