 |
|
|
Daily Market Lookup
- The U.S. dollar on Friday hit a near two-week high after Federal Reserve Chair Kevin Warsh’s first keynote address at the Jackson Hole conference was perceived as hawkish. Traders added to their expectations of a central bank rate hike in September after Warsh said underlying inflation trends had not "meaningfully improved." The greenback was also set for a weekly rise of about 1%, wiping out all the losses from the previous week that was sparked by the so-called debasement trade amid a steep sell-off in U.S. Treasury bonds. The Fed’s chief’s much-awaited keynote address at the annual Jackson Hole Economic Policy Symposium saw him touch upon topics ranging from artificial intelligence to forward guidance to a summary of current economic conditions. Notably, he said underlying inflation trends in the U.S. had not "meaningfully improved" and reasserted that the central bank’s focus should be on delivering price stability. Warsh’s speech came at a complicated time for the Fed. Sticky inflation data recently, elevated oil prices amid a seemingly never-ending conflict between the U.S. and Iran, and a surprisingly weak read on nonfarm payrolls have led to ructions in the Federal Open Market Committee (FOMC), with three regional presidents dissenting with July’s move to hold interest rates steady. The keynote address was perceived as hawkish, with traders raising their expectations for a quarter-point hike by the FOMC in September. As per the CME FedWatch tool, the odds of such a hike now stood at more than 57%, up from about 35% the previous day. Meanwhile, U.S. Treasury yields turned higher after Warsh’s speech, as bonds were dumped. The benchmark 10-year yield was last up 5.9 basis points to 4.729%, while the more rate-sensitive 2-year yield climbed 12 basis points to 4.352%. The bond market has been on a roller coaster recently, with longer-term maturities gripped in a sell-off driven by inflation jitters, corporate debt issuance concerns, and worries over the ballooning U.S. national debt. A surprise intervention move by the Treasury Department last week has had little effect to cap yields. Generally, climbing bond yields act like interest rate hikes as they drive up borrowing costs for consumers and businesses, which in turn tends to strengthen the dollar. But news that U.S. debt had crossed $40 trillion caused fiscal skepticism last week, and in such an environment investors looked to move capital out of fiat currencies and into hard assets such as gold or cryptocurrency - a strategy known as the debasement trade. Indeed, the U.S. dollar index shed nearly 1% last week, while gold and crypto rallied. The latter two had advanced this week as well, but the gains were much smaller amid the strengthening dollar.
Turning to other major currencies, the Canadian dollar grabbed the attention of foreign exchange traders this week, down 1% amid an escalating trade war between Washington and Ottawa. Following the collapse of negotiations between the two last weekend, both sides have levied tit-for-tat tariffs against each other. President Donald Trump on Thursday moved to rename Lake Ontario to Lake America. Canadian government data on Friday showed the North American nation’s economy rebounded sharply in the second quarter, expanding at an annualized rate of 3.3% and picking up significantly from the first quarter’s upwardly revised growth of 0.3%. The increase was in-line with economists’ expectations but was well above the Bank of Canada’s forecast of around 2.5%. On the other hand, the South Korean won firmed against the dollar for a second straight day, with the USD/KRW pair on track for a weekly loss of 0.5%. The won has strengthened as investors digested the Bank of Korea’s decision on Thursday to raise interest rates for a second straight meeting, lifting borrowing costs to an 18-month high.
- Gold prices reversed early gains to fall on Monday, as investors reassessed the Federal Reserve’s rate outlook following Chair Kevin Warsh’s hawkish inflation message. Rising oil prices added to concerns, although the broader fiscal backdrop behind gold’s August rally offered some support. Despite Friday’s selloff, gold remains about 10% higher in August and is heading for its strongest monthly gain since January. Gold fell 3.2% on Friday, its biggest daily decline since early June, after Warsh said the Federal Reserve still has work to do to bring inflation back to its 2% target. His comments pushed investors to raise expectations for another rate increase, with markets now pricing roughly a 57% probability of a September hike, according to CME’s Fedwatch tool. That shift is weighing on bullion because gold does not pay interest. When traders expect rates to remain higher, interest bearing assets such as government bonds become relatively more attractive. The stronger dollar that followed Warsh’s remarks also tends to pressure gold because the metal becomes more expensive for buyers using other currencies. The pressure is also coming from energy markets. Brent crude rose to around $89.38 a barrel on Monday and U.S. crude reached $84.50, after U.S. forces struck Iranian launchers on Larak Island on Sunday. Iran then attacked U.S. forces stationed in Jordan, according to reports, adding to concerns that the conflict could intensify and keep energy prices elevated. Gold’s August rally gained fresh momentum earlier this month after the U.S. Treasury unexpectedly increased its purchases of longer dated government bonds. The intervention pushed yields lower and weighed on the dollar, while also reviving concerns that rising government debt and efforts to manage borrowing costs could weaken confidence in U.S. assets.
- That has brought the debasement trade back into focus. The theme helped drive gold’s roughly 65% rally in 2025, as investors used bullion as a hedge against the risk of widening budget deficits, currency depreciation and declining purchasing power. ANZ now sees the recent hawkish shift in monetary policy as a risk to that demand, but argues the fiscal and currency concerns that underpin the debasement trade remain in place.
|
|
| Intraday RESISTANCE LEVELS |
| 31st August 2026 |
R1 |
R2 |
R3 |
| GOLD-XAU |
4428-4460-4489 |
4516-4530-4554 |
4570-4595-4630- |
| Silver-XAG |
67.15-67.50-68.00-68.45 |
69.10-69.50-70.20 |
71.00-71.40-71.90 |
| Crude Oil |
85.55-86.10-86.60 |
87.00-87.35-88.00 |
88.40-89.00 |
| EURO/USD |
1.1610-1.1627-1.1655 |
1.1690-1.1720-1.1750 |
1.17951.1820-1.1850 |
| GBP/USD |
1.3560-1.3590-1.3640 |
1.3660-1.3690-1.3730 |
1.3770-1.3800 |
| USD/JPY |
159.50-160.00 |
160.7-161.00-161.40- |
161.9-162.50 |
| Intraday SUPPORTS LEVELS |
| 31st August 2026 |
S1 |
S2 |
S3 |
| GOLD-XAU |
4410-4390-4369 |
4340-4329-4301 |
4270-4241 |
| Silver-XAG |
66.50-66.00-65.40 |
64.60-64.10-63.87 |
63.50 |
| Crude Oil |
85.00-84.60-84.00 |
83.70-83.10-82.70 |
82.00-81.20-80.50-80.10 |
| EURO/USD |
1.15901.1570-1.1550 |
1.1510-1.1488-1.1465 |
1.1450 |
| GBP/USD |
1.3530 |
1.3480-1.3450-1.3410 |
1.3350-1.3315-1.3290 |
| USD/JPY |
158.90-158.50-157.90-157.10 |
156.50-156.00-155.20 |
154.50-154.00-153.00 |
|
|
| Intra-Day Strategy (31st August 2026) |
| GOLD-XAU |
Sell on Strength |
| Silver-XAG |
Buy on Dips |
|
| Crude Oil |
Neutral to Sell |
| EUR/USD |
Neutral to Sell |
|
| GBP/USD |
Neutral to Buy |
| USD/JPY |
Neutral to Sell |
|
|
|
|
Gold – XAU
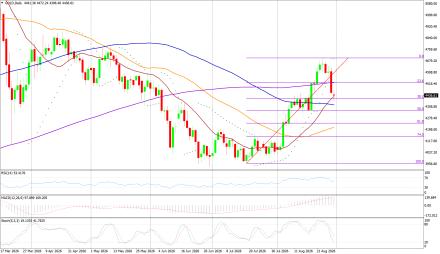
Gold on Thursday interaday high of US$4631.21/oz and low of $4454.58/oz. God is down by 3.236% at US$4454.58/oz.
Technicals in Focus:
On the daily charts, gold trades higher than 20DMA (2197). If it drops below this level, it could lead to 2,100. The MACD is currently above the zero line and the histograms are showing an increasing trend, indicating that there may be upward movement in the coming sessions. The RSI is currently at 83.04, which is in the overbought region, suggesting there may be selling pressure in the next 2 to 3 sessions. The Stochastic Oscillator is also in the overbought territory but has given a positive crossover, indicating a bullish stance for intraday trades, but rebound in expected in all the overbought indicators.
Trading Strategy: Sell on Strength
Sell below 4428-4770 keeping stop loss closing above 4700, targeting 4410-4389-4370-4340 and 4329-4301-4270-4241. Buy in between 4428-4240 with risk below 4240 targeting 4428-4460-4489-4516- and 4530-4554-4570-4595-4640-466.
|
|
| Intraday Support Levels |
| S1 |
|
|
4410-4390-4369 |
| S2 |
|
|
4340-4329-4301 |
| S3 |
|
|
4270-4241 |
| Intraday Resistance Levels |
| R1 |
|
|
4428-4460-4489 |
| R2 |
|
|
4516-4530-4554 |
| R3 |
|
|
4570-4595-4630- |
| Technical Indicators
|
| Name |
|
Value |
Action |
| 14DRSI |
|
52.916 |
Buy |
| 20-DMA |
|
4800.67 |
Buy |
| 50-DMA |
|
4497.76 |
Buy |
| 100-DMA |
|
4239.36 |
Buy |
| 200-DMA |
|
3800.35 |
Buy |
| STOCH(5,3) |
|
26.933 |
Sell |
| MACD(12,26,9) |
|
150.924 |
Buy |
|
|
|
|
Silver - XAG
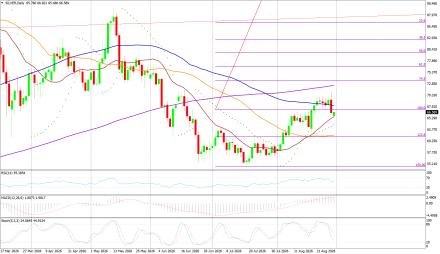
Silver on Friday its intraday high of US$71.16/oz and low of US$66.09/oz settle down by 4.19% at US$66.38/oz.
Technicals in Focus:
On daily charts, silver is sustaining above 20MA (25.05), breakage above will lead to 23.73. MACD is below the zero line and histograms are increasing trend, bringing a bullish stance in the upcoming sessions. RSI is in the oversold region, indicating a sell signal for now. The Stochastic Oscillator is in the overbought region and gives a positive crossover to show an upside move for the intraday trade.
Trading Strategy: Buy on Dips
Buy in between 66.50-63.00 targeting 69.10-69.50-69.90-71.00-71.40 and 71.80-72.40-73.00 with stop loss should be placed on the breakage below 63.00.
Sell in between 67.00-71.45 with a stop loss above 72.00 targeting 66.50-66.00 and 65.50-65.00-64.60-64.00-63.25.
|
|
| Intraday Support Levels |
| S1 |
|
|
66.50-66.00-65.40 |
| S2 |
|
|
64.60-64.10-63.87 |
| S3 |
|
|
63.50 |
| Intraday Resistance Levels |
| R1 |
|
|
67.15-67.50-68.00-68.45 |
| R2 |
|
|
69.10-69.50-70.20 |
| R3 |
|
|
71.00-71.40-71.90 |
| TECHNICAL INDICATORS |
| Name |
|
Value |
Action |
| 14DRSI |
|
64.613 |
Buy |
| 20-DMA |
|
64.74 |
Buy |
| 50-DMA |
|
61.35 |
Buy |
| 100-DMA |
|
68.21 |
Buy |
| 200-DMA |
|
72.25 |
Sell |
| STOCH(5,3) |
|
70.939 |
Buy |
| MACD(12,26,9) |
|
2.150 |
Buy |
|
|
|
|
Oil - WTI
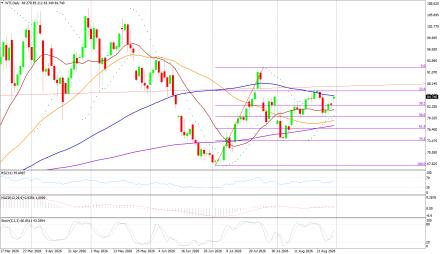
Crude Oil on Friday high of US$83.08/bbl, an intraday low of US$81.63/bbl, and settled down by 0.357% to close at US$82.72/bbl.
Technicals in Focus:
On daily charts, oil is sustaining above its 100DMA i.e. 75.37, a support level, and breakage above will call for 77.48. MACD is above the zero line and histograms are in increasing mode will bring a bullish stance in the upcoming sessions. The Stochastic Oscillator is in the overbought region, giving a negative crossover to confirm a bearish stance; while the RSI is in the neutral region, more upsides can be expected to reach the overbought region, which is highly probable.
Trading Strategy: Neutral to Sell
Sell in between 85.00-90.50 with stop loss at 91.00 targeting 85.00-84.60-84.00-83.70-83.10 and 82.70-82.00-81.20-80.50-80.10-79.30.
Buy above 81.20-75.00 with risk daily closing below 75.00, targeting 81.20-82.00-82.70-84.60-85.00 and 85.55-86.0086.75-87.25 |
|
| Intraday Support Levels |
| S1 |
|
|
85.00-84.60-84.00 |
| S2 |
|
|
83.70-83.10-82.70 |
| S3 |
|
|
82.00-81.20-80.50-80.10 |
| Intraday Resistance Levels |
| R1 |
|
|
85.55-86.10-86.60 |
| R2 |
|
|
87.00-87.35-88.00 |
| R3 |
|
|
88.40-89.00 |
| TECHNICAL INDICATORS |
| Name |
|
Value |
Action |
| 14DRSI |
|
29.346 |
Sell |
| 20-DMA |
|
67.35 |
Sell |
| 50-DMA |
|
69.06 |
Sell |
| 100-DMA |
|
70.28 |
Sell |
| 200-DMA |
|
71.85 |
Sell |
| STOCH(5,3) |
|
16.166 |
Sell |
| MACD(12,26,9) |
|
-1.306 |
Buy |
|
|
|
|
EUR/USD
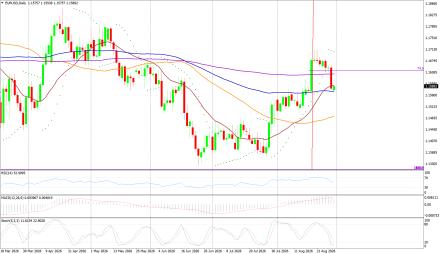
EUR/USD on Thursday made an intraday low of US$1.1577/EUR, a high of US$1.1658/EUR, and settled down by 0.593% to close at US$1.1581/EUR.
Technicals in Focus:
On daily charts, prices are sustaining above 100DMA (1.1661), which becomes immediate support, a break below will target 1.1695. MACD is above the zero line and histograms are increasing mode, bringing a bullish view. Stochastic is in oversold territory, giving negative crossovers to the bullish outlook for intraday. 14D RSI is currently in a neutral region and giving no directions to consider right now.
Trading Strategy: Neutral to Sell
Sell below 1.1690-1.1850, targeting 1.1655-1.1627-1.1610-1.1588 and 1.1550-1.1485-1.1465-1.1440-1.1405 with stop-loss at daily closing above 1.1850.
Buy above 1.1650-1.1250 with risk below 1.1250 targeting 1.1690-1.1720-1.1750 and 1.1795-1.1820-1.1850. |
|
| Intraday Support Levels |
| S1 |
|
|
1.15901.1570-1.1550 |
| S2 |
|
|
1.1510-1.1488-1.1465 |
| S3 |
|
|
1.1450 |
| Intraday Resistance Levels |
| R1 |
|
|
1.1610-1.1627-1.1655 |
| R2 |
|
|
1.1690-1.1720-1.1750 |
| R3 |
|
|
1.17951.1820-1.1850 |
| TECHNICAL INDICATORS |
| Name |
|
Value |
Action |
| 14DRSI |
|
48.897 |
Buy |
| 20-DMA |
|
1.1695 |
Sell |
| 50-DMA |
|
1.1656 |
Buy |
| 100-DMA |
|
1.1661 |
Buy |
| 200-DMA |
|
1.1585 |
Buy |
| STOCH(5,3) |
|
55.688 |
Buy |
| MACD(12,26,9) |
|
-0.0013 |
|
|
|
|
|
GBP/USD
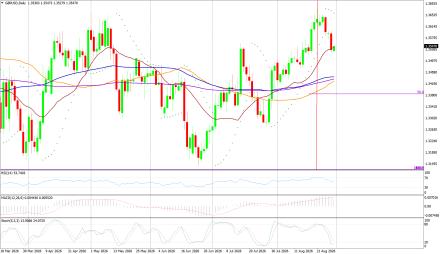
GBP/USD on Friday made a intraday low of US$1.3526/GBP, a high of US$1.3597/GBP, and settled the day down by 0.412% to close at US$1.3533/GBP.
Technicals in Focus:
On daily charts, prices are sustaining above 50DMA (1.2674) is becoming a support level. 14-D RSI is currently in a neutral region and direction is difficult to predict on an RSI basis. The Stochastic Oscillator is in oversold territory and gives a positive crossover to confirm a bullish stance. MACD is above the zero line, but histograms are increasing leading to movement.
Trading Strategy: Neutral to Buy
Based on the charts and explanations above; buy between 1.3530-1.3079 with a target of 1.3590-1.3630-1.3660-1.3690 and 1.3730-1.3770-1.3800 with a stop loss closing below 1.3100.
Sell in between 1.3560-1.3820 with targets at 1.3530-1.3480-1.3450 and 1.3410-1.3350-1.3300-1.3270 with a stop loss of 1.3900. |
|
| Intraday Support Levels |
| S1 |
|
|
1.3530 |
| S2 |
|
|
1.3480-1.3450-1.3410 |
| S3 |
|
|
1.3350-1.3315-1.3290 |
| Intraday Resistance Levels |
| R1 |
|
|
1.3560-1.3590-1.3640 |
| R2 |
|
|
1.3660-1.3690-1.3730 |
| R3 |
|
|
1.3770-1.3800 |
| TECHNICAL INDICATORS |
| Name |
|
Value |
Action |
| 14DRSI |
|
46.905 |
Buy |
| 20-DMA |
|
1.2932 |
Buy |
| 50-DMA |
|
1.2736 |
Buy |
| 100-DMA |
|
1.2629 |
Buy |
| 200-DMA |
|
1.2811 |
Buy |
| STOCH(5,3) |
|
9.458 |
Buy |
| MACD(12,26,9) |
|
-0.003 |
Sell |
|
|
|
|
USD/JPY
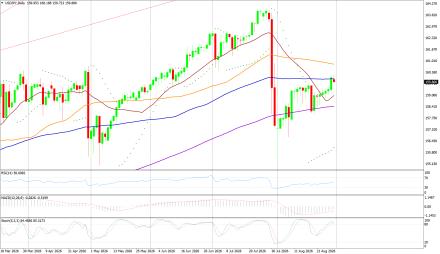
USD/JPY on Friday made an intra‐day low of JPY159.20/USD an intraday high of JPY160.19/USD, and settled the day up by 0.442% at JPY160.06/USD.
Technicals in Focus:
In daily charts, JPY is sustaining above 100DMA (152.35), major support on the daily chart. 14-D RSI is currently in the overbought region and chances of downward are expected based on RSI. MACD is above the zero line but histograms are decreasing mode which might lead to downward movement. The Stochastic Oscillator is in overbought territory and signaling to sell as it has given a negative crossover to confirm a bearish stance.
Trading Strategy: Neutral to Sell
Sell below 159.50-161.90 with risk above 162.00 targeting 157.00-156.50-156.00-155.20 and 154.50-154.00-153.00.
Long positions above 158.90-152.00 with targets of 159.40-160.00-161.00-161.40-162.40-163.00-163.50 and 164.00-164.60-165.00 with stops below 152.00. |
|
| Intraday Support Levels |
| S1 |
|
|
158.90-158.50-157.90-157.10 |
| S2 |
|
|
156.50-156.00-155.20 |
| S3 |
|
|
154.50-154.00-153.00 |
| INTRADAY RESISTANCE LEVELS |
| R1 |
|
|
159.50-160.00 |
| R2 |
|
|
160.7-161.00-161.40- |
| R3 |
|
|
161.9-162.50 |
| TECHNICAL INDICATORS |
| Name |
|
Value |
Action |
| 14DRSI |
|
41.14 |
Buy |
| 20-DMA |
|
148.91 |
Buy |
| 50-DMA |
|
150.24 |
Buy |
| 100-DMA |
|
152.53 |
Buy |
| 200-DMA |
|
151.18 |
Buy |
| STOCH(9,6) |
|
93.662 |
Sell |
| MACD(12,26,9) |
|
0.683 |
Sell |
|
|
|
 |