 |
|
|
Daily Market Lookup
- U.S. Treasury yields held near multi-week highs on Monday, with long-end borrowing costs extending their upward trajectory as bond investors digested Federal Reserve Chair Kevin Warsh’s hawkish Jackson Hole address and a sharp surge in crude oil prices. The benchmark 10-year Treasury yield inched up to 4.720%, rising for a third consecutive session as fixed-income desks re-priced the medium-term path for U.S. monetary policy. At the long end of the curve, the 30-year Treasury yield rose to 5.222%, touching its highest level in nearly a week. Meanwhile, policy-sensitive two-year Treasury yields eased slightly to 4.323%, taking a breather after logging on Friday its largest single-day yield jump since June 17, 2026, following Warsh’s explicit warnings on persistent price pressures. The primary driver underwriting the broader sell-off across sovereign debt hubs was Warsh’s inaugural speech at the Jackson Hole symposium on Friday, where he signaled that policymakers still "have work to do" if inflation fails to show convincing signs of returning to the central bank’s 2% target Fed funds futures now imply a nearly 60% probability of a 25-basis-point rate hike at the Fed’s Sept. 16 meeting - up sharply from roughly 35% prior to Warsh’s address. The hawkish recalibration in U.S. rates spilled over into European debt markets on Monday, pushing Germany’s policy-sensitive two-year Schatz yield to a multi-month high of 2.898%, the 10-year Bund yield to 3.2903% - its highest level since 2011 and the French 30-year yield at its highest since 2008. Trading desks are now looking to scheduled speeches by Fed Governors Michael Barr on Tuesday and Christopher Waller on Thursday to gauge whether Warsh’s hawkish tone commands broad consensus among voting member. Adding to fixed-income headwinds, a sudden flare-up in Persian Gulf hostilities sent global energy benchmarks surging on Monday, dismantling short-lived disinflationary relief and adding fresh cost-push inflation fears across debt markets. U.S. forces carried out air strikes targeting two Iranian rocket launchers on Larak Island in the Strait of Hormuz over the weekend, prompting retaliatory strikes on U.S. military positions in Jordan. The military exchange sent Brent crude futures jumping nearly 3% past $90.50 a barrel, threatening to prolong transit disruptions through the vital maritime conduit. The commodity shock comes at a delicate time for global central banks, with European debt desks also bracing for Eurozone CPI data later this week, which is expected to reinforce expectations for a 25-basis-point rate increase from the European Central Bank on Sept. 10. With yields holding at elevated levels, fixed-income allocators are turning their focus to a data-heavy U.S. economic calendar to confirm whether labor market conditions justify further monetary tightening. July JOLTS job openings data on Tuesday will offer insight into labor demand, followed by August ADP private payrolls on Wednesday. Friday’s nonfarm payrolls (NFP) report is expected to show a recovery in hiring following July’s contraction, providing the final major labor input before the September FOMC gathering.
- Gold prices steadied on Monday after falling more than 3.5% over the previous two sessions, as renewed U.S.-Iran strikes raised the risk of higher energy costs and added pressure on the Federal Reserve to keep interest rates elevated Gold's retreat has come as the U.S. and Iran exchanged strikes for the first time in a month, adding a new layer of uncertainty to energy markets. U.S. forces struck Iranian rocket launchers on an island in the Strait of Hormuz on Sunday, saying the weapons were being prepared to deploy mines in the strategic waterway. Iran subsequently attacked targets in the United Arab Emirates and Jordan. The latest strikes underline the continuing standoff between Washington and Tehran after more than six months of conflict. The Strait of Hormuz remains a key point of tension, with the conflict already disrupting global energy flows. Oil prices moved higher after posting their biggest gain in three weeks on Monday. Higher energy prices matter for gold because they can feed inflation, giving the Federal Reserve another reason to keep rates high or raise them further. That is a headwind for bullion because gold does not generate interest. When rates rise, investors can earn more from interest-bearing assets such as government bonds, increasing the opportunity cost of holding gold. Tony Sycamore, senior market analyst at IG, said the recent $300 decline from last week's high near $4,697 to Monday's low around $4,397 reflected the combination of Warsh's hawkish Jackson Hole speech and renewed tensions around Hormuz. Sycamore said that mix has pushed bond yields higher and left gold vulnerable ahead of the Fed's next meeting. The metal's August rally accelerated after the U.S. Treasury unexpectedly announced plans to increase purchases of longer-dated government debt. The intervention lowered borrowing costs and pushed the dollar lower, while also reviving concerns around the scale of U.S. sovereign debt and the potential for currency devaluation. Those concerns have brought the debasement trade back into focus, a theme that helped drive gold’s roughly 65% rally in 2025 as investors sought protection from rising government deficits and currency weakness. Investor demand has since broadened, with gold-backed ETFs posting their largest daily inflow since September 2025 and extending their run of net inflows to five straight weeks. However, the hawkish shift from the Fed has now interrupted that momentum. Gold also slipped back below its 200-day moving average, which stood near $4,526, causing some short-term technical damage. That has brought the debasement trade back into focus. The theme helped drive gold’s roughly 65% rally in 2025, as investors used bullion as a hedge against the risk of widening budget deficits, currency depreciation and declining purchasing power. ANZ now sees the recent hawkish shift in monetary policy as a risk to that demand, but argues the fiscal and currency concerns that underpin the debasement trade remain in place.
|
|
| Intraday RESISTANCE LEVELS |
| 1st September 2026 |
R1 |
R2 |
R3 |
| GOLD-XAU |
4460-4489 |
4516-4530-4554 |
4570-4595-4630- |
| Silver-XAG |
67.15-67.50-68.00-68.45 |
69.10-69.50-70.20 |
71.00-71.40-71.90 |
| Crude Oil |
86.10-86.60 |
87.00-87.35-88.00 |
88.40-89.00 |
| EURO/USD |
1.1610-1.1627-1.1655 |
1.1690-1.1720-1.1750 |
1.17951.1820-1.1850 |
| GBP/USD |
1.3560-1.3590-1.3640 |
1.3660-1.3690-1.3730 |
1.3770-1.3800 |
| USD/JPY |
160.00-160.77 |
161.00-161.40 |
161.90-162.50-162.90 |
| Intraday SUPPORTS LEVELS |
| 1st September 2026 |
S1 |
S2 |
S3 |
| GOLD-XAU |
4428-4410-4390-4369 |
4340-4329-4301 |
4270-4241 |
| Silver-XAG |
66.50-66.00-65.40 |
64.60-64.10-63.87 |
63.50 |
| Crude Oil |
85.55-85.00-84.60-84.00 |
83.70-83.10-82.70 |
82.00-81.20-80.50 |
| EURO/USD |
1.1590-1.1570-1.1550 |
1.1510-1.1488-1.1465 |
1.1450 |
| GBP/USD |
1.3530 |
1.3480-1.3450-1.3410 |
1.3350-1.3315-1.3290 |
| USD/JPY |
159.50-158.90-158.50 |
157.90-157.10-156.50 |
156.00-155.20-154.50 |
|
|
| Intra-Day Strategy (1st September 2026) |
| GOLD-XAU |
Sell on Strength |
| Silver-XAG |
Buy on Dips |
|
| Crude Oil |
Neutral to Sell |
| EUR/USD |
Neutral to Sell |
|
| GBP/USD |
Neutral to Buy |
| USD/JPY |
Neutral to Sell |
|
|
|
|
Gold – XAU
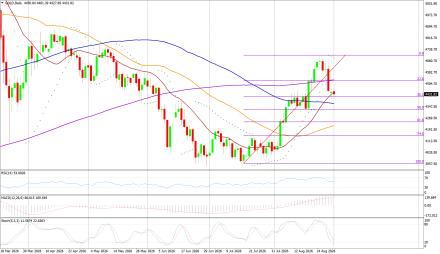
Gold on Monday interaday high of US$4472.24/oz and low of $4396.40/oz. God is up by 0.142% at US$4447.70/oz.
Technicals in Focus:
On the daily charts, gold trades higher than 20DMA (2197). If it drops below this level, it could lead to 2,100. The MACD is currently above the zero line and the histograms are showing an increasing trend, indicating that there may be upward movement in the coming sessions. The RSI is currently at 83.04, which is in the overbought region, suggesting there may be selling pressure in the next 2 to 3 sessions. The Stochastic Oscillator is also in the overbought territory but has given a positive crossover, indicating a bullish stance for intraday trades, but rebound in expected in all the overbought indicators.
Trading Strategy: Sell on Strength
Sell below 4428-4770 keeping stop loss closing above 4700, targeting 4410-4389-4370-4340 and 4329-4301-4270-4241. Buy in between 4428-4240 with risk below 4240 targeting 4428-4460-4489-4516- and 4530-4554-4570-4595-4640-466. |
|
| Intraday Support Levels |
| S1 |
|
|
4428-4410-4390-4369 |
| S2 |
|
|
4340-4329-4301 |
| S3 |
|
|
4270-4241 |
| Intraday Resistance Levels |
| R1 |
|
|
4460-4489 |
| R2 |
|
|
4516-4530-4554 |
| R3 |
|
|
4570-4595-4630- |
| Technical Indicators
|
| Name |
|
Value |
Action |
| 14DRSI |
|
52.916 |
Buy |
| 20-DMA |
|
4800.67 |
Buy |
| 50-DMA |
|
4497.76 |
Buy |
| 100-DMA |
|
4239.36 |
Buy |
| 200-DMA |
|
3800.35 |
Sell |
| STOCH(5,3) |
|
26.933 |
Sell |
| MACD(12,26,9) |
|
150.924 |
Buy |
|
|
|
|
Silver - XAG
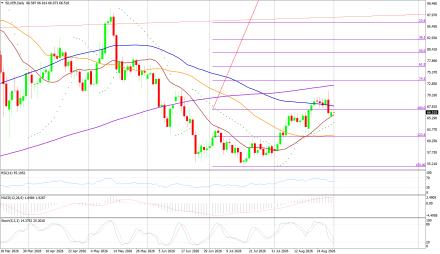
Silver on Monday its intraday high of US$67.45/oz and low of US$65.48/oz settle up by 1.157% at US$66.52/oz.
Technicals in Focus:
On daily charts, silver is sustaining above 20MA (25.05), breakage above will lead to 23.73. MACD is below the zero line and histograms are increasing trend, bringing a bullish stance in the upcoming sessions. RSI is in the oversold region, indicating a sell signal for now. The Stochastic Oscillator is in the overbought region and gives a positive crossover to show an upside move for the intraday trade.
Trading Strategy: Buy on Dips
Buy in between 66.50-63.00 targeting 69.10-69.50-69.90-71.00-71.40 and 71.80-72.40-73.00 with stop loss should be placed on the breakage below 63.00.
Sell in between 67.00-71.45 with a stop loss above 72.00 targeting 66.50-66.00 and 65.50-65.00-64.60-64.00-63.25. |
|
| Intraday Support Levels |
| S1 |
|
|
66.50-66.00-65.40 |
| S2 |
|
|
64.60-64.10-63.87 |
| S3 |
|
|
63.50 |
| Intraday Resistance Levels |
| R1 |
|
|
67.15-67.50-68.00-68.45 |
| R2 |
|
|
69.10-69.50-70.20 |
| R3 |
|
|
71.00-71.40-71.90 |
| TECHNICAL INDICATORS |
| Name |
|
Value |
Action |
| 14DRSI |
|
64.613 |
Buy |
| 20-DMA |
|
64.74 |
Buy |
| 50-DMA |
|
61.35 |
Buy |
| 100-DMA |
|
68.21 |
Buy |
| 200-DMA |
|
72.25 |
Sell |
| STOCH(5,3) |
|
70.939 |
Buy |
| MACD(12,26,9) |
|
2.150 |
Buy |
|
|
|
|
Oil - WTI
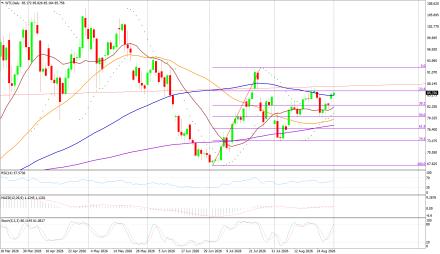
Crude Oil on Monday high of US$85.87/bbl, an intraday low of US$83.34/bbl, and settled up by 1.3099% to close at US$85.38/bbl.
Technicals in Focus:
On daily charts, oil is sustaining above its 100DMA i.e. 75.37, a support level, and breakage above will call for 77.48. MACD is above the zero line and histograms are in increasing mode will bring a bullish stance in the upcoming sessions. The Stochastic Oscillator is in the overbought region, giving a negative crossover to confirm a bearish stance; while the RSI is in the neutral region, more upsides can be expected to reach the overbought region, which is highly probable.
Trading Strategy: Neutral to Sell
Sell in between 85.00-90.50 with stop loss at 91.00 targeting 85.00-84.60-84.00-83.70-83.10 and 82.70-82.00-81.20-80.50-80.10-79.30.
Buy above 81.20-75.00 with risk daily closing below 75.00, targeting 81.20-82.00-82.70-84.60-85.00 and 85.55-86.0086.75-87.25 |
|
| Intraday Support Levels |
| S1 |
|
|
85.55-85.00-84.60-84.00 |
| S2 |
|
|
83.70-83.10-82.70 |
| S3 |
|
|
82.00-81.20-80.50 |
| Intraday Resistance Levels |
| R1 |
|
|
86.10-86.60 |
| R2 |
|
|
87.00-87.35-88.00 |
| R3 |
|
|
88.40-89.00 |
| TECHNICAL INDICATORS |
| Name |
|
Value |
Action |
| 14DRSI |
|
29.346 |
Sell |
| 20-DMA |
|
67.35 |
Sell |
| 50-DMA |
|
69.06 |
Sell |
| 100-DMA |
|
70.28 |
Sell |
| 200-DMA |
|
71.85 |
Sell |
| STOCH(5,3) |
|
16.166 |
Sell |
| MACD(12,26,9) |
|
-1.306 |
Buy |
|
|
|
|
EUR/USD
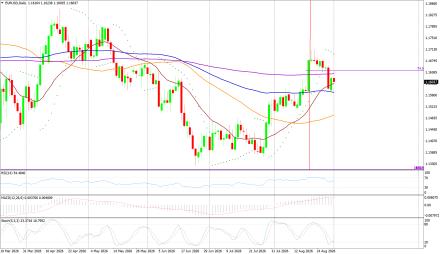
EUR/USD on Monday made an intraday low of US$1.1575/EUR, a high of US$1.1620/EUR, and settled up by 0.3505% to close at US$1.1616/EUR.
Technicals in Focus:
On daily charts, prices are sustaining above 100DMA (1.1661), which becomes immediate support, a break below will target 1.1695. MACD is above the zero line and histograms are increasing mode, bringing a bullish view. Stochastic is in oversold territory, giving negative crossovers to the bullish outlook for intraday. 14D RSI is currently in a neutral region and giving no directions to consider right now.
Trading Strategy: Neutral to Sell
Sell below 1.1690-1.1850, targeting 1.1655-1.1627-1.1610-1.1588 and 1.1550-1.1485-1.1465-1.1440-1.1405 with stop-loss at daily closing above 1.1850.
Buy above 1.1650-1.1250 with risk below 1.1250 targeting 1.1690-1.1720-1.1750 and 1.1795-1.1820-1.1850. |
|
| Intraday Support Levels |
| S1 |
|
|
1.1590-1.1570-1.1550 |
| S2 |
|
|
1.1510-1.1488-1.1465 |
| S3 |
|
|
1.1450 |
| Intraday Resistance Levels |
| R1 |
|
|
1.1610-1.1627-1.1655 |
| R2 |
|
|
1.1690-1.1720-1.1750 |
| R3 |
|
|
1.17951.1820-1.1850 |
| TECHNICAL INDICATORS |
| Name |
|
Value |
Action |
| 14DRSI |
|
48.897 |
Buy |
| 20-DMA |
|
1.1695 |
Sell |
| 50-DMA |
|
1.1656 |
Buy |
| 100-DMA |
|
1.1661 |
Buy |
| 200-DMA |
|
1.1585 |
Buy |
| STOCH(5,3) |
|
55.688 |
Buy |
| MACD(12,26,9) |
|
-0.0013 |
|
|
|
|
|
GBP/USD
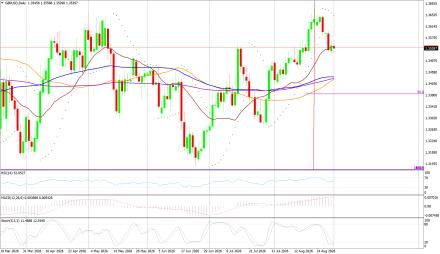
GBP/USD on Monday made a intraday low of US$1.3527/GBP, a high of US$1.3564/GBP, and settled the day down by 0.412% to close at US$1.3548/GBP.
Technicals in Focus:
On daily charts, prices are sustaining above 50DMA (1.2674) is becoming a support level. 14-D RSI is currently in a neutral region and direction is difficult to predict on an RSI basis. The Stochastic Oscillator is in oversold territory and gives a positive crossover to confirm a bullish stance. MACD is above the zero line, but histograms are increasing leading to movement.
Trading Strategy: Neutral to Buy
Based on the charts and explanations above; buy between 1.3530-1.3079 with a target of 1.3590-1.3630-1.3660-1.3690 and 1.3730-1.3770-1.3800 with a stop loss closing below 1.3100.
Sell in between 1.3560-1.3820 with targets at 1.3530-1.3480-1.3450 and 1.3410-1.3350-1.3300-1.3270 with a stop loss of 1.3900. |
|
| Intraday Support Levels |
| S1 |
|
|
1.3530 |
| S2 |
|
|
1.3480-1.3450-1.3410 |
| S3 |
|
|
1.3350-1.3315-1.3290 |
| Intraday Resistance Levels |
| R1 |
|
|
1.3560-1.3590-1.3640 |
| R2 |
|
|
1.3660-1.3690-1.3730 |
| R3 |
|
|
1.3770-1.3800 |
| TECHNICAL INDICATORS |
| Name |
|
Value |
Action |
| 14DRSI |
|
46.905 |
Buy |
| 20-DMA |
|
1.2932 |
Buy |
| 50-DMA |
|
1.2736 |
Buy |
| 100-DMA |
|
1.2629 |
Buy |
| 200-DMA |
|
1.2811 |
Buy |
| STOCH(5,3) |
|
9.458 |
Buy |
| MACD(12,26,9) |
|
-0.003 |
Sell |
|
|
|
|
USD/JPY
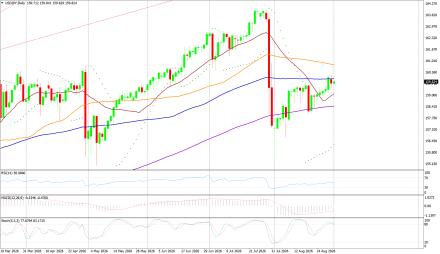
USD/JPY on Monday made an intra‐day low of JPY159.46/USD an intraday high of JPY160.18/USD, and settled the day down by % at JPY159.72/USD.
Technicals in Focus:
In daily charts, JPY is sustaining above 100DMA (152.35), major support on the daily chart. 14-D RSI is currently in the overbought region and chances of downward are expected based on RSI. MACD is above the zero line but histograms are decreasing mode which might lead to downward movement. The Stochastic Oscillator is in overbought territory and signaling to sell as it has given a negative crossover to confirm a bearish stance.
Trading Strategy: Neutral to Sell
Sell below 160.00-161.90 with risk above 162.00 targeting 157.00-156.50-156.00-155.20 and 154.50-154.00-153.00.
Long positions above 159.50-152.00 with targets of 159.40-160.00-161.00-161.40-162.40-163.00-163.50 and 164.00-164.60-165.00 with stops below 152.00. |
|
| Intraday Support Levels |
| S1 |
|
|
159.50-158.90-158.50 |
| S2 |
|
|
157.90-157.10-156.50 |
| S3 |
|
|
156.00-155.20-154.50 |
| INTRADAY RESISTANCE LEVELS |
| R1 |
|
|
160.00-160.77 |
| R2 |
|
|
161.00-161.40 |
| R3 |
|
|
161.90-162.50-162.90 |
| TECHNICAL INDICATORS |
| Name |
|
Value |
Action |
| 14DRSI |
|
41.14 |
Buy |
| 20-DMA |
|
148.91 |
Buy |
| 50-DMA |
|
150.24 |
Buy |
| 100-DMA |
|
152.53 |
Buy |
| 200-DMA |
|
151.18 |
Buy |
| STOCH(9,6) |
|
93.662 |
Sell |
| MACD(12,26,9) |
|
0.683 |
Sell |
|
|
|
 |