 |
|
|
Daily Market Lookup
- Global Developments in Focus
Commodities: Renewed U.S.-Iran hostilities drove a sharp rise in energy prices on September 1. Oil advanced as traders priced renewed supply and Strait of Hormuz risks. Higher oil prices intensified inflation concerns, lifted sovereign bond yields and reinforced expectations that central banks may need to keep policy restrictive. Gold and silver moved lower as the stronger U.S. dollar and rising yields outweighed safe-haven demand. Gold closed near $4,328/oz after a sharp intraday reversal, while silver finished near $64.06/oz. Oil prices rose in early trade on Wednesday, extending the previous session’s surge, as concerns over supply disruption intensified after the U.S. and Iran exchanged strikes overnight, dimming hopes for a quick easing of tensions in the Middle East. The U.S. said it had launched a series of airstrikes against targets in Iran overnight, prompting a response from Tehran, in the most serious escalation of the conflict between the two countries in weeks The Islamic Revolutionary Guard Corps said the U.S. attacks would further restrict traffic through the Strait of Hormuz, a critical waterway that carried about one-fifth of the global oil consumed before the conflict and which Iran has effectively closed to commercial shipping The IRGC also said it had targeted a U.S. military base in Jordan with ballistic missiles that it claimed had killed a large number of U.S. forces, while Iranian state media reported a large-scale drone attack on a U.S. base in Bahrain in response to the American strikes Jordan’s military said its air defences intercepted 10 of 13 ballistic missiles that entered its airspace, while two U.S. officials said no American casualties had been reported so far from the attacks. Separately, Kuwait said its armed forces were responding to hostile drone activity. The latest exchange followed a weekend flare-up in hostilities, the first since July, and came after attacks on two tankers departing the Strait of Hormuz on Monday, causing further disruptions to oil supplies and forcing traders to seek alternative crude shipments. Meanwhile, in the U.S., the world’s largest oil producer, crude inventories fell by 2.6 million barrels in the week ended August 28, while distillate stocks, which include diesel and heating oil, declined by 265,000 barrels, market sources said, citing data from the American Petroleum Institute.
Foreign Exchange: The U.S. dollar strengthened on safe-haven demand and higher Treasury yields. EUR/USD and GBP/USD weakened during the session, while USD/JPY moved back above 160 as the yield gap continued to pressure the yen. Japan and the United States reiterated the importance of orderly currency moves, keeping intervention risk in focus. On Tuesday, the latest Job Openings and Labor Turnover Summary (JOLTS) showed U.S. job openings in July were 7.271 million, lower than the expected figure of 7.330 million, but ticking up from June’s downwardly-revised figure of 7.182 million. While the headline figure for July was cooler than anticipated, the increase from June and the overall level remaining near the two-year high of 7.585 million job openings in April suggested that the U.S. employment picture remained resilient That gives the Fed some potential breathing room in terms of not having to tighten monetary policy immediately, which was reflected in interest rate odds. As per the CME FedWatch tool, the probabilities of a quarter-point hike in September stood at about 68% after the JOLTS data, while that of the Fed holding steady were nearly 32%, both little changed from the previous day. Eyes are now on Friday’s U.S. August nonfarm payrolls report.
- Rates and Macro: The global bond sell-off accelerated, with Japanese benchmark yields reaching 3% for the first time since 1996 and U.S. yields holding near multi-year highs. Market expectations for a September Federal Reserve rate increase rose after hawkish commentary and the renewed energy-price shock. Softer U.S. job-openings data provided only limited relief.
|
|
| Intraday RESISTANCE LEVELS |
| 2nd September 2026 |
R1 |
R2 |
R3 |
| GOLD-XAU |
4,329.20-4,360.18-4,396.40 |
4,419.03-4,445.40- |
4501.20-4,530.11-4,557.76 |
| Silver-XAG |
65.401-66.078 |
67.069-68.098 |
69.137-70.205 |
| Crude Oil |
89.602-90.893 |
91.850-92.462 |
93.830-95.327 |
| EURO/USD |
1.16157 |
1.16395 |
1.16553 |
| GBP/USD |
1.35468 |
1.35794 |
1.36001 |
| USD/JPY |
160.32 |
160.49 |
160.83 |
| Intraday SUPPORTS LEVELS |
| 2nd September 2026 |
S1 |
S2 |
S3 |
| GOLD-XAU |
4,280.30-4,241.16 |
4,232.11 |
4189.40-4,141.57 |
| Silver-XAG |
63.019 |
61.980-61.603 |
61.190-59.960 |
| Crude Oil |
89.100-87.400-86.459 |
85.160-83.594 |
82.705-82.025 |
| EURO/USD |
1.15761 |
1.15603 |
1.15365 |
| GBP/USD |
1.34935 |
1.34728 |
1.34402 |
| USD/JPY |
159.81 |
159.47 |
159.30 |
|
|
| Intra-Day Strategy (2nd September 2026) |
| GOLD-XAU |
Sell on Strength |
| Silver-XAG |
Neutral to Sell |
|
| Crude Oil |
Buy on Dips |
| EUR/USD |
Neutral to Sell |
|
| GBP/USD |
Neutral to Buy |
| USD/JPY |
Buy on Dips |
|
|
|
|
Gold – XAU
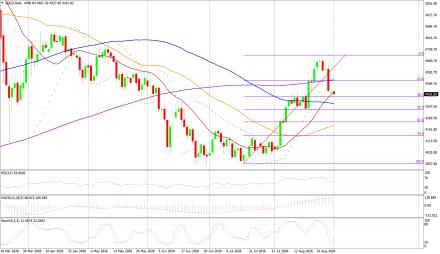
Gold - XAU/USD on Tuesday made an intraday high of 4,461.39, a low of 4,322.66, and closed at 4,328.48 US$/oz, -2.749% versus the session open.
Technicals in Focus:
Gold reversed sharply from an intraday high of $4,461.39 and closed near the session low at $4,328.48. The close fell below the 20-, 100- and 200-day averages, while remaining above the 50-day average. RSI is neutral, but MACD is below its signal and stochastic is deeply oversold. The chart therefore shows a damaged short-term trend with scope for a technical bounce, but rallies remain vulnerable while price stays below $4,442-$4,461.
Trading Strategy: Sell on Strength
Neutral to sell on strength. Initial support is clustered around $4,282-$4,189, followed by $4,141. A recovery above $4,375 would improve near-term tone; a close above $4,421-$4,461 is needed to neutralize the immediate bearish structure. Risk should be kept above the session high for short positions |
|
| Intraday Support Levels |
| S1 |
|
|
4,280.30-4,241.16 |
| S2 |
|
|
4,232.11 |
| S3 |
|
|
4189.40-4,141.57 |
| Intraday Resistance Levels |
| R1 |
|
|
4,329.20-4,360.18-4,396.40 |
| R2 |
|
|
4,419.03-4,445.40- |
| R3 |
|
|
4501.20-4,530.11-4,557.76 |
| Technical Indicators
|
| Name |
|
Value |
Action |
| 14DRSI |
|
46.3371 |
Neutral |
| 20-DMA |
|
4,442.49 |
Below / Bearish |
| 50-DMA |
|
4,215.59 |
Above / Bullish |
| 100-DMA |
|
4,365.04 |
Below / Bearish |
| 200-DMA |
|
4,528.91 |
Below / Bearish |
| STOCH(5,3) |
|
4,680.06 |
Bearish |
| MACD(12,26,9) |
|
78.372 vs 108.633 signal |
Bearish crossover |
|
|
|
|
Silver - XAG
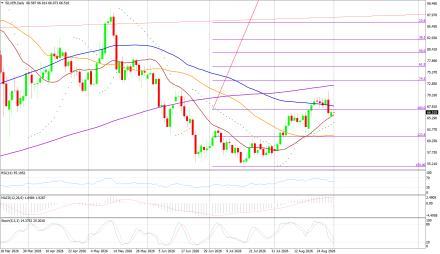
Silver - XAG/USD on Tuesday made an intraday high of 67.060, a low of 64.001, and closed at 64.057 US$/oz, -3.800% versus the session open.
Technicals in Focus:
Silver closed at $64.057 after trading as high as $67.060, extending the pullback below the 20-, 100- and 200-day averages. Price remains above the 50-day average, preserving part of the medium-term recovery. RSI is neutral, while MACD is below its signal and stochastic is deeply oversold. This combination favors caution: downside momentum is active, although oversold readings increase rebound risk.
Trading Strategy: Neutral to Sell
Neutral to sell on rebounds while below $65.84-$67.06. Pivot-based support appears near $63.06 and $62.06, with deeper protection around $59.00. A sustained move back above $65.84 would ease pressure, while a break over $67.06-$67.88 would strengthen the recovery case. |
|
| Intraday Support Levels |
| S1 |
|
|
63.019 |
| S2 |
|
|
61.980-61.603 |
| S3 |
|
|
61.190-59.960 |
| Intraday Resistance Levels |
| R1 |
|
|
65.401-66.078 |
| R2 |
|
|
67.069-68.098 |
| R3 |
|
|
69.137-70.205 |
| TECHNICAL INDICATORS |
| Name |
|
Value |
Action |
| 14DRSI |
|
47.7087 |
Neutral |
| 20-DMA |
|
65.839 |
Below / Bearish |
| 50-DMA |
|
61.478 |
Above / Bullish |
| 100-DMA |
|
67.880 |
Below / Bearish |
| 200-DMA |
|
72.480 |
Below / Bearish |
| STOCH(5,3) |
|
71.165 |
Bearish |
| MACD(12,26,9) |
|
1.4521 vs 1.9069 signal |
Bearish crossover |
|
|
|
|
Oil - WTI
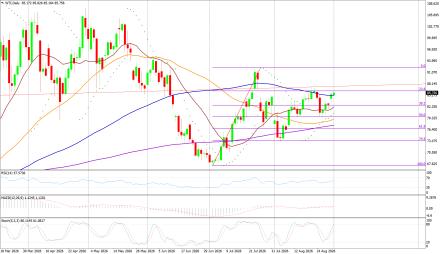
Crude Oil - WTI on Tuesday made an intraday high of 89.598, a low of 85.164, and closed at 89.323 US$/bbl, +4.874% versus the session open.
Technicals in Focus:
WTI surged from $85.172 to close at $89.323, near the $89.598 session high. Price is above all four tracked moving averages and above Parabolic SAR, while MACD remains above its signal. RSI at 63 supports the advance without reaching classical overbought territory; stochastic above 80 warns that the move is stretched in the short run.
Trading Strategy: Buy on Dips
Bullish, but avoid chasing strength. Pullbacks toward $87.40-$85.44 may offer better risk/reward if support holds. A break above $89.60 opens the pivot extension near $91.85-$93.83. A daily close back below $85.16 would weaken the breakout and expose the 20-day average near $82.34 |
|
| Intraday Support Levels |
| S1 |
|
|
89.100-87.400-86.459 |
| S2 |
|
|
85.160-83.594 |
| S3 |
|
|
82.705-82.025 |
| Intraday Resistance Levels |
| R1 |
|
|
89.602-90.893 |
| R2 |
|
|
91.850-92.462 |
| R3 |
|
|
93.830-95.327 |
| TECHNICAL INDICATORS |
| Name |
|
Value |
Action |
| 14DRSI |
|
63.0062 |
Bullish / not overbought |
| 20-DMA |
|
82.339 |
Above / Bullish |
| 50-DMA |
|
79.084 |
Above / Bullish |
| 100-DMA |
|
85.046 |
Above / Bullish |
| 200-DMA |
|
77.522 |
Above / Bullish |
| STOCH(5,3) |
|
80.503 |
Bullish |
| MACD(12,26,9) |
|
1.4091 vs 1.1517 signal |
Bullish |
|
|
|
|
EUR/USD
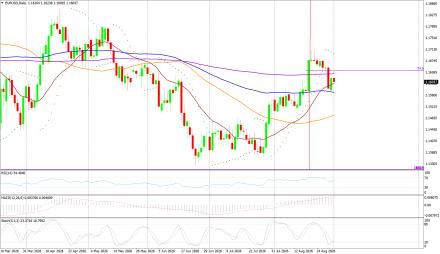
EUR/USD on Tuesday made an intraday high of 1.16238, a low of 1.15842, and closed at 1.15918 US$/EUR, -0.212% versus the session open.
Technicals in Focus:
EUR/USD finished at 1.15918 after failing to hold above 1.1620. The pair closed just below its 20-day average and below the 200-day average, but remains above the 50- and 100-day averages. RSI is neutral. MACD below its signal and SAR above price retain a cautious bias, while stochastic near 20 suggests selling pressure may be maturing.
Trading Strategy: Neutral to Sell
Range-bound with a mild downside bias below 1.1631. Pivot support lies near 1.1571 and 1.1551; a break below 1.1551 would expose 1.1511. Resistance begins around 1.1611-1.1631, followed by 1.1651. A close above the 200-day average would improve the outlook. |
|
| Intraday Support Levels |
| S1 |
|
|
1.15761 |
| S2 |
|
|
1.15603 |
| S3 |
|
|
1.15365 |
| Intraday Resistance Levels |
| R1 |
|
|
1.16157 |
| R2 |
|
|
1.16395 |
| R3 |
|
|
1.16553 |
| TECHNICAL INDICATORS |
| Name |
|
Value |
Action |
| 14DRSI |
|
52.5833 |
Neutral |
| 20-DMA |
|
1.15973 |
Slightly below |
| 50-DMA |
|
1.14935 |
Above / Bullish |
| 100-DMA |
|
1.15686 |
Above / Bullish |
| 200-DMA |
|
1.16310 |
Below / Bearish |
| STOCH(5,3) |
|
1.16963 |
Bearish |
| MACD(12,26,9) |
|
0.003611 vs 0.004798 signal |
Bearish crossover |
|
|
|
|
GBP/USD
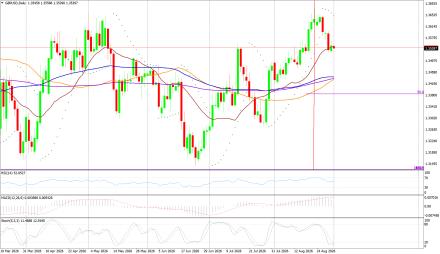
GBP/USD on Tuesday made an intraday high of 1.35586, a low of 1.35053, and closed at 1.35143 US$/GBP, -0.233% versus the session open.
Technicals in Focus:
GBP/USD closed at 1.35143, below the 20-day average after trading between 1.35053 and 1.35586. The pair remains above its 50-, 100- and 200-day averages, so the broader structure is still constructive. However, SAR is above price, MACD trails its signal and stochastic is oversold, confirming a short-term correction within the broader uptrend.
Trading Strategy: Neutral to Buy
Neutral to buy on controlled dips while 1.3434-1.3442 holds. Near-term support is around 1.3490 and 1.3466; resistance is near 1.3543-1.3559, followed by 1.3596. A close below the long-term moving-average cluster would shift the bias more decisively bearish. |
|
| Intraday Support Levels |
| S1 |
|
|
1.34935 |
| S2 |
|
|
1.34728 |
| S3 |
|
|
1.34402 |
| Intraday Resistance Levels |
| R1 |
|
|
1.35468 |
| R2 |
|
|
1.35794 |
| R3 |
|
|
1.36001 |
| TECHNICAL INDICATORS |
| Name |
|
Value |
Action |
| 14DRSI |
|
49.3011 |
Neutral |
| 20-DMA |
|
1.35468 |
Below / Bearish |
| 50-DMA |
|
1.34338 |
Above / Bullish |
| 100-DMA |
|
1.34417 |
Above / Bullish |
| 200-DMA |
|
1.34367 |
Above / Bullish |
| STOCH(5,3) |
|
1.36522 |
Bearish |
| MACD(12,26,9) |
|
0.003695 vs 0.005405 signal |
Bearish crossover |
|
|
|
|
USD/JPY
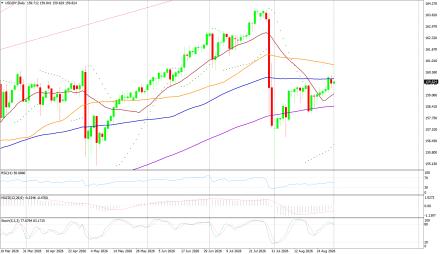
USD/JPY on Tuesday made an intraday high of 160.15, a low of 159.64, and closed at 160.15 JPY/USD, +0.250% versus the session open.
Technicals in Focus:
On the daily data, USD/JPY closed at 160.15 and remained above its 20-, 50-, 100- and 200-period simple moving averages. Investing.com’s September 1 technical snapshot classified the pair as Strong Buy, with RSI at 63.755 and MACD positive. Stochastic at 82.894 is overbought, indicating that upside momentum remains firm but the pair is vulnerable to short-term profit-taking near intervention-sensitive levels.
Trading Strategy: Buy on Dips
Buy on pullbacks toward 160.05-159.90 with risk below 159.64, targeting 160.22-160.27-160.30. Sell only on a sustained break below 159.64, targeting 159.50-159.39. Exercise caution around 160.00 because official concern about yen weakness can increase volatility.
Source: Investing.com USD/JPY Historical Data and Technical Analysis, Sep. 1, 2026. |
|
| Intraday Support Levels |
| S1 |
|
|
159.81 |
| S2 |
|
|
159.47 |
| S3 |
|
|
159.30 |
| INTRADAY RESISTANCE LEVELS |
| R1 |
|
|
160.32 |
| R2 |
|
|
160.49 |
| R3 |
|
|
160.83 |
| TECHNICAL INDICATORS |
| Name |
|
Value |
Action |
| 14DRSI |
|
63.755 |
Buy |
| 20-DMA |
|
160.21 |
Buy |
| 50-DMA |
|
160.15 |
Buy |
| 100-DMA |
|
160.05 |
Buy |
| 200-DMA |
|
159.91 |
Buy |
| STOCH(9,6) |
|
159.70 |
Buy |
| MACD(12,26,9) |
|
159.39 |
Buy |
|
|
|
 |