 |
|
|
Daily Market Lookup
- Commodities: Gold and silver recovered on September 2 as the U.S. dollar and Treasury yields eased from recent highs. Gold rebounded from a near one-month low, while silver held the $63-$64 support region. Oil remained elevated as renewed U.S.-Iran hostilities threatened supplies; WTI futures settled near $91 after U.S. crude inventories fell 4.5 million barrels, materially more than expected. OPEC+ was also expected to keep October output policy unchanged. The September 3 commodity outlook therefore remains headline-sensitive: precious metals need continued yield relief, while crude retains a geopolitical premium but is technically stretched.
- Foreign Exchange: The dollar eased as oil and yields lost momentum and weaker U.S. private-payroll data raised questions about growth. EUR/USD and GBP/USD nevertheless remained under pressure because markets continued to price a comparatively hawkish Federal Reserve. The yen surged sharply against the dollar after BOJ rate-hike signals and market speculation about a possible official rate check. USD/JPY closed near its 200-day average, making 158.20-158.44 the key September 3 decision zone.
- September 3 Risk Calendar: Primary catalysts are U.S. labor-market data, Treasury-yield direction, developments in the U.S.-Iran conflict, and any Japanese official commentary on currency volatility. Forecasts in this report are conditional scenarios based on the September 2 close; they are not guarantees. Position sizing and stop-loss discipline are essential because geopolitical headlines can invalidate technical levels quickly.
Sources: Supplied FxPro daily charts; Investing.com Commodities & Futures News and Forex News, accessed September 2, 2026; Investing.com WTI historical/technical data; Reuters market, oil, precious-metals and foreign-exchange coverage dated September 2, 2026.
|
|
| Intraday RESISTANCE LEVELS |
| 3rd September 2026 |
R1 |
R2 |
R3 |
| GOLD-XAU |
4,429.67 |
4,471.15 |
4,544.78 |
| Silver-XAG |
66.141 |
66.984 |
68.412 |
| Crude Oil |
92.62 |
94.10 |
95.91 |
| EURO/USD |
1.16088 |
1.16301 |
1.16517 |
| GBP/USD |
1.35101 |
1.35101 |
1.35538 |
| USD/JPY |
159.976 |
161.272 |
162.160 |
| Intraday SUPPORTS LEVELS |
| 3rd September 2026 |
S1 |
S2 |
S3 |
| GOLD-XAU |
4,314.56 |
4,240.93 |
4,199.45 |
| Silver-XAG |
63.870 |
62.442 |
61.599 |
| Crude Oil |
89.33 |
87.52 |
86.04 |
| EURO/USD |
1.15659 |
1.15443 |
1.15230 |
| GBP/USD |
1.34664 |
1.34482 |
1.34227 |
| USD/JPY |
157.792 |
156.904 |
155.608 |
|
|
| Intra-Day Strategy (3rd September 2026) |
| GOLD-XAU |
Neutral to Buy on Dips |
| Silver-XAG |
Neutral to Buy |
|
| Crude Oil |
Buy on Dips |
| EUR/USD |
Neutral to Sell |
|
| GBP/USD |
Neutral to Sell |
| USD/JPY |
Sell on Strength |
|
|
|
|
Gold – XAU
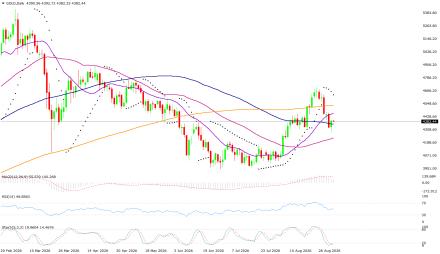
Gold - XAU/USD on Tuesday made an intraday high of 4,397.51, a low of 4,282.40, and closed at 4,388.20 US$/oz, +1.313% versus the session open.
Technicals in Focus:
Gold rebounded from 4,282.40 and closed at 4,388.20, above the 100-day and 50-day averages but below the 20-day and 200-day averages. RSI at 50.23 is neutral. MACD remains positive but below its signal, showing that the larger recovery has lost momentum. Stochastic is oversold and has turned marginally above its signal, favoring a short-covering rebound if 4,361-4,330 holds. The 4,449-4,531 zone remains the principal ceiling.
Trading Strategy: Neutral to Buy on Dips
Buy between 4,361-4,330 with risk below 4,282, targeting 4,430-4,450-4,475 and 4,513. Sell below 4,361 with risk above 4,450, targeting 4,330-4,293-4,240 and 4,198. |
|
| Intraday Support Levels |
| S1 |
|
|
4,314.56 |
| S2 |
|
|
4,240.93 |
| S3 |
|
|
4,199.45 |
| Intraday Resistance Levels |
| R1 |
|
|
4,429.67 |
| R2 |
|
|
4,471.15 |
| R3 |
|
|
4,544.78 |
| Technical Indicators
|
| Name |
|
Value |
Action |
| 14DRSI |
|
50.2322 |
Neutral |
| 20-DMA |
|
4,449.53 |
Sell |
| 50-DMA |
|
4,223.38 |
Buy |
| 100-DMA |
|
4,361.02 |
Sell |
| 200-DMA |
|
4,530.53 |
Sell |
| STOCH(5,3) |
|
4,658.62 |
Sell |
| MACD(12,26,9) |
|
66.250 / 105.714 |
Sell |
|
|
|
|
Silver - XAG
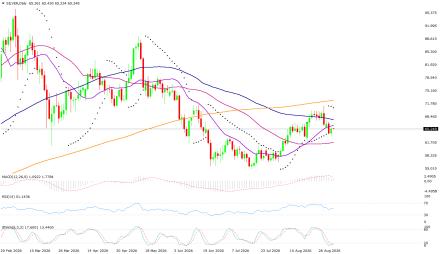
Silver - XAG/USD on Tuesday made an intraday high of 65.555, a low of 63.284, and closed at 65.299 US$/oz, +1.790% versus the session open.
Technicals in Focus:
Silver recovered from 63.284 to close at 65.299. Price remains above the 50-day average but below the 20-, 100- and 200-day averages. RSI is neutral, while MACD remains below its signal. Stochastic is deeply oversold, leaving room for a rebound, but momentum confirmation requires a break above 66.00. The broader chart continues to show lower rebound highs, so 67.74 and 71.02 are substantial resistance.
Trading Strategy: Neutral to Buy
Buy between 64.43-63.28 with risk below 63.28, targeting 65.55-66.00-66.14-66.98 and 68.41. Sell below 63.87 with risk above 65.55, targeting 63.28-62.54-62.44 and 61.60. |
|
| Intraday Support Levels |
| S1 |
|
|
63.870 |
| S2 |
|
|
62.442 |
| S3 |
|
|
61.599 |
| Intraday Resistance Levels |
| R1 |
|
|
66.141 |
| R2 |
|
|
66.984 |
| R3 |
|
|
68.412 |
| TECHNICAL INDICATORS |
| Name |
|
Value |
Action |
| 14DRSI |
|
51.2989 |
Buy |
| 20-DMA |
|
66.002 |
Sell |
| 50-DMA |
|
61.636 |
Buy |
| 100-DMA |
|
67.744 |
Sell |
| 200-DMA |
|
72.556 |
Sell |
| STOCH(5,3) |
|
71.022 |
Sell |
| MACD(12,26,9) |
|
1.2606 / 1.8652 |
Sell |
|
|
|
|
Oil - WTI
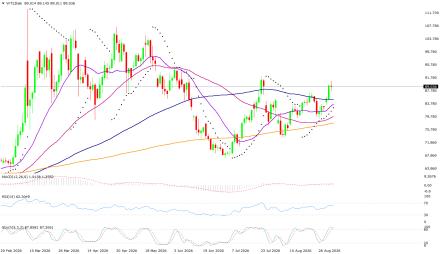
Crude Oil - WTI on Tuesday made an intraday high of 92.28, a low of 88.99, and closed at 91.15 US$/bbl, +0.441% versus the session open.
Technicals in Focus:
The supplied FxPro chart keeps WTI above all major moving averages and above Parabolic SAR. RSI at 62.34 and MACD above its signal confirm bullish trend momentum, while stochastic near 88 signals a stretched market. The chart quote differs from exchange-traded futures because the screenshot is a broker CFD feed; Investing.com reports September 2 WTI futures at 91.15 after a 88.99-92.28 range. Both sources show an elevated, bullish market with increased reversal risk.
Trading Strategy: Buy on Dips
Buy between 90.48-89.68 with risk below 88.99, targeting 91.28-91.81-92.28 and 94.10. Sell only below 89.68 with risk above 91.28, targeting 88.99-87.65 and 86.04. Stochastic is overbought, so avoid chasing a vertical advance. |
|
| Intraday Support Levels |
| S1 |
|
|
89.33 |
| S2 |
|
|
87.52 |
| S3 |
|
|
86.04 |
| Intraday Resistance Levels |
| R1 |
|
|
92.62 |
| R2 |
|
|
94.10 |
| R3 |
|
|
95.91 |
| TECHNICAL INDICATORS |
| Name |
|
Value |
Action |
| 14DRSI |
|
62.3357 |
Buy |
| 20-DMA |
|
82.339 |
Buy |
| 50-DMA |
|
79.084 |
Buy |
| 100-DMA |
|
85.046 |
Buy |
| 200-DMA |
|
77.522 |
Buy |
| STOCH(5,3) |
|
80.503 |
Buy |
| MACD(12,26,9) |
|
1.9147 / 1.2553 |
Buy |
|
|
|
|
EUR/USD
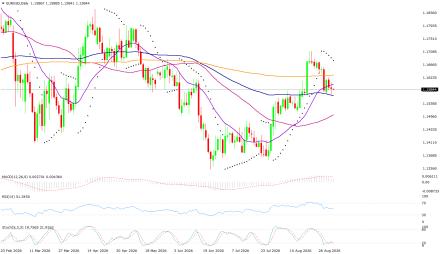
EUR/USD on Tuesday made an intraday high of 1.16085, a low of 1.15656, and closed at 1.15875 US$/EUR, -0.035% versus the session open.
Technicals in Focus:
EUR/USD closed at 1.15875, below the 20-day and 200-day averages but marginally above the 100-day average. RSI is neutral. MACD remains positive but below its signal, while stochastic has turned higher from a low zone. The pair is therefore caught between support near 1.1566 and resistance at 1.1599-1.1631. The weaker dollar helped late in the session, but the daily trend remains fragile. U.S. labor data and Treasury yields remain the main catalysts.
Trading Strategy: Neutral to Sell
Sell between 1.16085-1.16313 with risk above 1.16520, targeting 1.15800-1.15656-1.15443 and 1.15230. Buy only above 1.16085 with risk below 1.15650, targeting 1.16310-1.16520 and 1.16890. |
|
| Intraday Support Levels |
| S1 |
|
|
1.15659 |
| S2 |
|
|
1.15443 |
| S3 |
|
|
1.15230 |
| Intraday Resistance Levels |
| R1 |
|
|
1.16088 |
| R2 |
|
|
1.16301 |
| R3 |
|
|
1.16517 |
| TECHNICAL INDICATORS |
| Name |
|
Value |
Action |
| 14DRSI |
|
51.8789 |
Neutral |
| 20-DMA |
|
1.15991 |
Sell |
| 50-DMA |
|
1.14981 |
Buy |
| 100-DMA |
|
1.15665 |
Buy |
| 200-DMA |
|
1.16313 |
Sell |
| STOCH(5,3) |
|
1.16891 |
Sell |
| MACD(12,26,9) |
|
0.003135 / 0.004629 |
Sell |
|
|
|
|
GBP/USD
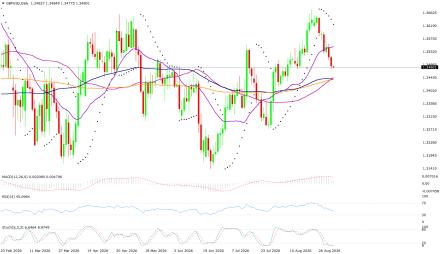
GBP/USD on Tuesday made an intraday high of 1.35174, a low of 1.34737, and closed at 1.34846 US$/GBP, -0.216% versus the session open.
Technicals in Focus:
GBP/USD extended its pullback to 1.34846 and remains below the 20-day average and Parabolic SAR. RSI at 45.64 and MACD below its signal confirm weakening momentum. However, the 50-, 100- and 200-day averages are tightly clustered around 1.3440, while stochastic is deeply oversold. This creates a clear decision zone: the broader recovery survives above 1.3438, but a break below it would turn the daily structure materially bearish. The deeply oversold stochastic increases the chance of a technical bounce.
Trading Strategy: Neutral to Sell
Sell between 1.3510-1.3548 with risk above 1.3560, targeting 1.3480-1.3466-1.3448 and 1.3423. Buy near 1.3440 only while 1.3430 holds, targeting 1.3485-1.3510 and 1.3548. |
|
| Intraday Support Levels |
| S1 |
|
|
1.34664 |
| S2 |
|
|
1.34482 |
| S3 |
|
|
1.34227 |
| Intraday Resistance Levels |
| R1 |
|
|
1.35101 |
| R2 |
|
|
1.35101 |
| R3 |
|
|
1.35538 |
| TECHNICAL INDICATORS |
| Name |
|
Value |
Action |
| 14DRSI |
|
45.6425 |
Sell |
| 20-DMA |
|
1.35477 |
Sell |
| 50-DMA |
|
1.34402 |
Buy |
| 100-DMA |
|
1.34409 |
Buy |
| 200-DMA |
|
1.34386 |
Buy |
| STOCH(5,3) |
|
1.36405 |
Sell |
| MACD(12,26,9) |
|
0.002828 / 0.005125 |
Sell |
|
|
|
|
USD/JPY
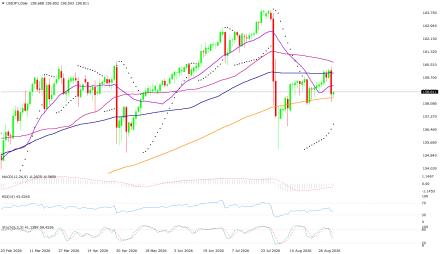
USD/JPY on Tuesday made an intraday high of 160.385, a low of 158.201, and closed at 158.679 JPY/USD, -0.916% versus the session open.
Technicals in Focus:
USD/JPY reversed sharply from 160.385 to close at 158.679 as the yen recorded its strongest rise in about a month. Price fell below the 20-, 50- and 100-day averages and finished only slightly above the 200-day average at 158.436. RSI moved below 50 and stochastic crossed lower, confirming near-term bearish pressure. MACD remains above its signal despite being below zero, and SAR remains below price; these indicators warn that the decline may become volatile rather than one-directional. Use smaller positions because BOJ commentary and intervention sensitivity can produce abrupt reversals.
Trading Strategy: Sell on Strength
Sell between 159.19-159.98 with risk above 160.40, targeting 158.44-158.20-157.79 and 156.90. Buy only above 159.19 with risk below 158.20, targeting 159.98-160.72 and 161.27. |
|
| Intraday Support Levels |
| S1 |
|
|
157.792 |
| S2 |
|
|
156.904 |
| S3 |
|
|
155.608 |
| INTRADAY RESISTANCE LEVELS |
| R1 |
|
|
159.976 |
| R2 |
|
|
161.272 |
| R3 |
|
|
162.160 |
| TECHNICAL INDICATORS |
| Name |
|
Value |
Action |
| 14DRSI |
|
42.3877 |
Sell |
| 20-DMA |
|
159.190 |
Sell |
| 50-DMA |
|
160.719 |
Sell |
| 100-DMA |
|
159.996 |
Sell |
| 200-DMA |
|
158.436 |
Buy |
| STOCH(9,6) |
|
156.479 |
Buy |
| MACD(12,26,9) |
|
-0.2603 / -0.4229 |
Buy |
|
|
|
 |