 |
|
|
Daily Market Lookup
- Commodities: Gold and silver rallied on September 3 as Federal Reserve Governor Christopher Waller indicated support for holding rates steady if inflation continues to cool. Treasury yields and the U.S. dollar declined, lifting spot gold by about 2% and silver by more than 2%. WTI reached a six-week high as renewed U.S. strikes on Iran, Israeli threats and reduced Strait of Hormuz traffic revived supply concerns, although oil surrendered part of the intraday advance before settlement. Precious metals enter Friday with positive momentum, while crude remains bullish but highly sensitive to geopolitical headlines.
- Foreign Exchange: The dollar index fell as traders reduced expectations for a September Federal Reserve rate increase. EUR/USD and GBP/USD recovered, but the yen produced the strongest move: USD/JPY fell nearly 2% as markets priced a greater probability of a Bank of Japan rate increase. Reuters reported no evidence of official yen-buying intervention, keeping the move tied mainly to BOJ expectations and position unwinding. Oversold conditions leave USD/JPY vulnerable to sharp rebounds even while its trend remains bearish.
- September 4 Risk Calendar: The U.S. non-farm payrolls report is the principal event. A Reuters poll expects approximately 56,000 jobs after July recorded a 23,000 decline. A weaker report would favor gold, silver, EUR/USD and GBP/USD while adding pressure to USD/JPY; a strong report would likely support the dollar and Treasury yields. Middle East headlines remain the dominant WTI risk. Forecasts are conditional strategies based on the September 3 close and are not guarantees.
|
|
| Intraday RESISTANCE LEVELS |
| 4th September 2026 |
R1 |
R2 |
R3 |
| GOLD-XAU |
4,528.52 |
4,583.75 |
4,656.68 |
| Silver-XAG |
67.9180 |
68.8255 |
70.1765 |
| Crude Oil |
93.33 |
95.00 |
96.86 |
| EURO/USD |
1.1650 |
1.1674 |
1.1707 |
| GBP/USD |
1.3557 |
1.3586 |
1.3625 |
| USD/JPY |
158.12 |
160.38 |
161.79 |
| Intraday SUPPORTS LEVELS |
| 4th September 2026 |
S1 |
S2 |
S3 |
| GOLD-XAU |
4,400.36 |
4,327.43 |
4,272.20 |
| Silver-XAG |
65.6595 |
64.3085 |
63.4010 |
| Crude Oil |
89.80 |
87.94 |
86.27 |
| EURO/USD |
1.1593 |
1.1560 |
1.1536 |
| GBP/USD |
1.3489 |
1.3450 |
1.3421 |
| USD/JPY |
154.45 |
153.04 |
150.78 |
|
|
| Intra-Day Strategy (4th September 2026) |
| GOLD-XAU |
Buy on Dips |
| Silver-XAG |
Buy on Dips |
|
| Crude Oil |
Buy on Dips |
| EUR/USD |
Buy on Dips |
|
| GBP/USD |
Neutral to Buy |
| USD/JPY |
Sell on Strength |
|
|
|
|
Gold – XAU
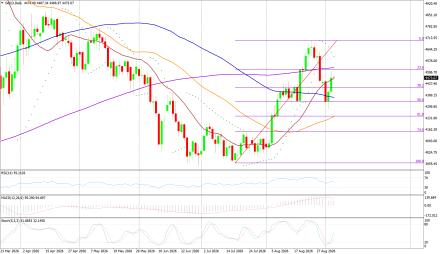
Gold - XAU/USD on Thursday made an intraday high of 4,510.81, a low of 4,382.65, and closed at 4,473.30 US$/oz, +1.998% versus the session open.
Technicals in Focus:
Gold advanced 2.00% to close at 4,473.30 after trading as high as 4,510.81. Price is above the 20-, 50- and 100-period averages but remains below the 200-period average at 4,517.37. RSI at 63.66 and positive MACD confirm improving momentum, while stochastic at 57.93 is constructive without being overbought. The 4,511-4,529 area is the immediate breakout zone; 4,456 and 4,400 are the first supports. Friday payrolls can produce a sharp dollar-and-yield reversal, so reduce position size before the release.
Trading Strategy: Buy on Dips
Buy between 4,456-4,430 with risk below 4,400, targeting 4,511-4,529-4,584 and 4,657. Sell only below 4,400 with risk above 4,456, targeting 4,383-4,327 and 4,272. |
|
| Intraday Support Levels |
| S1 |
|
|
4,400.36 |
| S2 |
|
|
4,327.43 |
| S3 |
|
|
4,272.20 |
| Intraday Resistance Levels |
| R1 |
|
|
4,528.52 |
| R2 |
|
|
4,583.75 |
| R3 |
|
|
4,656.68 |
| Technical Indicators
|
| Name |
|
Value |
Action |
| 14DRSI |
|
63.664 |
Buy |
| 20-DMA |
|
4,455.93 |
Buy |
| 50-DMA |
|
4,389.06 |
Buy |
| 100-DMA |
|
4,410.27 |
Byuy |
| 200-DMA |
|
4,517.37 |
Sell |
| STOCH(5,3) |
|
42.060 |
Buy |
| MACD(12,26,9) |
|
27.930 |
Buy |
|
|
|
|
Silver - XAG
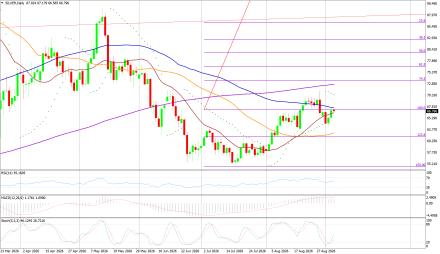
Silver - XAG/USD on Thursday made an intraday high of 67.4745, a low of 65.2160, and closed at 67.0105 US$/oz, +2.537% versus the session open.
Technicals in Focus:
Silver rose 2.53% to 67.0105 and closed above the 20-, 50- and 100-period averages. RSI at 65.27 and positive MACD support the advance, while stochastic at 76.93 is approaching overbought territory. Price remains just below the 200-period average at 67.3145 and the session high at 67.4745, making that band the immediate test. A break above it exposes 67.9180 and 68.8255. Momentum is positive, but avoid chasing if stochastic moves above 80 before payrolls.
Trading Strategy: Buy on Dips
Buy between 66.5670-65.6595 with risk below 65.2160, targeting 67.4745-67.9180-68.8255 and 70.1770. Sell below 65.6595 with risk above 67.0105, targeting 65.2160-64.3080 and 63.4005. |
|
| Intraday Support Levels |
| S1 |
|
|
65.6595 |
| S2 |
|
|
64.3085 |
| S3 |
|
|
63.4010 |
| Intraday Resistance Levels |
| R1 |
|
|
67.9180 |
| R2 |
|
|
68.8255 |
| R3 |
|
|
70.1765 |
| TECHNICAL INDICATORS |
| Name |
|
Value |
Action |
| 14DRSI |
|
65.268 |
Buy |
| 20-DMA |
|
66.3116 |
Buy |
| 50-DMA |
|
65.1855 |
Buy |
| 100-DMA |
|
65.8090 |
Buy |
| 200-DMA |
|
67.3145 |
Sell |
| STOCH(5,3) |
|
29.259 |
Buy |
| MACD(12,26,9) |
|
0.559 |
Buy |
|
|
|
|
Oil - WTI
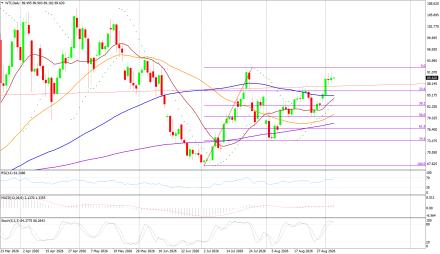
Crude Oil - WTI on Thursday made an intraday high of 93.13, a low of 89.60, and closed at 91.67 US$/bbl, +1.058% versus the session open.
Technicals in Focus:
WTI futures closed at 91.67 after reaching a six-week intraday high of 93.13. Price remains above the listed 20-, 50-, 100- and 200-period averages, while RSI at 55.15 and positive MACD retain a bullish bias. Stochastic at 39.22 warns that momentum cooled into the close. The wide 89.60-93.13 range shows headline sensitivity as Middle East supply risk competes with late-session profit-taking. The supplied chart is the FxPro broker-CFD chart through September 2; September 3 OHLC, indicators and pivots use Investing.com WTI futures data.
Trading Strategy: Buy on Dips
Buy between 91.47-89.80 with risk below 89.60, targeting 93.13-93.33-95.00 and 96.86. Sell below 89.80 with risk above 91.70, targeting 89.60-87.94 and 86.27. |
|
| Intraday Support Levels |
| S1 |
|
|
89.80 |
| S2 |
|
|
87.94 |
| S3 |
|
|
86.27 |
| Intraday Resistance Levels |
| R1 |
|
|
93.33 |
| R2 |
|
|
95.00 |
| R3 |
|
|
96.86 |
| TECHNICAL INDICATORS |
| Name |
|
Value |
Action |
| 14DRSI |
|
55.147 |
Buy |
| 20-DMA |
|
91.47 |
Buy |
| 50-DMA |
|
90.95 |
Buy |
| 100-DMA |
|
88.49 |
Buy |
| 200-DMA |
|
85.65 |
Buy |
| STOCH(5,3) |
|
21.938 |
Buy |
| MACD(12,26,9) |
|
0.210 |
Buy |
|
|
|
|
EUR/USD
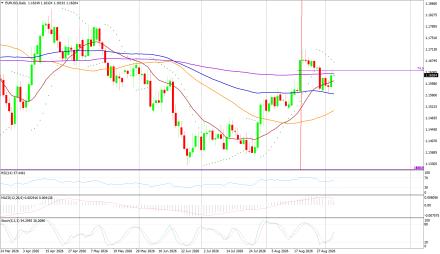
EUR/USD on Thursday made an intraday high of 1.1641, a low of 1.1584, and closed at 1.1626 US$/EUR, +0.354% versus the session open.
Technicals in Focus:
EUR/USD gained 0.35% to 1.1626 as the dollar and Treasury yields declined. Price closed above the 20-, 50- and 100-period averages and directly at the 200-period average. RSI at 60.24, positive MACD and stochastic at 63.55 support the recovery. A sustained break above 1.1641-1.1650 would confirm further upside, while 1.1617 and 1.1593 are the first supports. The U.S. payroll release is the principal catalyst and can reverse the dollar quickly.
Trading Strategy: Buy on Dips
Buy between 1.1617-1.1593 with risk below 1.1584, targeting 1.1641-1.1650-1.1674 and 1.1707. Sell below 1.1593 with risk above 1.1620, targeting 1.1584-1.1560 and 1.1536 |
|
| Intraday Support Levels |
| S1 |
|
|
1.1593 |
| S2 |
|
|
1.1560 |
| S3 |
|
|
1.1536 |
| Intraday Resistance Levels |
| R1 |
|
|
1.1650 |
| R2 |
|
|
1.1674 |
| R3 |
|
|
1.1707 |
| TECHNICAL INDICATORS |
| Name |
|
Value |
Action |
| 14DRSI |
|
60.240 |
Buy |
| 20-DMA |
|
1.1617 |
Buy |
| 50-DMA |
|
1.1597 |
Buy |
| 100-DMA |
|
1.1598 |
Buy |
| 200-DMA |
|
1.1626 |
Neutral |
| STOCH(5,3) |
|
34.680 |
Buy |
| MACD(12,26,9) |
|
0.001 |
Buy |
|
|
|
|
GBP/USD
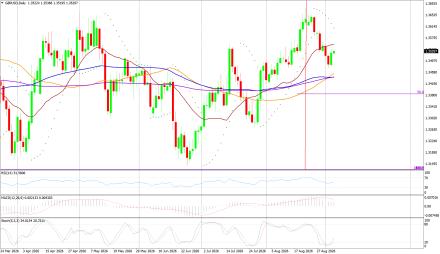
GBP/USD on Thursday made an intraday high of 1.3548, a low of 1.3480, and closed at 1.3527 US$/GBP, +0.334% versus the session open.
Technicals in Focus:
GBP/USD recovered 0.33% to 1.3527 after holding 1.3480. Price is above the 20-, 50- and 100-period averages but remains below the 200-period average at 1.3565. RSI at 58.18, positive MACD and stochastic at 66.77 show improving momentum. The broader signal remains neutral because the pair must clear 1.3548-1.3565 to convert the rebound into a stronger breakout. Sterling remains sensitive to both U.S. payrolls and elevated UK gilt yields.
Trading Strategy: Neutral to Buy
Buy between 1.3518-1.3489 with risk below 1.3480, targeting 1.3548-1.3557-1.3586 and 1.3625. Sell below 1.3489 with risk above 1.3527, targeting 1.3480-1.3450 and 1.3421. |
|
| Intraday Support Levels |
| S1 |
|
|
1.3489 |
| S2 |
|
|
1.3450 |
| S3 |
|
|
1.3421 |
| Intraday Resistance Levels |
| R1 |
|
|
1.3557 |
| R2 |
|
|
1.3586 |
| R3 |
|
|
1.3625 |
| TECHNICAL INDICATORS |
| Name |
|
Value |
Action |
| 14DRSI |
|
58.177 |
Buy |
| 20-DMA |
|
1.3514 |
Buy |
| 50-DMA |
|
1.3503 |
Buy |
| 100-DMA |
|
1.3522 |
Buy |
| 200-DMA |
|
1.3565 |
Sell |
| STOCH(5,3) |
|
26.429 |
Sell |
| MACD(12,26,9) |
|
0.001 |
Buy |
|
|
|
|
USD/JPY
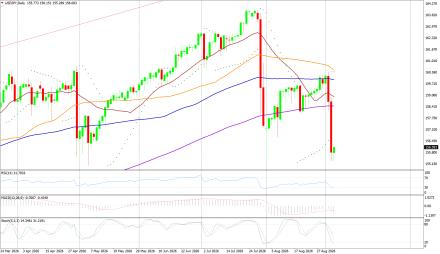
USD/JPY on Thursday made an intraday high of 158.97, a low of 155.30, and closed at 155.86 JPY/USD, -1.913% versus the session open.
Technicals in Focus:
USD/JPY fell 1.91% to 155.86 as markets increased expectations for a September BOJ rate increase and the dollar weakened. Price is below the 20-, 50-, 100- and 200-period averages, MACD is negative and ADX shows a strong trend. RSI at 27.86 is oversold, however, so fresh short positions carry rebound risk. The session low at 155.30 is the immediate breakdown point; 156.20-156.70 is the first recovery ceiling. Use smaller positions because oversold conditions, BOJ communication and intervention sensitivity can generate abrupt reversals.
Trading Strategy: Sell on Strength
Sell between 156.20-156.70 with risk above 158.12, targeting 155.30-154.45-153.04 and 150.78. Buy only above 158.12 with risk below 156.70, targeting 158.97-160.38 and 161.79. |
|
| Intraday Support Levels |
| S1 |
|
|
154.45 |
| S2 |
|
|
153.04 |
| S3 |
|
|
150.78 |
| INTRADAY RESISTANCE LEVELS |
| R1 |
|
|
158.12 |
| R2 |
|
|
160.38 |
| R3 |
|
|
161.79 |
| TECHNICAL INDICATORS |
| Name |
|
Value |
Action |
| 14DRSI |
|
27.859 |
Oversold / Sell |
| 20-DMA |
|
156.20 |
Sell |
| 50-DMA |
|
158.11 |
Sell |
| 100-DMA |
|
159.01 |
Sell |
| 200-DMA |
|
159.17 |
Sell |
| STOCH(9,6) |
|
56.359 |
Strong Trend |
| MACD(12,26,9) |
|
-0.730 |
Sell |
|
|
|
 |