 |
|
|
Daily Market Lookup
- Commodities: Gold and silver declined on September 4 after U.S. payroll growth of 162,000 exceeded the 56,000-consensus estimate, lifting the dollar, Treasury yields and expectations for a September Federal Reserve rate increase. Spot gold closed at 4,430.33 and silver at 66.2175. WTI settled at 91.22 after a volatile 88.75-92.16 session and retained a strong weekly advance as U.S.-Iran tensions and constrained Strait of Hormuz traffic kept supply risk elevated. Oil prices extended gains on Monday as tit-for-tat strikes between the U.S. and Iran on vessels sailing in the Strait of Hormuz and other areas heightened concerns of a prolonged supply disruption from the Middle East. Brent rose 7.8% last week while WTI gained nearly 10% after the U.S. and Iran resumed attacks and caused a reduction in oil flows through the Hormuz strait where a fifth of the world’s oil supply used to transit U.S. forces struck three Iranian oil tankers on Saturday, U.S. Central Command said, including one off the coast of Kharg Island, near Iran’s key oil export hub. The navy of Iran’s Islamic Revolutionary Guard Corps said on Saturday it targeted three oil tankers that were travelling through unauthorized routes in the Strait of Hormuz as well as three additional U.S. vessels in other areas.
- Foreign Exchange: The dollar strengthened after the payroll release before paring part of its advance. EUR/USD and GBP/USD ended modestly lower at 1.1614 and 1.3516, respectively, while USD/JPY rebounded to 156.25 as U.S. yields rose. Japan reiterated that authorities were monitoring excessive currency moves, leaving the yen sensitive to intervention rhetoric even as the wider rate differential continued to support the dollar.
- September 7 Risk Calendar: U.S. cash equity and Treasury markets are closed for Labor Day, and liquidity across foreign exchange and commodity markets may be thinner than normal. Weekend developments involving Iran and the Strait of Hormuz remain the principal gap risk for WTI and safe-haven assets. U.S. inflation data later in the week may also influence positioning. Strategies are based on the September 4 close and are not guarantees. Currency market participants were squarely focused on the U.S. nonfarm payrolls report. According to the U.S. Bureau of Labor Statistics, jobs increased by 162k in August, almost triple that of expectations of 55k. The unemployment rate remained unchanged at 4.1%. Meanwhile, total nonfarm payrolls for June and July were a combined 55k higher than previously reported.
- The data comes at a time when interest rates are under close scrutiny amid a complicated environment for the Fed. The central bank’s preferred measure of inflation, the personal consumption expenditures (PCE) price index, has remained above its long-term target of 2% for 65 straight months, leading to ructions within the Federal Open Market Committee (FOMC) over the future path of monetary policy.
- Traders added to bets that the Fed would deliver a rate hike later this month, as a combination of a resilient labor market and stubbornly high inflation hints at an overheating economy besieged by price pressures, and in such a scenario a central bank typically considers tightening policy. President Donald Trump touted the jobs report and instead called on the Fed to lower interest rates, threatening to stop trading with countries with a U.S. surplus otherwise.
- Government data earlier in the day showed Canada’s labor market weakened sharply in August, with employment falling by 41.7k jobs, as a burst of hiring earlier in the summer faded and businesses faced growing uncertainty from new U.S. tariffs. Economists had expected a gain of 15k jobs, while the August reading marked a sharp reversal from July’s 75.1k growth.
|
|
| Intraday RESISTANCE LEVELS |
| 7th September 2026 |
R1 |
R2 |
R3 |
| GOLD-XAU |
4,441.30 |
4,447.53 |
4,456.76 |
| Silver-XAG |
66.3496 |
66.4768 |
66.6611 |
| Crude Oil |
91.50 |
91.65 |
91.77 |
| EURO/USD |
1.1616 |
1.1619 |
1.1622 |
| GBP/USD |
1.3522 |
1.3526 |
1.3530 |
| USD/JPY |
156.26 |
156.29 |
156.32 |
| Intraday SUPPORTS LEVELS |
| 7th September 2026 |
S1 |
S2 |
S3 |
| GOLD-XAU |
4,425.84 |
4,416.61 |
4,410.38 |
| Silver-XAG |
66.0381 |
65.8538 |
65.7266 |
| Crude Oil |
91.23 |
91.11 |
90.96 |
| EURO/USD |
1.1610 |
1.1607 |
1.1604 |
| GBP/USD |
1.3514 |
1.3510 |
1.3506 |
| USD/JPY |
156.20 |
156.17 |
156.14 |
|
|
| Intra-Day Strategy (7th September 2026) |
| GOLD-XAU |
Sell on Strength |
| Silver-XAG |
Neutral to Sell |
|
| Crude Oil |
Buy on Dips |
| EUR/USD |
Sell on Strength |
|
| GBP/USD |
Neutral to Sell |
| USD/JPY |
Sell on Strength |
|
|
|
|
Gold – XAU
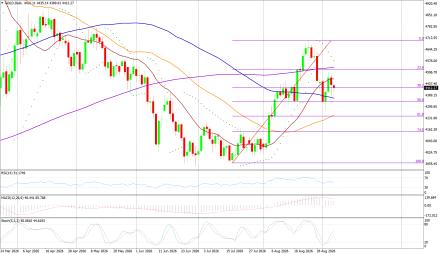
Gold - XAU/USD on Friday made an intraday high of 4,490.60, a low of 4,366.03, and closed at 4,430.33 US$/oz, -1.113% versus the session open.
Technicals in Focus:
Gold fell 1.11% to 4,430.33 after the August U.S. payroll report exceeded expectations and lifted the dollar, Treasury yields and Federal Reserve rate-hike pricing. Price closed below the 20-, 50- and 200-period averages but remained above the 100-period average at 4,409.47. RSI at 45.52 is neutral, while negative MACD keeps the near-term tone defensive. Initial resistance is 4,441-4,457; 4,426 and 4,411 are the first supports. Holiday-thinned liquidity can amplify gaps, so use reduced size.
Trading Strategy: Sell on Strength
Sell between 4,432-4,441 with risk above 4,457, targeting 4,426-4,417-4,410 and 4,395. Buy only above 4,457 with risk below 4,448, targeting 4,472-4,488 and 4,503. |
|
| Intraday Support Levels |
| S1 |
|
|
4,425.84 |
| S2 |
|
|
4,416.61 |
| S3 |
|
|
4,410.38 |
| Intraday Resistance Levels |
| R1 |
|
|
4,441.30 |
| R2 |
|
|
4,447.53 |
| R3 |
|
|
4,456.76 |
| Technical Indicators
|
| Name |
|
Value |
Action |
| 14DRSI |
|
45.523 |
Neutral |
| 20-DMA |
|
4,450.71 |
Sell |
| 50-DMA |
|
4,444.14 |
Sell |
| 100-DMA |
|
4,409.47 |
Buy |
| 200-DMA |
|
4,495.65 |
Sell |
| STOCH(5,3) |
|
28.586 |
Buy |
| MACD(12,26,9) |
|
-5.890 |
Sell |
|
|
|
|
Silver - XAG
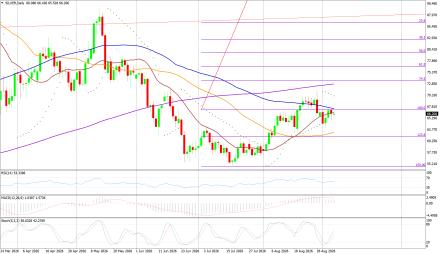
Silver - XAG/USD on Friday made an intraday high of 67.2140, a low of 64.7525, and closed at 66.2175 US$/oz, -1.128% versus the session open.
Technicals in Focus:
Silver declined 1.14% to 66.2175 after trading between 64.7525 and 67.2140. The stronger U.S. jobs report and firmer dollar reversed part of Thursday's rally. Price closed below the 20-, 50- and 200-period averages but above the 100-period average. RSI at 48.58 and stochastic at 54.48 are neutral, while slightly negative MACD limits upside momentum. Resistance is concentrated at 66.3496-66.6611. Avoid oversized positions during the holiday session.
Trading Strategy: Neutral to Sell
Sell between 66.3496-66.4768 with risk above 66.6611, targeting 66.0381-65.8538-65.7266 and 65.4151. Buy only above 66.6611 with risk below 66.4768, targeting 66.9726-67.2841 and 67.5956. |
|
| Intraday Support Levels |
| S1 |
|
|
66.0381 |
| S2 |
|
|
65.8538 |
| S3 |
|
|
65.7266 |
| Intraday Resistance Levels |
| R1 |
|
|
66.3496 |
| R2 |
|
|
66.4768 |
| R3 |
|
|
66.6611 |
| TECHNICAL INDICATORS |
| Name |
|
Value |
Action |
| 14DRSI |
|
48.576 |
Neutral |
| 20-DMA |
|
66.4192 |
Sell |
| 50-DMA |
|
66.2515 |
Sell |
| 100-DMA |
|
65.6888 |
Buy |
| 200-DMA |
|
67.0484 |
Sell |
| STOCH(5,3) |
|
15.629 |
Neutral |
| MACD(12,26,9) |
|
-0.073 |
Sell |
|
|
|
|
Oil - WTI
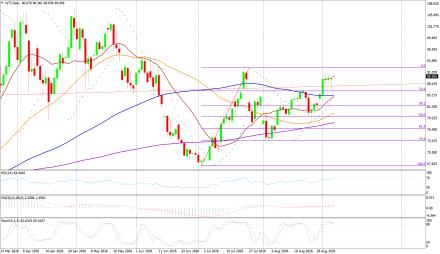
Crude Oil - WTI on Friday made an intraday high of 92.16, a low of 88.75, and closed at 91.22 US$/bbl, -0.458% versus the session open.
Technicals in Focus:
WTI futures closed at 91.22 after a volatile 88.75-92.16 session. The contract retained a strong weekly advance as renewed U.S.-Iran fighting and constrained Strait of Hormuz traffic kept supply risk elevated. Price remains above the 20-, 50-, 100- and 200-period averages, but stochastic at 81.52 is overbought and MACD has slipped marginally negative. The 91.50-91.77 band is immediate resistance.
Trading Strategy: Buy on Dips
Buy between 91.23-90.96 with risk below 90.69, targeting 91.50-91.65-91.77 and 92.04. Sell below 90.96 with risk above 91.38, targeting 90.69-90.42 and 90.15. |
|
| Intraday Support Levels |
| S1 |
|
|
91.23 |
| S2 |
|
|
91.11 |
| S3 |
|
|
90.96 |
| Intraday Resistance Levels |
| R1 |
|
|
91.50 |
| R2 |
|
|
91.65 |
| R3 |
|
|
91.77 |
| TECHNICAL INDICATORS |
| Name |
|
Value |
Action |
| 14DRSI |
|
51.511 |
Neutral |
| 20-DMA |
|
91.05 |
Buy |
| 50-DMA |
|
91.21 |
Buy |
| 100-DMA |
|
89.87 |
Buy |
| 200-DMA |
|
86.30 |
Buy |
| STOCH(5,3) |
|
36.434 |
Sell |
| MACD(12,26,9) |
|
-0.020 |
Sell |
|
|
|
|
EUR/USD
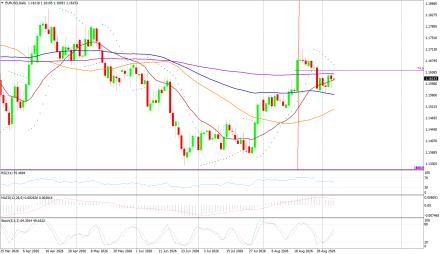
EUR/USD on Friday made an intraday high of 1.1633, a low of 1.1585, and closed at 1.1614 US$/EUR, -0.120% versus the session open.
Technicals in Focus:
EUR/USD eased 0.12% to 1.1614 after stronger U.S. payroll growth revived expectations for a September Federal Reserve rate increase. Price closed below the 20- and 200-period averages, at the 50-period average and above the 100-period average. RSI at 47.28 is neutral, MACD is flat and ADX shows a strong directional environment. The pair must recover 1.1619-1.1622 to improve the short-term tone. Use tighter risk controls in holiday-thinned trade.
Trading Strategy: Sell on Strength
Sell between 1.1616-1.1622 with risk above 1.1640, targeting 1.1610-1.1607-1.1604 and 1.1598. Buy only above 1.1622 with risk below 1.1613, targeting 1.1628-1.1634 and 1.1640. |
|
| Intraday Support Levels |
| S1 |
|
|
1.1610 |
| S2 |
|
|
1.1607 |
| S3 |
|
|
1.1604 |
| Intraday Resistance Levels |
| R1 |
|
|
1.1616 |
| R2 |
|
|
1.1619 |
| R3 |
|
|
1.1622 |
| TECHNICAL INDICATORS |
| Name |
|
Value |
Action |
| 14DRSI |
|
47.280 |
Neutral |
| 20-DMA |
|
1.1619 |
Sell |
| 50-DMA |
|
1.1614 |
Sell |
| 100-DMA |
|
1.1604 |
Buy |
| 200-DMA |
|
1.1622 |
Sell |
| STOCH(5,3) |
|
51.365 |
Sell |
| MACD(12,26,9) |
|
0.000 |
Neutral |
|
|
|
|
GBP/USD
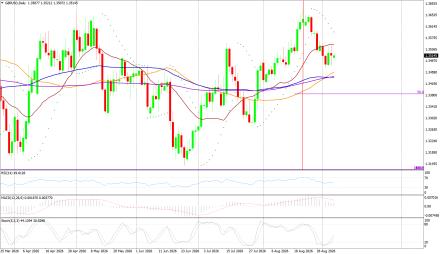
GBP/USD on Friday made an intraday high of 1.3548, a low of 1.3483, and closed at 1.3516 US$/GBP, -0.089% versus the session open.
Technicals in Focus:
GBP/USD slipped 0.10% to 1.3516 after failing to hold the post-payroll rebound. Price closed below the 20-, 100- and 200-period averages but marginally above the 50-period average at 1.3514. RSI at 48.21, flat MACD and neutral ADX show limited conviction, while stochastic at 59.99 leaves room for either direction. A recovery above 1.3530 is needed to restore a constructive bias. Keep exposure light during the U.S. holiday session.
Trading Strategy: Neutral to Sell
Sell between 1.3518-1.3526 with risk above 1.3538, targeting 1.3514-1.3510-1.3506 and 1.3498. Buy only above 1.3530 with risk below 1.3518, targeting 1.3538-1.3546 and 1.3554. |
|
| Intraday Support Levels |
| S1 |
|
|
1.3514 |
| S2 |
|
|
1.3510 |
| S3 |
|
|
1.3506 |
| Intraday Resistance Levels |
| R1 |
|
|
1.3522 |
| R2 |
|
|
1.3526 |
| R3 |
|
|
1.3530 |
| TECHNICAL INDICATORS |
| Name |
|
Value |
Action |
| 14DRSI |
|
48.205 |
Neutral |
| 20-DMA |
|
1.3524 |
Sell |
| 50-DMA |
|
1.3514 |
Buy |
| 100-DMA |
|
1.3518 |
Sell |
| 200-DMA |
|
1.3553 |
Sell |
| STOCH(5,3) |
|
23.182 |
Neutral |
| MACD(12,26,9) |
|
0.000 |
Neutral |
|
|
|
|
USD/JPY
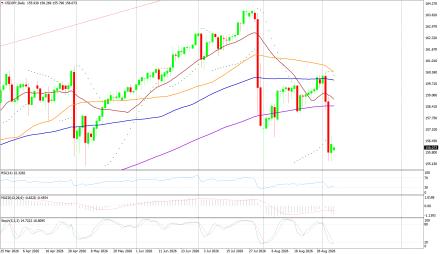
USD/JPY on Friday made an intraday high of 156.75, a low of 155.30, and closed at 156.25 JPY/USD, +0.392% versus the session open.
Technicals in Focus:
USD/JPY rebounded 0.39% to 156.25 as the strong U.S. jobs report lifted the dollar and Treasury yields. Price recovered above the 20-period average but remains below the 50-, 100- and 200-period averages, while MACD is still negative. RSI at 49.67 is neutral and stochastic at 57.91 supports consolidation. Japan reiterated readiness to respond to excessive yen weakness, leaving the pair sensitive to intervention headlines. Keep positions smaller because intervention rhetoric and weekend headlines can cause abrupt gaps.
Trading Strategy: Sell on Strength
Sell between 156.26-156.50 with risk above 156.75, targeting 156.20-156.17-156.14 and 156.08. Buy only above 156.50 with risk below 156.26, targeting 156.75-157.14 and 157.59. |
|
| Intraday Support Levels |
| S1 |
|
|
156.20 |
| S2 |
|
|
156.17 |
| S3 |
|
|
156.14 |
| INTRADAY RESISTANCE LEVELS |
| R1 |
|
|
156.26 |
| R2 |
|
|
156.29 |
| R3 |
|
|
156.32 |
| TECHNICAL INDICATORS |
| Name |
|
Value |
Action |
| 14DRSI |
|
49.665 |
Neutral |
| 20-DMA |
|
156.19 |
Buy |
| 50-DMA |
|
156.57 |
Sell |
| 100-DMA |
|
158.19 |
Sell |
| 200-DMA |
|
158.83 |
Sell |
| STOCH(9,6) |
|
25.870 |
Buy |
| MACD(12,26,9) |
|
-0.130 |
Sell |
|
|
|
 |