 |
|
|
Daily Market Lookup
- Commodities: Gold eased to 4,413.40 on September 7 as the strong U.S. jobs report kept Federal Reserve rate-increase expectations elevated, while silver edged higher to 66.3495. WTI reached a six-week high of 93.30 as escalating U.S.-Iran attacks and reduced Strait of Hormuz traffic increased supply-risk pricing. The Investing.com WTI end-of-session reference was 92.70; Reuters reported that NYMEX WTI did not have an official holiday settlement.
- Foreign Exchange: The dollar softened against major peers, with EUR/USD rising to 1.1625 and GBP/USD to 1.3542. USD/JPY produced the strongest move, falling 1.21% to 154.32 as markets priced faster Bank of Japan tightening, possible capital repatriation and carry-trade unwinding. The break below 155.00 reinforces the yen's recovery, although oversold readings raise the risk of a sharp corrective rebound. The yen approached its strongest level of the year after extending a rally that began last week. Traders have increasingly bet that the Bank of Japan will raise interest rates. The move has also helped weaken the dollar, which normally has an inverse relationship with gold. A weaker greenback makes dollar priced bullion cheaper for buyers using other currencies. Gold has therefore found support from the currency move even as other parts of the macro backdrop remain challenging.
- September 8 Risk Calendar: U.S. cash equity and Treasury markets reopen after Labor Day, so the reversal of holiday-thinned positioning may increase volatility. The U.S. NFIB small-business index is scheduled at 6:00 a.m. ET and consumer credit at 3:00 p.m. ET. Markets will also position for Thursday's expected ECB rate increase and U.S. producer-price data, followed by Friday's U.S. CPI report. Strategies are based on the September 7 close and are not guarantees. Investors are also watching U.S. inflation data later this week for clues on the Federal Reserve's next rate move.
- Fed outlook, inflation data remain key: Markets continue to price roughly a 60% chance of a Fed rate hike next week, reflecting the impact of last week’s stronger nonfarm payrolls report. The immediate test will come from U.S. consumer price data later this week, which could determine whether the recent increase in rate hike expectations is sustained.
Tony Sycamore, senior market analyst at IG, said gold finished lower overnight at around $4,406, pressured by Friday’s strong payrolls report and higher energy prices.
- He expects that combination to push U.S. Treasury yields higher when markets reopen, creating another headwind for bullion. China’s central bank demand also continues to provide a floor for gold, with the People’s Bank of China accelerating purchases in August to the highest monthly level since 2023, even as bullion prices surged.
|
|
| Intraday RESISTANCE LEVELS |
| 8th September 2026 |
R1 |
R2 |
R3 |
| GOLD-XAU |
4,419.26 |
4,431.28 |
4,443.07 |
| Silver-XAG |
66.6991 |
67.2353 |
67.7371 |
| Crude Oil |
93.30 |
93.87 |
94.44 |
| EURO/USD |
1.1632 |
1.1637 |
1.1641 |
| GBP/USD |
1.3549 |
1.3555 |
1.3562 |
| USD/JPY |
154.59 |
154.82 |
155.00 |
| Intraday SUPPORTS LEVELS |
| 8th September 2026 |
S1 |
S2 |
S3 |
| GOLD-XAU |
4,395.45 |
4,383.66 |
4,371.64 |
| Silver-XAG |
65.6611 |
65.1593 |
64.6231 |
| Crude Oil |
92.16 |
91.59 |
91.02 |
| EURO/USD |
1.1623 |
1.1619 |
1.1614 |
| GBP/USD |
1.3536 |
1.3529 |
1.3523 |
| USD/JPY |
154.18 |
154.00 |
153.77 |
|
|
| Intra-Day Strategy (8th September 2026) |
| GOLD-XAU |
Buy on Dips |
| Silver-XAG |
Neutral to Buy |
|
| Crude Oil |
Buy on Dips |
| EUR/USD |
Buy on Dips |
|
| GBP/USD |
Buy on Dips |
| USD/JPY |
Sell on Strength |
|
|
|
|
Gold – XAU
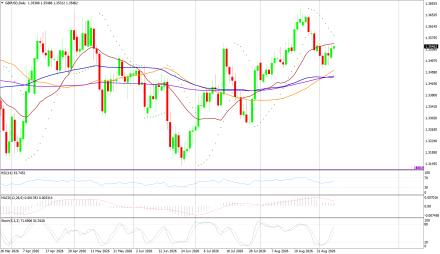
Gold - XAU/USD on Monday made an intraday high of 4,429.66, a low of 4,381.23, and closed at 4,413.40 US$/oz, -0.226% versus the session open.
Technicals in Focus:
Gold eased 0.23% to 4,413.40 as Friday's strong U.S. jobs report kept the market focused on a possible September Federal Reserve rate increase. Buying interest emerged below 4,400, while Middle East tensions continued to provide a safe-haven floor. Price remains below the 20- and 200-period averages but above the 50- and 100-period averages. RSI at 51.17 is neutral; positive MACD contrasts with a soft stochastic reading. Keep position size controlled ahead of U.S. inflation data later in the week.
Trading Strategy: Buy on Dips
Buy between 4,395-4,384 with risk below 4,372, targeting 4,419-4,431-4,443 and 4,491. Sell below 4,372 with risk above 4,395, targeting 4,324-4,276 and 4,229. |
|
| Intraday Support Levels |
| S1 |
|
|
4,395.45 |
| S2 |
|
|
4,383.66 |
| S3 |
|
|
4,371.64 |
| Intraday Resistance Levels |
| R1 |
|
|
4,419.26 |
| R2 |
|
|
4,431.28 |
| R3 |
|
|
4,443.07 |
| Technical Indicators
|
| Name |
|
Value |
Action |
| 14DRSI |
|
51.166 |
Neutral |
| 20-DMA |
|
4,470.05 |
Sell |
| 50-DMA |
|
4,255.78 |
Buy |
| 100-DMA |
|
4,347.47 |
Buy |
| 200-DMA |
|
4,541.09 |
Sell |
| STOCH(5,3) |
|
33.993 |
Sell |
| MACD(12,26,9) |
|
45.880 |
Buy |
|
|
|
|
Silver - XAG
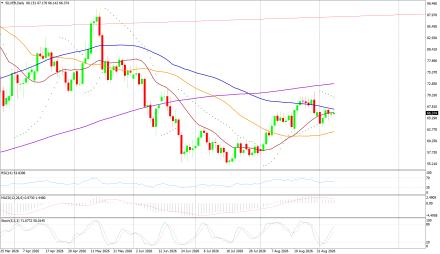
Silver - XAG/USD on Monday made an intraday high of 66.7335, a low of 65.4105, and closed at 66.3495 US$/oz, +0.297% versus the session open.
Technicals in Focus:
Silver gained 0.30% to 66.3495 despite the continuing pressure from stronger U.S. rate expectations. Price closed below the 20-, 100- and 200-period averages but remained above the 50-period average. RSI at 53.57 is neutral and MACD remains positive, while stochastic at 32.49 signals weak short-term momentum. The 66.6991-67.2353 band is the first resistance zone. Use smaller size because silver remains technically mixed.
Trading Strategy: Neutral to Buy
Buy between 66.1973-65.6611 with risk below 65.1593, targeting 66.6991-67.2353-67.7371 and 69.8131. Sell below 65.1593 with risk above 66.1973, targeting 64.6231-62.5471 and 60.4711. |
|
| Intraday Support Levels |
| S1 |
|
|
65.6611 |
| S2 |
|
|
65.1593 |
| S3 |
|
|
64.6231 |
| Intraday Resistance Levels |
| R1 |
|
|
66.6991 |
| R2 |
|
|
67.2353 |
| R3 |
|
|
67.7371 |
| TECHNICAL INDICATORS |
| Name |
|
Value |
Action |
| 14DRSI |
|
53.573 |
Neutral |
| 20-DMA |
|
66.5424 |
Sell |
| 50-DMA |
|
62.3124 |
Buy |
| 100-DMA |
|
67.3056 |
Sell |
| 200-DMA |
|
73.1221 |
Sell |
| STOCH(5,3) |
|
25.886 |
Neutral |
| MACD(12,26,9) |
|
1.101 |
Buy |
|
|
|
|
Oil - WTI
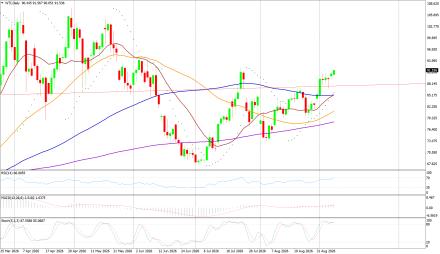
Crude Oil - WTI on Monday made an intraday high of 93.30, a low of 90.88, and ended at an Investing.com reference price of 92.70 US$/bbl, with no official exchange settlement because of the U.S. Labor Day holiday.
Technicals in Focus:
WTI reached a six-week high of 93.30 as escalating U.S.-Iran hostilities and reduced Strait of Hormuz traffic increased supply-risk pricing. The Investing.com end-of-session reference was 92.70. Price remains above all four major moving averages, and RSI, ADX and MACD support the advance. Stochastic at 86.49 is overbought, warning against chasing strength immediately below resistance.
Trading Strategy: Buy on Dips
Buy between 92.16-91.59 with risk below 91.02, targeting 93.30-93.87-94.44 and 96.72. Sell below 91.02 with risk above 92.16, targeting 88.74-86.46 and 84.18. *NYMEX WTI had no official September 7 settlement because of the U.S. holiday; 92.70 is Investing.com's reference price. The supplied FxPro broker-CFD chart can differ from exchange futures. |
|
| Intraday Support Levels |
| S1 |
|
|
92.16 |
| S2 |
|
|
91.59 |
| S3 |
|
|
91.02 |
| Intraday Resistance Levels |
| R1 |
|
|
93.30 |
| R2 |
|
|
93.87 |
| R3 |
|
|
94.44 |
| TECHNICAL INDICATORS |
| Name |
|
Value |
Action |
| 14DRSI |
|
69.026 |
Buy |
| 20-DMA |
|
86.15 |
Buy |
| 50-DMA |
|
81.36 |
Buy |
| 100-DMA |
|
86.14 |
Buy |
| 200-DMA |
|
79.08 |
Buy |
| STOCH(5,3) |
|
33.875 |
Buy |
| MACD(12,26,9) |
|
3.120 |
Buy |
|
|
|
|
EUR/USD
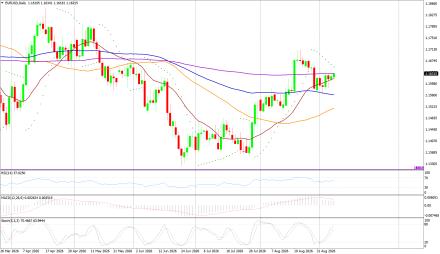
EUR/USD on Monday made an intraday high of 1.1636, a low of 1.1607, and closed at 1.1625 US$/EUR, +0.095% versus the session open.
Technicals in Focus:
EUR/USD advanced 0.10% to 1.1625 as broad dollar softness outweighed stronger U.S. rate expectations. The euro also drew support from improved regional investor sentiment and expectations for an ECB rate increase later this week. Price closed above the 20-, 50- and 100-period averages but just below the 200-period average at 1.1634. RSI, ADX and MACD are constructive, while stochastic remains soft.
Trading Strategy: Buy on Dips
Buy between 1.1623-1.1619 with risk below 1.1614, targeting 1.1632-1.1637-1.1641 and 1.1659. Sell below 1.1614 with risk above 1.1628, targeting 1.1596-1.1578 and 1.1560. A sustained break above 1.1641 would strengthen the recovery. |
|
| Intraday Support Levels |
| S1 |
|
|
1.1623 |
| S2 |
|
|
1.1619 |
| S3 |
|
|
1.1614 |
| Intraday Resistance Levels |
| R1 |
|
|
1.1632 |
| R2 |
|
|
1.1637 |
| R3 |
|
|
1.1641 |
| TECHNICAL INDICATORS |
| Name |
|
Value |
Action |
| 14DRSI |
|
56.778 |
Buy |
| 20-DMA |
|
1.1616 |
Buy |
| 50-DMA |
|
1.1517 |
Buy |
| 100-DMA |
|
1.1562 |
Buy |
| 200-DMA |
|
1.1634 |
Sell |
| STOCH(5,3) |
|
33.016 |
Buy |
| MACD(12,26,9) |
|
0.003 |
Buy |
|
|
|
|
GBP/USD
GBP/USD on Monday made an intraday high of 1.3548, a low of 1.3506, and closed at 1.3542 US$/GBP, +0.185% versus the session open.
Technicals in Focus:
GBP/USD rose 0.19% to 1.3542 as the dollar softened, while the British finance minister's policy speech produced little independent direction for sterling. Price remains below the 20-period average but above the 50-, 100- and 200-period averages. RSI at 53.19 is neutral, and positive ADX and MACD favor recovery; stochastic at 26.27 cautions that momentum is not yet fully confirmed. Hold longs only while price remains above the first three support levels.
Trading Strategy: Buy on Dips
Buy between 1.3536-1.3529 with risk below 1.3523, targeting 1.3549-1.3555-1.3562 and 1.3588. Sell below 1.3523 with risk above 1.3542, targeting 1.3497-1.3471 and 1.3445. |
|
| Intraday Support Levels |
| S1 |
|
|
1.3536 |
| S2 |
|
|
1.3529 |
| S3 |
|
|
1.3523 |
| Intraday Resistance Levels |
| R1 |
|
|
1.3549 |
| R2 |
|
|
1.3555 |
| R3 |
|
|
1.3562 |
| TECHNICAL INDICATORS |
| Name |
|
Value |
Action |
| 14DRSI |
|
53.186 |
Neutral |
| 20-DMA |
|
1.3557 |
Sell |
| 50-DMA |
|
1.3466 |
Buy |
| 100-DMA |
|
1.3443 |
Buy |
| 200-DMA |
|
1.3451 |
Buy |
| STOCH(5,3) |
|
35.690 |
Buy |
| MACD(12,26,9) |
|
0.002 |
Buy |
|
|
|
|
USD/JPY
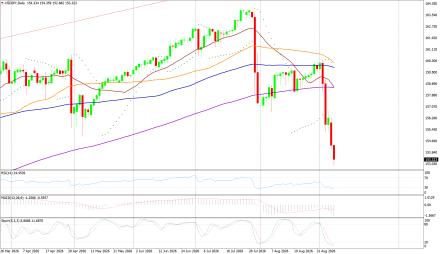
USD/JPY on Monday made an intraday high of 156.26, a low of 154.06, and closed at 154.32 JPY/USD, -1.210% versus the session open.
Technicals in Focus:
USD/JPY fell 1.21% to 154.32 and briefly reached 154.06, its lowest level since February. Expectations for faster Bank of Japan tightening, possible capital repatriation and carry-trade unwinding supported the yen. Price is below every major moving average, while ADX and negative MACD confirm the bearish trend. RSI at 26.58 is oversold, leaving the pair vulnerable to a corrective rebound.
Trading Strategy: Sell on Strength
Sell between 154.59-155.00 with risk above 155.82, targeting 154.18-154.00-153.77 and 152.95. Buy only above 155.00 with risk below 154.59, targeting 155.82-156.64 and 157.46. Avoid selling directly into 154.00 without rebound confirmation because RSI is oversold. |
|
| Intraday Support Levels |
| S1 |
|
|
154.18 |
| S2 |
|
|
154.00 |
| S3 |
|
|
153.77 |
| INTRADAY RESISTANCE LEVELS |
| R1 |
|
|
154.59 |
| R2 |
|
|
154.82 |
| R3 |
|
|
155.00 |
| TECHNICAL INDICATORS |
| Name |
|
Value |
Action |
| 14DRSI |
|
26.580 |
Sell |
| 20-DMA |
|
158.59 |
Sell |
| 50-DMA |
|
160.23 |
Sell |
| 100-DMA |
|
159.88 |
Sell |
| 200-DMA |
|
158.46 |
Sell |
| STOCH(9,6) |
|
37.061 |
Sell |
| MACD(12,26,9) |
|
-1.170 |
Sell |
|
|
|
 |