 |
|
|
Daily Market Lookup
- Commodities: Gold declined to 4,355.55 on September 8 as higher oil prices intensified inflation and Federal Reserve rate concerns, while silver fell to 65.7560. WTI rose sharply as attacks on Saudi energy infrastructure raised the Gulf supply-risk premium. Brent crude prices have jumped by a quarter since early August as hopes for a permanent resolution to the six-month-old war faded and as fighting flared again, with prices fast approaching the key $100-a-barrel mark. The Middle East war intensified on Tuesday with Iranian-backed Houthis in Yemen launching strikes on several Saudi cities, further embroiling a U.S. ally in the conflict. The U.S. forces hit multiple Iranian oil tankers and Iran targeted a U.S. base in Jordan.
- Foreign Exchange: The dollar was broadly steady: EUR/USD closed at 1.1627 and GBP/USD at 1.3541. USD/JPY fell to 153.64 after testing 152.89 as expectations for Bank of Japan tightening, capital repatriation and carry-trade unwinding supported the yen. Sterling was restrained after Bank of England Governor Andrew Bailey cautioned that another rate increase is not inevitable. The dollar slipped on Tuesday, taking a breather after advancing in the previous session on increased Federal Reserve rate hike bets. A furious rally in the Japanese yen continued to grab a chunk of the currency market’s spotlight The yen was last slightly weaker at 154.22, after earlier hitting 152.89, its strongest level against the dollar since January 30. The surge in the currency has been driven by a sharp recalibration of Japan’s monetary policy trajectory, reinforced by robust economic data and explicit government backing Japan’s gross domestic product growth was revised upward on Tuesday to show an annualized expansion of 1.4% in the April-June quarter, beating preliminary estimates of 1.1%. The data further supported the case for a rate hike by the Bank of Japan (BoJ) later this month, with the odds of such a move now at 75%. The yen is coming off its best week since late July, when authorities in Washington and Tokyo buoyed it with a historic joint intervention. While intervention speculation was rife last week as well, currency market participants pointed to rising rate hike expectations as a primary driver, amid hawkish commentary from BoJ policymakers such as Governor Kazuo Ueda and board member Hajime Takata.
- September 9 Risk Calendar: The U.S. calendar is comparatively light, although the Bureau of Labor Statistics is scheduled to publish second-quarter employer-cost data at 10:00 a.m. ET. The European Central Bank begins its two-day policy meeting, and markets will position for Thursday's ECB decision and U.S. producer-price report, followed by Friday's U.S. consumer-price report. Strategies are based on the September 8 close and are not guarantees.
|
|
| Intraday RESISTANCE LEVELS |
| 9th September 2026 |
R1 |
R2 |
R3 |
| GOLD-XAU |
4,403.98 |
4,432.18 |
4,454.91 |
| Silver-XAG |
66.6031 |
67.1303 |
67.6621 |
| Crude Oil |
94.41 |
95.21 |
96.50 |
| EURO/USD |
1.1635 |
1.1642 |
1.1650 |
| GBP/USD |
1.3559 |
1.3571 |
1.3585 |
| USD/JPY |
154.18 |
154.74 |
155.09 |
| Intraday SUPPORTS LEVELS |
| 9th September 2026 |
S1 |
S2 |
S3 |
| GOLD-XAU |
4,353.05 |
4,330.32 |
4,302.12 |
| Silver-XAG |
65.5441 |
65.0123 |
64.4851 |
| Crude Oil |
92.32 |
91.03 |
90.23 |
| EURO/USD |
1.1620 |
1.1612 |
1.1605 |
| GBP/USD |
1.3533 |
1.3519 |
1.3507 |
| USD/JPY |
153.27 |
152.92 |
152.36 |
|
|
| Intra-Day Strategy (9th September 2026) |
| GOLD-XAU |
Sell on Rallies |
| Silver-XAG |
Neutral to Buy |
|
| Crude Oil |
Buy on Dips |
| EUR/USD |
Buy on Dips |
|
| GBP/USD |
Neutral to Buy |
| USD/JPY |
Sell on Strength |
|
|
|
|
Gold – XAU
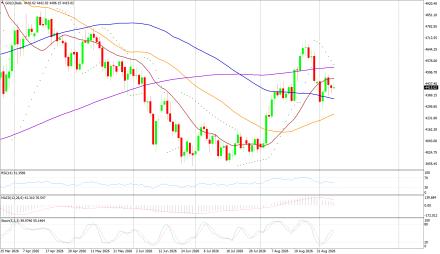
Gold - XAU/USD on Tuesday made an intraday high of 4,443.06, a low of 4,347.40, and closed at 4,355.55 US$/oz, -1.532% versus the session open.
Technicals in Focus:
Gold fell 1.53% to 4,355.55 as higher oil prices reinforced inflation concerns and expectations for a possible September Federal Reserve rate increase. The decline tested 4,347.40 before a modest recovery. Price is below the 20- and 200-period averages, but remains marginally above the 100-period average. RSI at 47.38 is neutral; positive MACD is offset by weak ADX and stochastic signals. Keep exposure controlled ahead of U.S. producer- and consumer-price data.
Trading Strategy: Sell on Rallies
Sell between 4,404-4,432 with risk above 4,455, targeting 4,353-4,330-4,302 and 4,200. Buy only above 4,455 with risk below 4,432, targeting 4,557-4,659 and 4,760. |
|
| Intraday Support Levels |
| S1 |
|
|
4,353.05 |
| S2 |
|
|
4,330.32 |
| S3 |
|
|
4,302.12 |
| Intraday Resistance Levels |
| R1 |
|
|
4,403.98 |
| R2 |
|
|
4,432.18 |
| R3 |
|
|
4,454.91 |
| Technical Indicators
|
| Name |
|
Value |
Action |
| 14DRSI |
|
47.381 |
Neutral |
| 20-DMA |
|
4,467.10 |
Sell |
| 50-DMA |
|
4,254.60 |
Buy |
| 100-DMA |
|
4,346.88 |
Buy |
| 200-DMA |
|
4,540.80 |
Sell |
| STOCH(5,3) |
|
32.498 |
Sell |
| MACD(12,26,9) |
|
41.180 |
Buy |
|
|
|
|
Silver - XAG
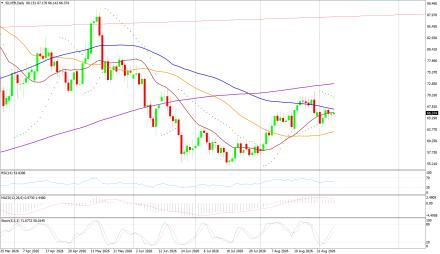
Silver - XAG/USD on Tuesday made an intraday high of 67.1805, a low of 65.5395, and closed at 65.7560 US$/oz, -1.215% versus the session open.
Technicals in Focus:
Silver declined 1.22% to 65.7560 after reaching 67.1805, leaving price below the 20-, 100- and 200-period averages but above the 50-period average. RSI at 51.04 is neutral, while positive ADX and MACD readings preserve the medium-term recovery signal. Stochastic at 31.82 indicates soft near-term momentum and makes the 65.5441-65.0123 support band important.
Trading Strategy: Neutral to Buy
Buy between 65.5441-65.0123 with risk below 64.4851, targeting 66.6031-67.1303-67.6621 and 69.7801. Sell below 64.4851 with risk above 65.5441, targeting 62.3671-60.2491 and 58.1311. |
|
| Intraday Support Levels |
| S1 |
|
|
65.5441 |
| S2 |
|
|
65.0123 |
| S3 |
|
|
64.4851 |
| Intraday Resistance Levels |
| R1 |
|
|
66.6031 |
| R2 |
|
|
67.1303 |
| R3 |
|
|
67.6621 |
| TECHNICAL INDICATORS |
| Name |
|
Value |
Action |
| 14DRSI |
|
51.038 |
Neutral |
| 20-DMA |
|
66.5267 |
Sell |
| 50-DMA |
|
62.3061 |
Buy |
| 100-DMA |
|
67.3025 |
Sell |
| 200-DMA |
|
73.1205 |
Sell |
| STOCH(5,3) |
|
29.557 |
Buy |
| MACD(12,26,9) |
|
1.069 |
Buy |
|
|
|
|
Oil - WTI
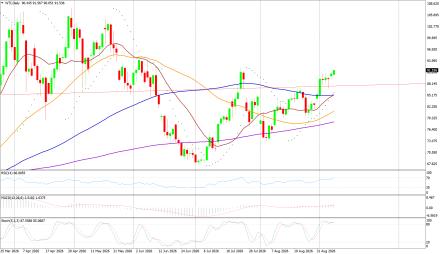
Crude Oil - WTI on Tuesday made an intraday high of 94.73, a low of 91.83, and ended at an Investing.com derived reference price of 94.22 US$/bbl, +1.859% versus the session open.
Technicals in Focus:
WTI advanced 1.84% to an Investing.com derived reference of 94.22 after touching 94.73, as attacks on Saudi energy infrastructure and continuing disruption risk around the Strait of Hormuz lifted the supply premium. Price remains above all four major moving averages, and RSI, ADX and MACD confirm a strong uptrend. RSI at 71.53 and stochastic at 82.35 are overbought, warning against chasing rallies.
Trading Strategy: Buy on Dips
Buy between 93.12-92.32 with risk below 91.03, targeting 94.41-95.21-96.50 and 100.68. Sell below 91.03 with risk above 92.32, targeting 90.23-86.05 and 81.87. |
|
| Intraday Support Levels |
| S1 |
|
|
92.32 |
| S2 |
|
|
91.03 |
| S3 |
|
|
90.23 |
| Intraday Resistance Levels |
| R1 |
|
|
94.41 |
| R2 |
|
|
95.21 |
| R3 |
|
|
96.50 |
| TECHNICAL INDICATORS |
| Name |
|
Value |
Action |
| 14DRSI |
|
71.532 |
Buy |
| 20-DMA |
|
86.74 |
Buy |
| 50-DMA |
|
81.87 |
Buy |
| 100-DMA |
|
86.16 |
Buy |
| 200-DMA |
|
79.26 |
Buy |
| STOCH(5,3) |
|
37.088 |
Buy |
| MACD(12,26,9) |
|
3.340 |
Buy |
|
|
|
|
EUR/USD
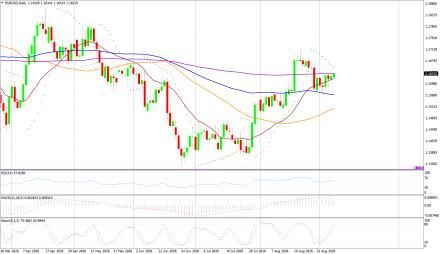
EUR/USD on Tuesday made an intraday high of 1.1636, a low of 1.1608, and closed at 1.1627 US$/EUR, -0.009% versus the session open.
Technicals in Focus:
EUR/USD was nearly unchanged at 1.1627 as traders balanced a softer dollar against renewed U.S. inflation and rate concerns. The euro remained supported ahead of the European Central Bank meeting, where markets expect another policy-rate increase. Price is above the 20-, 50- and 100-period averages but just below the 200-period average at 1.1634. RSI, ADX and MACD are constructive, while stochastic remains soft.
Trading Strategy: Buy on Dips
Buy between 1.1620-1.1612 with risk below 1.1605, targeting 1.1635-1.1642-1.1650 and 1.1680. Sell below 1.1605 with risk above 1.1620, targeting 1.1575-1.1545 and 1.1515. A sustained move above 1.1650 would strengthen the recovery. |
|
| Intraday Support Levels |
| S1 |
|
|
1.1620 |
| S2 |
|
|
1.1612 |
| S3 |
|
|
1.1605 |
| Intraday Resistance Levels |
| R1 |
|
|
1.1635 |
| R2 |
|
|
1.1642 |
| R3 |
|
|
1.1650 |
| TECHNICAL INDICATORS |
| Name |
|
Value |
Action |
| 14DRSI |
|
56.525 |
Buy |
| 20-DMA |
|
1.1617 |
Buy |
| 50-DMA |
|
1.1517 |
Buy |
| 100-DMA |
|
1.1562 |
Buy |
| 200-DMA |
|
1.1634 |
Sell |
| STOCH(5,3) |
|
31.175 |
Buy |
| MACD(12,26,9) |
|
0.003 |
Buy |
|
|
|
|
GBP/USD
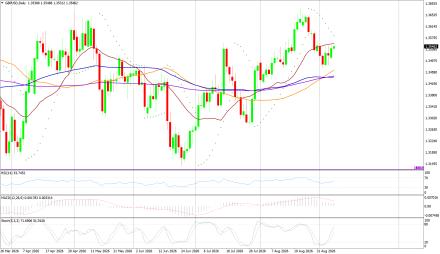
GBP/USD on Tuesday made an intraday high of 1.3562, a low of 1.3522, and closed at 1.3541 US$/GBP, -0.044% versus the session open.
Technicals in Focus:
GBP/USD eased 0.04% to 1.3541 as Bank of England Governor Andrew Bailey pushed back against treating another rate increase as inevitable. Price remains below the 20-period average but above the 50-, 100- and 200-period averages. RSI at 52.77 and ADX are neutral; positive MACD supports the broader recovery, while stochastic at 28.96 shows limited near-term momentum. . Keep longs only while the first three support levels remain intact.
Trading Strategy: Neutral to Buy
Buy between 1.3533-1.3519 with risk below 1.3507, targeting 1.3559-1.3571-1.3585 and 1.3637. Sell below 1.3507 with risk above 1.3533, targeting 1.3455-1.3403 and 1.3351. |
|
| Intraday Support Levels |
| S1 |
|
|
1.3533 |
| S2 |
|
|
1.3519 |
| S3 |
|
|
1.3507 |
| Intraday Resistance Levels |
| R1 |
|
|
1.3559 |
| R2 |
|
|
1.3571 |
| R3 |
|
|
1.3585 |
| TECHNICAL INDICATORS |
| Name |
|
Value |
Action |
| 14DRSI |
|
52.771 |
Neutral |
| 20-DMA |
|
1.3558 |
Sell |
| 50-DMA |
|
1.3467 |
Buy |
| 100-DMA |
|
1.3443 |
Buy |
| 200-DMA |
|
1.3451 |
Buy |
| STOCH(5,3) |
|
34.363 |
Neutral |
| MACD(12,26,9) |
|
0.002 |
Buy |
|
|
|
|
USD/JPY
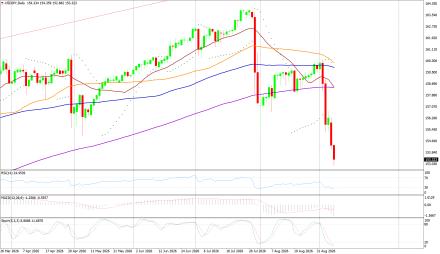
USD/JPY on Tuesday made an intraday high of 154.42, a low of 152.89, and closed at 153.64 JPY/USD, -0.124% versus the session open.
Technicals in Focus:
USD/JPY fell 0.12% to 153.64 after reaching 152.89, the lowest level since February. Expectations for a Bank of Japan rate increase, repatriation flows and carry-trade unwinding continued to support the yen. Price is below every major moving average, while ADX and negative MACD confirm the bearish trend. RSI at 25.34 is oversold, increasing the risk of a sharp corrective rebound. Avoid selling directly into 152.92 without rebound confirmation because RSI is oversold.
Trading Strategy: Sell on Strength
Sell between 154.18-154.74 with risk above 155.09, targeting 153.27-152.92-152.36 and 150.54. Buy only above 155.09 with risk below 154.74, targeting 156.91-158.73 and 160.55. |
|
| Intraday Support Levels |
| S1 |
|
|
153.27 |
| S2 |
|
|
152.92 |
| S3 |
|
|
152.36 |
| INTRADAY RESISTANCE LEVELS |
| R1 |
|
|
154.18 |
| R2 |
|
|
154.74 |
| R3 |
|
|
155.09 |
| TECHNICAL INDICATORS |
| Name |
|
Value |
Action |
| 14DRSI |
|
25.343 |
Sell |
| 20-DMA |
|
158.44 |
Sell |
| 50-DMA |
|
160.17 |
Sell |
| 100-DMA |
|
159.85 |
Sell |
| 200-DMA |
|
158.44 |
Sell |
| STOCH(9,6) |
|
38.608 |
Sell |
| MACD(12,26,9) |
|
-1.370 |
Sell |
|
|
|
 |