 |
|
|
Daily Market Lookup
- Commodities: Gold rebounded 1.19% to 4,402.00 on September 9 and silver advanced 2.58% to 67.2845 as the dollar stayed subdued. WTI climbed sharply as tanker attacks and reduced Strait of Hormuz traffic intensified supply risk. Gold prices were little changed on Thursday as investors awaited U.S. inflation data for clues on whether the Federal Reserve will raise interest rates at its meeting next week.
- Higher Treasury yields and renewed Middle East tensions remain near term headwinds, although a softer dollar and longer term demand for bullion continue to offer support Gold has traded in a relatively narrow range around $4,400 in recent weeks after rebounding from a floor near $4,000 in July. Investors have continued to weigh the metal's longer term appeal as a portfolio hedge against near term pressure from higher bond yields and worsening tensions in the Middle East.
- Foreign Exchange: EUR/USD rose to 1.1635 and GBP/USD edged up to 1.3550. USD/JPY closed at 153.58, holding near a seven-month low as expectations for Bank of Japan tightening, repatriation flows and carry-trade unwinding continued to support the yen. The euro also drew support from expectations for another European Central Bank rate increase. The U.S. dollar made small moves on Wednesday, as the focus remained on the Japanese yen amid its massive rally. Currency market participants were gearing up for a crucial week ahead that will see interest rate decisions from the Federal Reserve, the Bank of Japan, and the European Central Bank The U.S. bond market was also in the spotlight after a highly anticipated Treasury Department update on buyback operations disappointed investors.
The Japanese yen has emerged as the standout performer among major currencies, boasting a 4% surge in September alone. Its explosive rally since the start of this month took it to as high as 152.89 against the dollar on Tuesday. The currency has been buoyed by a combination of Bank of Japan (BoJ) policy tightening expectations and widespread intervention speculation. Financial markets are pricing in a near-certainty of a 25 basis point rate hike by the BoJ on September 18, and traders believe Governor Kazuo Ueda could signal additional normalization before year-end.
- September 10 Risk Calendar: The European Central Bank policy decision and press conference are the principal euro risk events. In the United States, the producer-price report and weekly jobless claims are scheduled for 8:30 a.m. ET. The data will shape Federal Reserve expectations ahead of Friday's consumer-price report. Strategies are based on the September 9 close and are not guarantees.
|
|
| Intraday RESISTANCE LEVELS |
| 10th September 2026 |
R1 |
R2 |
R3 |
| GOLD-XAU |
4,429.03 |
4,458.58 |
4,485.45 |
| Silver-XAG |
68.1759 |
69.1162 |
69.9054 |
| Crude Oil |
97.22 |
97.78 |
98.80 |
| EURO/USD |
1.1648 |
1.1665 |
1.1679 |
| GBP/USD |
1.3563 |
1.3579 |
1.3593 |
| USD/JPY |
153.90 |
154.17 |
154.54 |
| Intraday SUPPORTS LEVELS |
| 10th September 2026 |
S1 |
S2 |
S3 |
| GOLD-XAU |
4,372.61 |
4,345.74 |
4,316.19 |
| Silver-XAG |
66.4464 |
65.6572 |
64.7169 |
| Crude Oil |
95.64 |
94.62 |
94.06 |
| EURO/USD |
1.1617 |
1.1603 |
1.1586 |
| GBP/USD |
1.3533 |
1.3519 |
1.3503 |
| USD/JPY |
153.26 |
152.89 |
152.62 |
|
|
| Intra-Day Strategy (10th September 2026) |
| GOLD-XAU |
Buy on Dips |
| Silver-XAG |
Buy on Dips |
|
| Crude Oil |
Buy on Dips |
| EUR/USD |
Buy on Dips |
|
| GBP/USD |
Neutral to Buy |
| USD/JPY |
Sell on Strength |
|
|
|
|
Gold – XAU
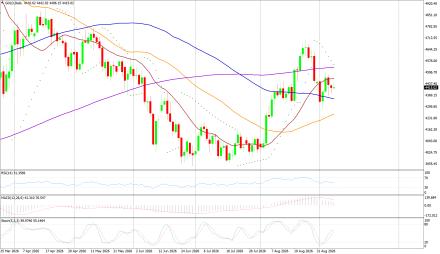
Gold - XAU/USD on Wednesday made an intraday high of 4,434.23, a low of 4,341.61, and closed at 4,402.00 US$/oz, +1.201% versus the session open.
Technicals in Focus:
Gold rose 1.19% to 4,402.00 after trading between 4,341.61 and 4,434.23. A softer dollar and renewed safe-haven demand supported bullion as oil above $100 reinforced inflation risk ahead of U.S. producer- and consumer-price releases. Price remains below the 20- and 200-period averages but above the 50- and 100-period averages. RSI at 50.64 is neutral; positive MACD is balanced by neutral ADX and a soft stochastic reading. Keep exposure controlled around U.S. producer-price data and the European Central Bank decision.
Trading Strategy: Buy on Dips
Buy between 4,373-4,346 with risk below 4,316, targeting 4,429-4,459-4,485 and 4,598. Sell below 4,316 with risk above 4,346, targeting 4,203-4,091 and 3,978. |
|
| Intraday Support Levels |
| S1 |
|
|
4,372.61 |
| S2 |
|
|
4,345.74 |
| S3 |
|
|
4,316.19 |
| Intraday Resistance Levels |
| R1 |
|
|
4,429.03 |
| R2 |
|
|
4,458.58 |
| R3 |
|
|
4,485.45 |
| Technical Indicators
|
| Name |
|
Value |
Action |
| 14DRSI |
|
50.635 |
Neutral |
| 20-DMA |
|
4,465.62 |
Sell |
| 50-DMA |
|
4,261.56 |
Buy |
| 100-DMA |
|
4,343.28 |
Buy |
| 200-DMA |
|
4,541.66 |
Sell |
| STOCH(5,3) |
|
31.370 |
Neutral |
| MACD(12,26,9) |
|
33.800 |
Buy |
|
|
|
|
Silver - XAG
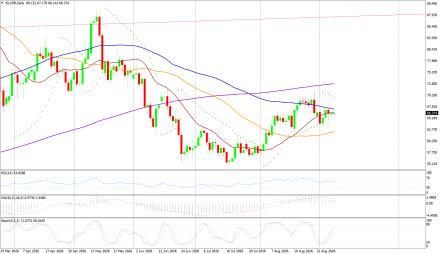
Silver - XAG/USD on Wednesday made an intraday high of 68.3270, a low of 65.5920, and closed at 67.2845 US$/oz, +2.576% versus the session open.
Technicals in Focus:
Silver rallied 2.58% to 67.2845 after reaching 68.3270, outperforming gold as the dollar stayed subdued and precious-metal demand strengthened. Price is above the 20-, 50- and 100-period averages but remains below the 200-period average. RSI at 56.24, ADX at 36.00 and positive MACD favour the recovery, while stochastic at 37.39 warns that near-term momentum is not yet fully confirmed. Use smaller size around U.S. inflation releases because silver remains volatile.
Trading Strategy: Buy on Dips
Buy between 66.4464-65.6572 with risk below 64.7169, targeting 68.1759-69.1162-69.9054 and 73.3644. Sell below 64.7169 with risk above 65.6572, targeting 61.2579-57.7989 and 54.3399. |
|
| Intraday Support Levels |
| S1 |
|
|
66.4464 |
| S2 |
|
|
65.6572 |
| S3 |
|
|
64.7169 |
| Intraday Resistance Levels |
| R1 |
|
|
68.1759 |
| R2 |
|
|
69.1162 |
| R3 |
|
|
69.9054 |
| TECHNICAL INDICATORS |
| Name |
|
Value |
Action |
| 14DRSI |
|
56.243 |
Buy |
| 20-DMA |
|
66.6054 |
Buy |
| 50-DMA |
|
62.4608 |
Buy |
| 100-DMA |
|
67.1942 |
Buy |
| 200-DMA |
|
73.1626 |
Sell |
| STOCH(5,3) |
|
35.995 |
Buy |
| MACD(12,26,9) |
|
1.069 |
Biuy |
|
|
|
|
Oil - WTI
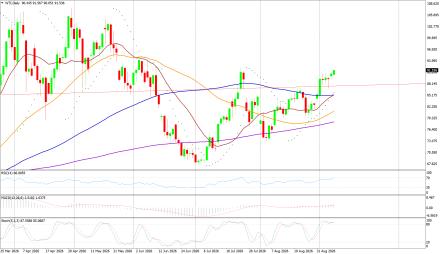
Crude Oil - WTI on Wednesday made an intraday high of 96.92, a low of 93.77, and closed at 96.67 US$/bbl, +2.513% versus the session open.
Technicals in Focus:
WTI surged 3.91% to 96.67 on the Investing.com historical table after touching 96.92. Renewed U.S.-Iran tanker attacks and sharply reduced traffic through the Strait of Hormuz lifted the supply-risk premium; Reuters reported Brent settling at 101.21. Price is above all four major moving averages, while ADX and MACD confirm a strong uptrend. RSI at 75.44 is overbought, so chasing strength carries elevated reversal risk.
Trading Strategy: Buy on Dips
Buy between 96.20-95.64 with risk below 94.62, targeting 97.22-97.78-98.80 and 101.96. Sell below 94.62 with risk above 95.64, targeting 94.06-90.90-87.74 and 84.58. |
|
| Intraday Support Levels |
| S1 |
|
|
95.64 |
| S2 |
|
|
94.62 |
| S3 |
|
|
94.06 |
| Intraday Resistance Levels |
| R1 |
|
|
97.22 |
| R2 |
|
|
97.78 |
| R3 |
|
|
98.80 |
| TECHNICAL INDICATORS |
| Name |
|
Value |
Action |
| 14DRSI |
|
75.442 |
Overbought |
| 20-DMA |
|
87.51 |
Buy |
| 50-DMA |
|
82.41 |
Buy |
| 100-DMA |
|
86.19 |
Buy |
| 200-DMA |
|
79.44 |
Buy |
| STOCH(5,3) |
|
30.979 |
Buy |
| MACD(12,26,9) |
|
3.610 |
Buy |
|
|
|
|
EUR/USD
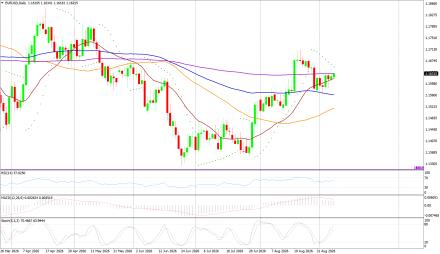
EUR/USD on Wednesday made an intraday high of 1.1654, a low of 1.1620, and closed at 1.1635 US$/EUR, +0.060% versus the session open.
Technicals in Focus:
EUR/USD gained 0.06% to 1.1635, holding near a two-week high as the dollar stayed subdued ahead of U.S. inflation data. The euro was also supported by expectations that the European Central Bank will raise its deposit rate at Thursday's meeting. Price is above all four major moving averages, while RSI at 58.54, ADX and MACD are constructive. Stochastic at 50.04 is neutral rather than overextended.
Trading Strategy: Buy on Dips
Buy between 1.1634-1.1617 with risk below 1.1603, targeting 1.1648-1.1665-1.1679 and 1.1741. Sell below 1.1603 with risk above 1.1617, targeting 1.1586-1.1524 and 1.1462. Reduce exposure before the European Central Bank decision and press conference. |
|
| Intraday Support Levels |
| S1 |
|
|
1.1617 |
| S2 |
|
|
1.1603 |
| S3 |
|
|
1.1586 |
| Intraday Resistance Levels |
| R1 |
|
|
1.1648 |
| R2 |
|
|
1.1665 |
| R3 |
|
|
1.1679 |
| TECHNICAL INDICATORS |
| Name |
|
Value |
Action |
| 14DRSI |
|
58.542 |
Buy |
| 20-DMA |
|
1.1622 |
Buy |
| 50-DMA |
|
1.1522 |
Buy |
| 100-DMA |
|
1.1561 |
Buy |
| 200-DMA |
|
1.1634 |
Buy |
| STOCH(5,3) |
|
28.979 |
Buy |
| MACD(12,26,9) |
|
0.003 |
Buy |
|
|
|
|
GBP/USD
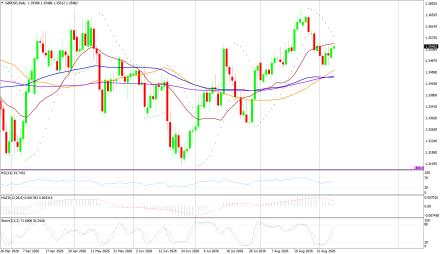
GBP/USD on Wednesday made an intraday high of 1.3568, a low of 1.3531, and closed at 1.3550 US$/GBP, +0.044% versus the session open.
Technicals in Focus:
GBP/USD edged 0.04% higher to 1.3550 after trading between 1.3531 and 1.3568. Sterling was restrained as the dollar stabilised and traders awaited the European Central Bank decision and U.S. producer-price data. Price remains below the 20-period average but above the 50-, 100- and 200-period averages. RSI and ADX are neutral; positive MACD supports the broader recovery, while stochastic at 35.19 shows soft near-term momentum.
Trading Strategy: Neutral to Buy
Buy between 1.3549-1.3533 with risk below 1.3519, targeting 1.3563-1.3579-1.3593 and 1.3653. Sell below 1.3519 with risk above 1.3533, targeting 1.3503-1.3443 and 1.3383. Keep positions smaller while short-term momentum remains mixed. |
|
| Intraday Support Levels |
| S1 |
|
|
1.3533 |
| S2 |
|
|
1.3519 |
| S3 |
|
|
1.3503 |
| Intraday Resistance Levels |
| R1 |
|
|
1.3563 |
| R2 |
|
|
1.3579 |
| R3 |
|
|
1.3593 |
| TECHNICAL INDICATORS |
| Name |
|
Value |
Action |
| 14DRSI |
|
54.459 |
Neutral |
| 20-DMA |
|
1.3561 |
Sell |
| 50-DMA |
|
1.3472 |
Buy |
| 100-DMA |
|
1.3444 |
Buy |
| 200-DMA |
|
1.3452 |
Buy |
| STOCH(5,3) |
|
30.549 |
Neutral |
| MACD(12,26,9) |
|
0.002 |
Buy |
|
|
|
|
USD/JPY
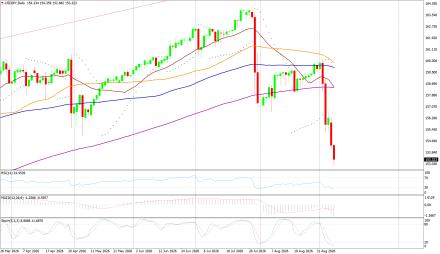
USD/JPY on Wednesday made an intraday high of 153.83, a low of 152.95, and closed at 153.58 JPY/USD, +0.078% versus the session open.
Technicals in Focus:
USD/JPY edged 0.08% higher to 153.58 but remained near a seven-month low after testing 152.95. Expectations for Bank of Japan tightening, repatriation flows and pressure on yen-funded carry trades continued to support the Japanese currency. Price is below every major moving average, while ADX and negative MACD confirm the bearish trend. RSI at 24.46 is oversold, increasing the risk of a sharp corrective rebound.
Trading Strategy: Sell on Strength
Sell between 153.90-154.17 with risk above 154.54, targeting 153.26-152.89-152.62 and 151.34. Buy only above 154.54 with risk below 154.17, targeting 155.82-157.10 and 158.38. Avoid selling directly into 152.89 without rebound confirmation because RSI is oversold. |
|
| Intraday Support Levels |
| S1 |
|
|
153.26 |
| S2 |
|
|
152.89 |
| S3 |
|
|
152.62 |
| INTRADAY RESISTANCE LEVELS |
| R1 |
|
|
153.90 |
| R2 |
|
|
154.17 |
| R3 |
|
|
154.54 |
| TECHNICAL INDICATORS |
| Name |
|
Value |
Action |
| 14DRSI |
|
24.457 |
Oversold |
| 20-DMA |
|
158.15 |
Sell |
| 50-DMA |
|
159.99 |
Sell |
| 100-DMA |
|
159.79 |
Sell |
| 200-DMA |
|
158.43 |
Sell |
| STOCH(9,6) |
|
37.212 |
Sell |
| MACD(12,26,9) |
|
-1.560 |
Sell |
|
|
|
 |