 |
|
|
Daily Market Lookup
- Commodities: Gold fell 1.74% to 4,317.58 and silver dropped 5.38% to 63.5955 as stronger U.S. producer prices lifted the dollar and yields. WTI surged as tanker attacks and restricted Gulf and Red Sea shipping intensified supply risk. Oil prices rose further on Friday, with Brent near four-month highs as more attacks on shipping in the Middle East pointed to continued disruptions in supplies. Oil was also headed for strong gains this week as the U.S. and Iran carried out some of their worst attacks on shipping since the onset of the conflict. Oil soared past $100 a barrel earlier this week after Iran said it attacked 10 ships near the Strait of Hormuz, while the U.S. said it had retaliated by sinking five Iranian tankers. The strikes marked some of their worst fighting in months, and pointed to little de-escalation in the conflict as it neared the seven-month mark. Yemen’s Iran-backed Houthi group added to concerns over more supply disruptions in the Middle East, after several reports said the group had seized control of the port city of Mocha and gained more leverage over the Bab el-Mandeb Strait. The U.S.-Iran war showed few signs of de-escalating. U.S. President Donald Trump said he expects the war to end immediately after the November midterm elections, although a Wall Street Journal report showed top White House advisers seeing the war extending through the remainder of Trump’s term to early-2029.
- Gold prices were little changed on Friday after falling nearly 2% overnight, as a hotter U.S. producer price report, surging oil prices and higher Treasury yields reinforced expectations for a Federal Reserve rate hike next week. A stronger dollar and rising Treasury yields added to the pressure ahead of the Federal Reserve’s September 14 to 15 meeting Gold remains on track for a third consecutive weekly decline after dropping 1.8% on Thursday, its sharpest daily fall in recent weeks. The latest pressure followed U.S. producer price data showing the index rose 0.4% in August, the strongest increase since May. The data reinforced concerns that rising energy costs are feeding into broader inflation just days before the Fed’s policy decision.
- Foreign Exchange: EUR/USD fell to 1.1609 after the European Central Bank raised its deposit rate to 2.50%, while GBP/USD declined to 1.3512. USD/JPY rebounded to 154.43 as firm U.S. producer prices and higher Treasury yields supported the dollar, although Bank of Japan tightening expectations continue to underpin the yen.
- The U.S. dollar rose on Thursday, as an acceleration in annual headline U.S. producer inflation led to a firming of Federal Reserve rate hike expectations. The bond market added to its slump after the data, with yields surging and further driving up borrowing costs Meanwhile, the euro slipped after the European Central Bank (ECB) delivered a rate hike, as widely expected. Elsewhere, the yen halted a furious rally ahead of anticipated monetary policy tightening from the Bank of Japan (BoJ). Currency market participants on Thursday were focused on the August U.S. producer price index (PPI) report According to the Bureau of Labor Statistics, headline PPI ticked up 0.4% M/M and 5.4% Y/Y in August, versus consensus estimates of 0.4% and 5.3%, respectively. Moreover, headline figures for July were revised up to an increase of 0.1% M/M and 4.8% Y/Y On a core basis, PPI inched up 0.2% M/M and 4.6% Y/Y, compared to consensus estimates of 0.3% and 4.6%, respectively. The PPI report comes a day ahead of the more closely-watched consumer price index (CPI) data, and comes just days after a blockbuster August nonfarm payrolls report. Taken together, the indicators point to a highly resilient U.S. labor market and an economy besieged by price pressures. In such a scenario, a central bank typically considers tightening monetary policy.
- September 11 Risk Calendar: The U.S. consumer-price report is scheduled for 8:30 a.m. ET and is the principal market risk event. UK industrial production, manufacturing output and trade-balance releases precede it during the European session. The data may drive sharp moves in rate expectations, the dollar, metals and energy. Strategies are based on the September 10 close and are not guarantees.
|
|
| Intraday RESISTANCE LEVELS |
| 11th September 2026 |
R1 |
R2 |
R3 |
| GOLD-XAU |
4,352.91 |
4,389.06 |
4,408.38 |
| Silver-XAG |
64.2191 |
64.8428 |
65.2071 |
| Crude Oil |
103.20 |
104.75 |
107.79 |
| EURO/USD |
1.1625 |
1.1639 |
1.1649 |
| GBP/USD |
1.3529 |
1.3545 |
1.3557 |
| USD/JPY |
154.61 |
154.78 |
155.06 |
| Intraday SUPPORTS LEVELS |
| 11th September 2026 |
S1 |
S2 |
S3 |
| GOLD-XAU |
4,297.44 |
4,278.12 |
4,241.97 |
| Silver-XAG |
63.2311 |
62.8668 |
62.2431 |
| Crude Oil |
98.61 |
95.57 |
94.02 |
| EURO/USD |
1.1601 |
1.1591 |
1.1577 |
| GBP/USD |
1.3501 |
1.3489 |
1.3473 |
| USD/JPY |
154.16 |
153.88 |
153.71 |
|
|
| Intra-Day Strategy (11th September 2026) |
| GOLD-XAU |
Sell on Strength |
| Silver-XAG |
Sell on Strength |
|
| Crude Oil |
Buy on Dips |
| EUR/USD |
Sell on Strength |
|
| GBP/USD |
Sell on Strength |
| USD/JPY |
Sell on Strength |
|
|
|
|
Gold – XAU
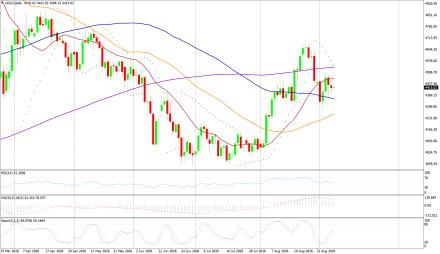
Gold - XAU/USD on Thursday made an intraday high of 4,434.13, a low of 4,314.27, and closed at 4,317.58 US$/oz, -1.741% versus the session open.
Technicals in Focus:
Gold fell 1.74% to 4,317.58 after trading between 4,314.27 and 4,434.13. Stronger U.S. producer prices, a firmer dollar and rising Treasury yields increased expectations of Federal Reserve tightening, outweighing safe-haven demand from the Middle East conflict. Price is below the 20-, 100- and 200-period averages but remains above the 50-period average. RSI at 45.63 is neutral and MACD remains positive, although ADX and stochastic readings favour sellers.
Trading Strategy: Sell on Strength
Sell between 4,333.59-4,352.91 with risk above 4,389.06, targeting 4,297.44-4,278.12-4,241.97 and 4,131.03. Buy only above 4,389.06 with risk below 4,352.91, targeting 4,408.38-4,519.32 and 4,630.26. Keep exposure controlled around the U.S. consumer-price release. |
|
| Intraday Support Levels |
| S1 |
|
|
4,297.44 |
| S2 |
|
|
4,278.12 |
| S3 |
|
|
4,241.97 |
| Intraday Resistance Levels |
| R1 |
|
|
4,352.91 |
| R2 |
|
|
4,389.06 |
| R3 |
|
|
4,408.38 |
| Technical Indicators
|
| Name |
|
Value |
Action |
| 14DRSI |
|
45.626 |
Neutral |
| 20-DMA |
|
4,464.11 |
Sell |
| 50-DMA |
|
4,265.51 |
Buy |
| 100-DMA |
|
4,339.55 |
Sell |
| 200-DMA |
|
4,542.23 |
Sell |
| STOCH(5,3) |
|
30.041 |
Sell |
| MACD(12,26,9) |
|
23.080 |
Buy |
|
|
|
|
Silver - XAG
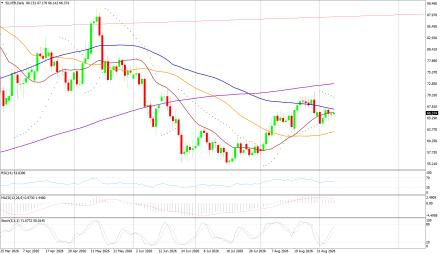
Silver - XAG/USD on Thursday made an intraday high of 67.9315, a low of 63.4905, and closed at 63.5955 US$/oz, -5.377% versus the session open.
Technicals in Focus:
Silver dropped 5.38% to 63.5955 after trading between 63.4905 and 67.9315, underperforming gold as the dollar and bond yields strengthened. Price fell below the 20-, 100- and 200-period averages but held above the 50-period average. RSI at 45.21 is neutral and MACD remains positive, while stochastic at 34.36 points to weak near-term momentum. The wide daily range signals elevated volatility ahead of U.S. consumer-price data.
Trading Strategy: Sell on Strength
Sell between 63.8548-64.2191 with risk above 64.8428, targeting 63.2311-62.8668-62.2431 and 60.2671. Buy only above 64.8428 with risk below 64.2191, targeting 65.2071-67.1831 and 69.1591. Use smaller position size because silver remains highly volatile. |
|
| Intraday Support Levels |
| S1 |
|
|
63.2311 |
| S2 |
|
|
62.8668 |
| S3 |
|
|
62.2431 |
| Intraday Resistance Levels |
| R1 |
|
|
64.2191 |
| R2 |
|
|
64.8428 |
| R3 |
|
|
65.2071 |
| TECHNICAL INDICATORS |
| Name |
|
Value |
Action |
| 14DRSI |
|
45.209 |
Neutral |
| 20-DMA |
|
66.5673 |
Sell |
| 50-DMA |
|
62.5145 |
Buy |
| 100-DMA |
|
67.0769 |
Sell |
| 200-DMA |
|
73.1955 |
Sell |
| STOCH(5,3) |
|
32.302 |
Neutral |
| MACD(12,26,9) |
|
0.776 |
Buy |
|
|
|
|
Oil - WTI
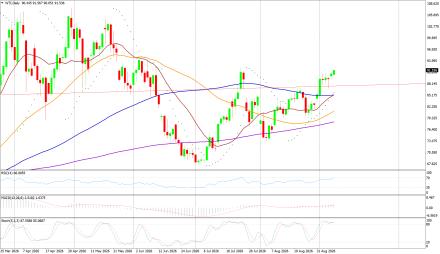
Crude Oil - WTI on Thursday made an intraday high of 104.02, a low of 95.39, and closed at 103.93 US$/bbl, +6.803% versus the session open.
Technicals in Focus:
WTI advanced 6.80% from the session open to 103.93 on the Investing.com historical table after reaching 104.02. Intensifying tanker attacks, restricted Strait of Hormuz traffic and new threats to Red Sea shipping drove the supply-risk premium sharply higher. Price is above all four major moving averages, while ADX and MACD confirm the uptrend. RSI at 81.85 is overbought, so the market is vulnerable to abrupt profit-taking despite strong momentum.
Trading Strategy: Buy on Dips
Buy between 103.20-100.16 with risk below 98.61, targeting 104.75-107.79 and 116.97. Sell below 98.61 with risk above 100.16, targeting 95.57-94.02 and 84.84. |
|
| Intraday Support Levels |
| S1 |
|
|
98.61 |
| S2 |
|
|
95.57 |
| S3 |
|
|
94.02 |
| Intraday Resistance Levels |
| R1 |
|
|
103.20 |
| R2 |
|
|
104.75 |
| R3 |
|
|
107.79 |
| TECHNICAL INDICATORS |
| Name |
|
Value |
Action |
| 14DRSI |
|
81.854 |
Overbought |
| 20-DMA |
|
88.54 |
Buy |
| 50-DMA |
|
83.09 |
Buy |
| 100-DMA |
|
86.26 |
Buy |
| 200-DMA |
|
79.66 |
Buy |
| STOCH(5,3) |
|
31.314 |
Buy |
| MACD(12,26,9) |
|
4.310 |
Buy |
|
|
|
|
EUR/USD
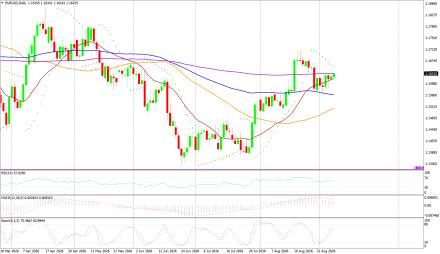
EUR/USD on Thursday made an intraday high of 1.1642, a low of 1.1592, and closed at 1.1609 US$/EUR, -0.215% versus the session open.
Technicals in Focus:
EUR/USD fell 0.21% to 1.1609 after trading between 1.1592 and 1.1642. The euro weakened after the European Central Bank raised its deposit rate to 2.50%, as investors weighed the growth cost of further tightening, while firm U.S. producer prices supported the dollar. Price is below the 20- and 200-period averages but above the 50- and 100-period averages. RSI and stochastic are neutral; positive MACD is offset by a bearish ADX signal.
Trading Strategy: Sell on Strength
Sell between 1.1615-1.1625 with risk above 1.1639, targeting 1.1601-1.1591-1.1577 and 1.1529. Buy only above 1.1639 with risk below 1.1625, targeting 1.1649-1.1697 and 1.1745. Reduce exposure before the U.S. consumer-price release. |
|
| Intraday Support Levels |
| S1 |
|
|
1.1601 |
| S2 |
|
|
1.1591 |
| S3 |
|
|
1.1577 |
| Intraday Resistance Levels |
| R1 |
|
|
1.1625 |
| R2 |
|
|
1.1639 |
| R3 |
|
|
1.1649 |
| TECHNICAL INDICATORS |
| Name |
|
Value |
Action |
| 14DRSI |
|
52.966 |
Neutral |
| 20-DMA |
|
1.1626 |
Sell |
| 50-DMA |
|
1.1526 |
Buy |
| 100-DMA |
|
1.1560 |
Buy |
| 200-DMA |
|
1.1634 |
Sell |
| STOCH(5,3) |
|
27.170 |
Sell |
| MACD(12,26,9) |
|
0.002 |
Buy |
|
|
|
|
GBP/USD
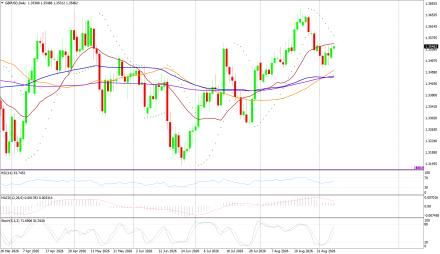
GBP/USD on Thursday made an intraday high of 1.3561, a low of 1.3491, and closed at 1.3512 US$/GBP, -0.280% versus the session open.
Technicals in Focus:
GBP/USD declined 0.28% to 1.3512 after trading between 1.3491 and 1.3561 as stronger U.S. producer prices lifted the dollar and global yields. Price is below the 20-period average but remains above the 50-, 100- and 200-period averages. RSI at 48.20 is neutral and MACD remains marginally positive, while ADX and stochastic readings favour sellers. UK output and trade releases add event risk to the next session.
Trading Strategy: Sell on Strength
Sell between 1.3517-1.3529 with risk above 1.3545, targeting 1.3501-1.3489-1.3473 and 1.3417. Buy only above 1.3545 with risk below 1.3529, targeting 1.3557-1.3613 and 1.3669. Keep positions smaller ahead of UK data and the U.S. consumer-price report. |
|
| Intraday Support Levels |
| S1 |
|
|
1.3501 |
| S2 |
|
|
1.3489 |
| S3 |
|
|
1.3473 |
| Intraday Resistance Levels |
| R1 |
|
|
1.3529 |
| R2 |
|
|
1.3545 |
| R3 |
|
|
1.3557 |
| TECHNICAL INDICATORS |
| Name |
|
Value |
Action |
| 14DRSI |
|
48.200 |
Nuetral |
| 20-DMA |
|
1.3562 |
Sell |
| 50-DMA |
|
1.3475 |
Buy |
| 100-DMA |
|
1.3444 |
Buy |
| 200-DMA |
|
1.3453 |
Buy |
| STOCH(5,3) |
|
32.493 |
Sell |
| MACD(12,26,9) |
|
0.001 |
Buy |
|
|
|
|
USD/JPY
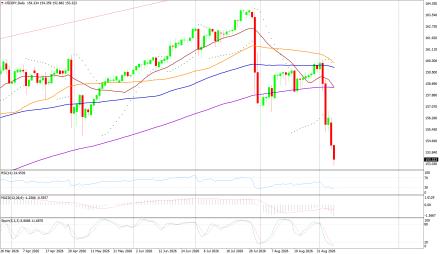
USD/JPY on Thursday made an intraday high of 154.67, a low of 153.30, and closed at 154.43 JPY/USD, +0.580% versus the session open.
Technicals in Focus:
USD/JPY rose 0.58% to 154.43 after trading between 153.30 and 154.67 as firm U.S. producer prices and higher Treasury yields supported the dollar. The pair nevertheless remains close to its recent seven-month low, with Bank of Japan tightening expectations continuing to support the yen. Price is below every major moving average, while ADX, negative MACD and stochastic readings confirm the broader bearish trend. RSI at 31.21 is near oversold territory, leaving room for sharp rebounds. Avoid aggressive selling near support because momentum is already stretched.
Trading Strategy: Sell on Strength
Sell between 154.61-154.78 with risk above 155.06, targeting 154.16-153.88-153.71 and 152.81. Buy only above 155.06 with risk below 154.78, targeting 155.96-156.86 and 157.76. |
|
| Intraday Support Levels |
| S1 |
|
|
154.16 |
| S2 |
|
|
153.88 |
| S3 |
|
|
153.71 |
| INTRADAY RESISTANCE LEVELS |
| R1 |
|
|
154.61 |
| R2 |
|
|
154.78 |
| R3 |
|
|
155.06 |
| TECHNICAL INDICATORS |
| Name |
|
Value |
Action |
| 14DRSI |
|
31.206 |
Sell |
| 20-DMA |
|
157.93 |
Sell |
| 50-DMA |
|
159.87 |
Sell |
| 100-DMA |
|
159.74 |
Sell |
| 200-DMA |
|
158.43 |
Sell |
| STOCH(9,6) |
|
33.566 |
Sell |
| MACD(12,26,9) |
|
-1.590 |
Sell |
|
|
|
 |